

Development of a novel disulfidptosis-related lncRNA signature for prognostic and immune response prediction in clear cell renal cell carcinoma
- PMID: 38182642
- PMCID: PMC10770353
- DOI: 10.1038/s41598-024-51197-2
Development of a novel disulfidptosis-related lncRNA signature for prognostic and immune response prediction in clear cell renal cell carcinoma
Abstract
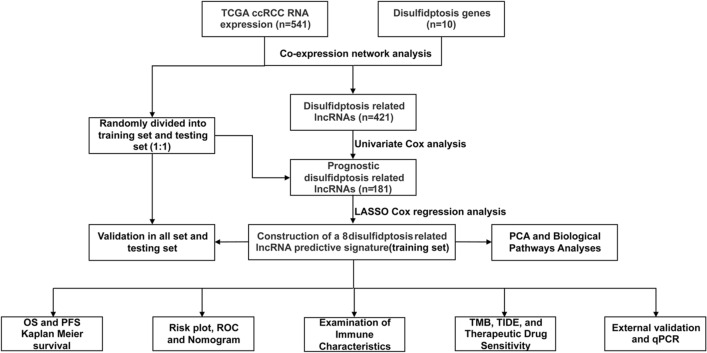
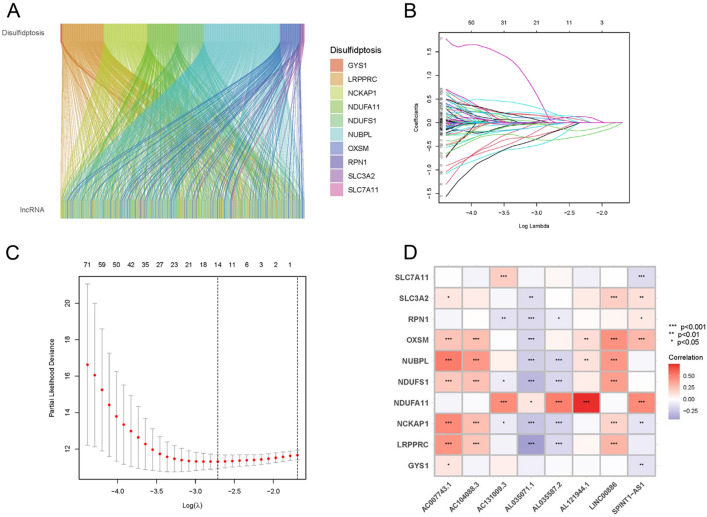
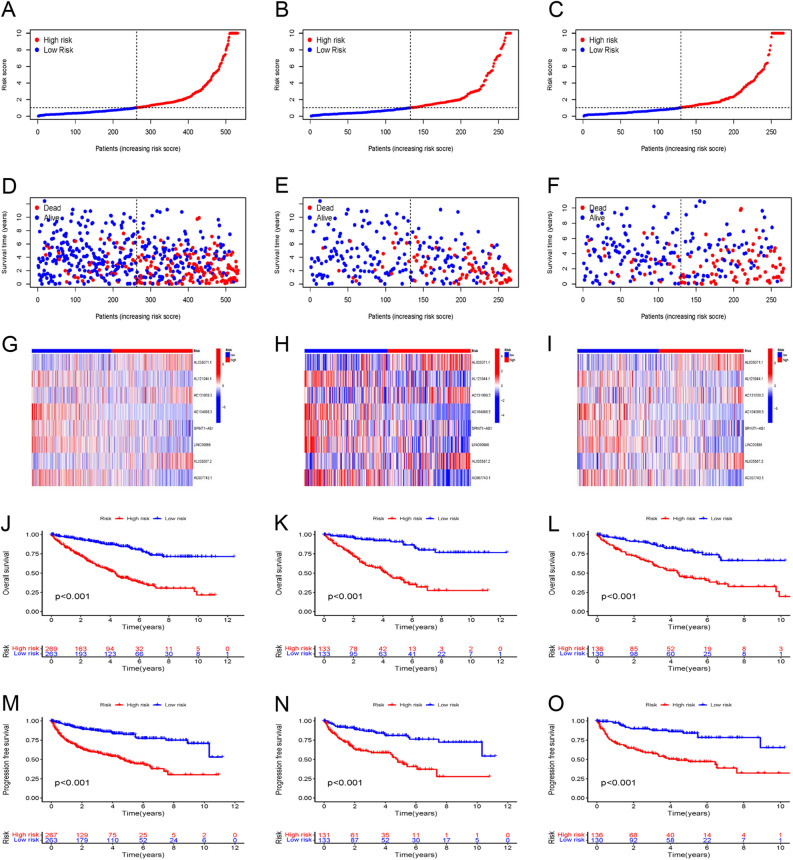
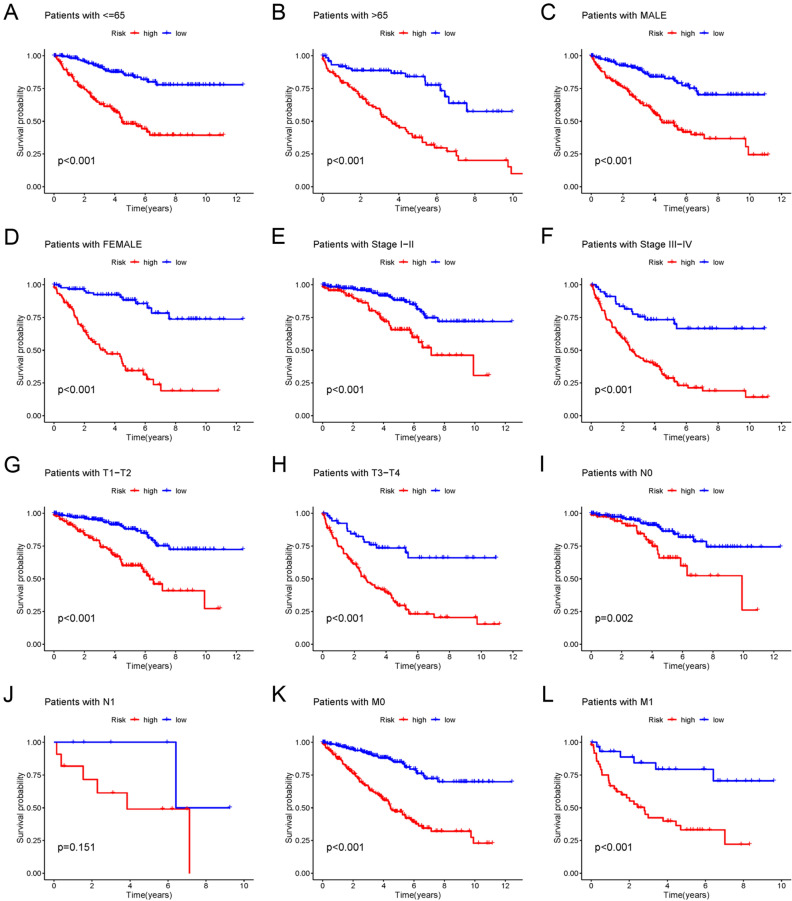
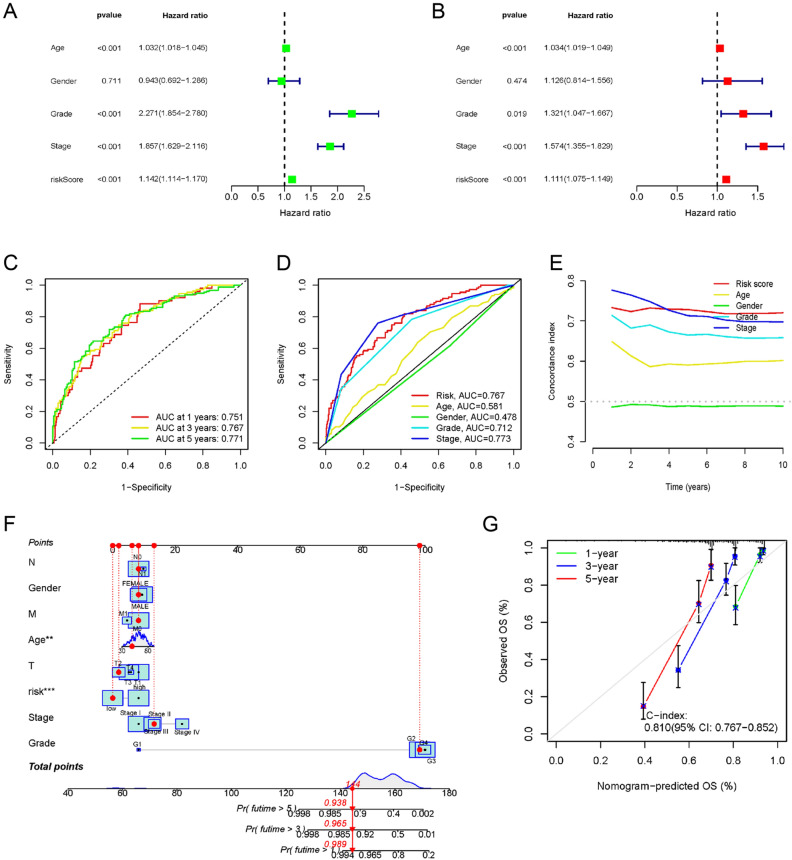
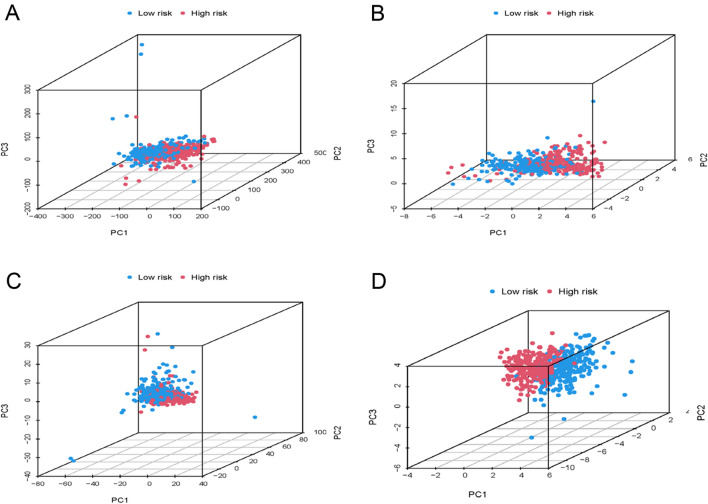
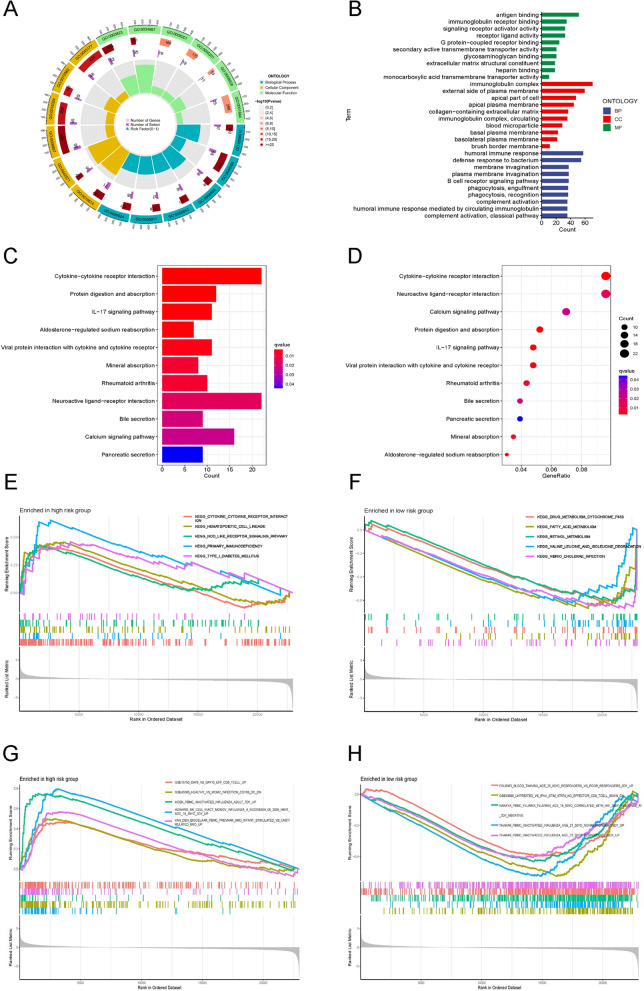
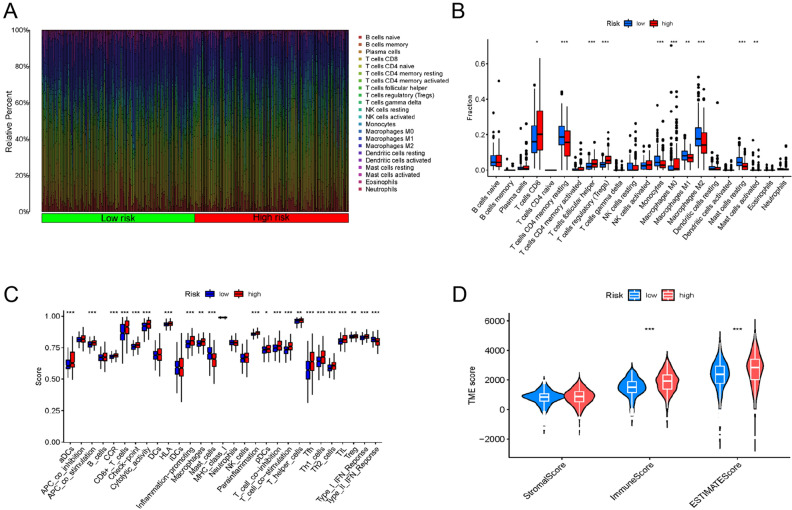
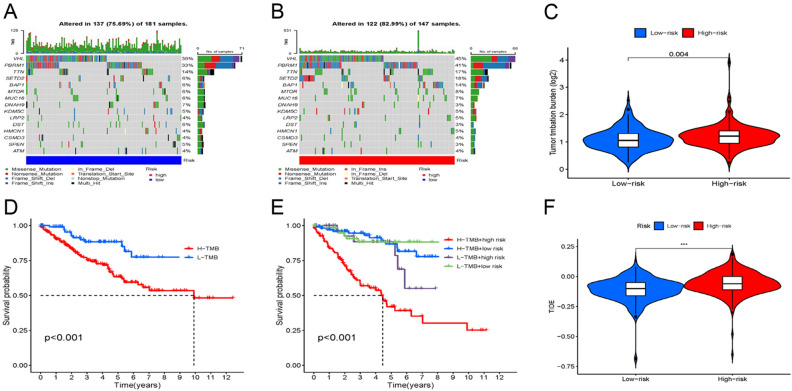
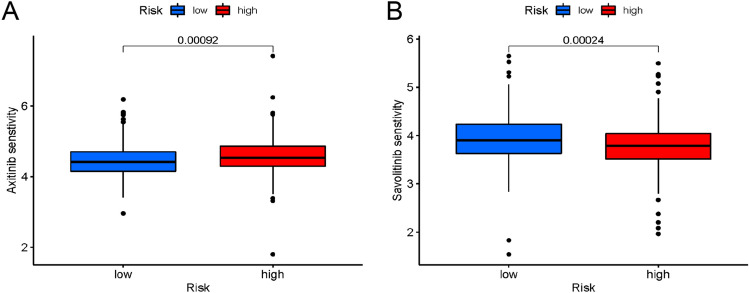
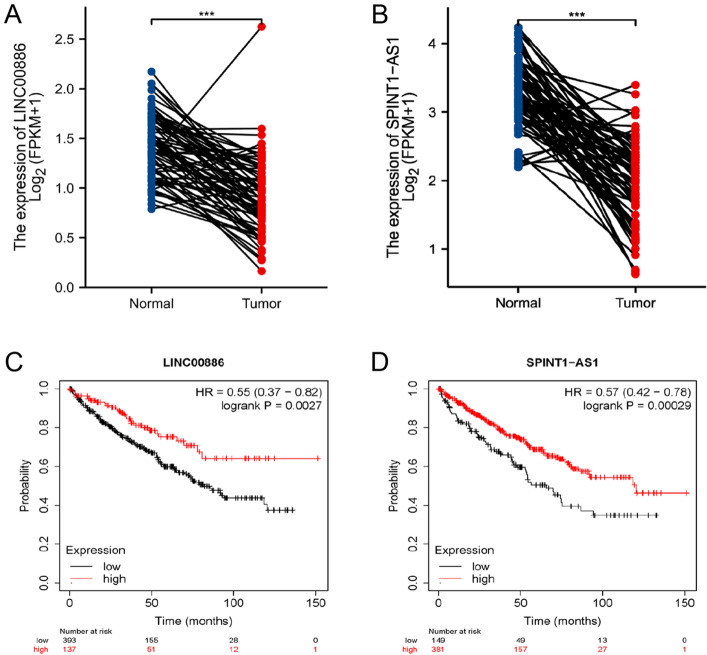
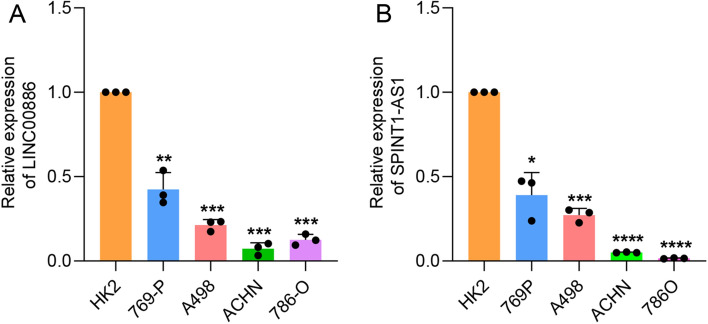
Disulfidptosis, a novel form of regulated cell death, occurs due to the aberrant accumulation of intracellular cystine and other disulfides. Moreover, targeting disulfidptosis could identify promising approaches for cancer treatment. Long non-coding RNAs (lncRNAs) are known to be critically implicated in clear cell renal cell carcinoma (ccRCC) development. Currently, the involvement of disulfidptosis-related lncRNAs in ccRCC is yet to be elucidated. This study primarily dealt with identifying and validating a disulfidptosis-related lncRNAs-based signature for predicting the prognosis and immune landscape of individuals with ccRCC. Clinical and RNA sequencing data of ccRCC samples were accessed from The Cancer Genome Atlas (TCGA) database. Pearson correlation analysis was conducted for the identification of the disulfidptosis-related lncRNAs. Additionally, univariate Cox regression analysis, Least Absolute Shrinkage and Selection Operator Cox regression, and stepwise multivariate Cox analysis were executed to develop a novel risk prognostic model. The prognosis-predictive capacity of the model was then assessed using an integrated method. Variation in biological function was noted using GO, KEGG, and GSEA. Additionally, immune cell infiltration, the tumor mutational burden (TMB), and tumor immune dysfunction and exclusion (TIDE) scores were calculated to investigate differences in the immune landscape. Finally, the expression of hub disulfidptosis-related lncRNAs was validated using qPCR. We established a novel signature comprised of eight lncRNAs that were associated with disulfidptosis (SPINT1-AS1, AL121944.1, AC131009.3, AC104088.3, AL035071.1, LINC00886, AL035587.2, and AC007743.1). Kaplan-Meier and receiver operating characteristic curves demonstrated the acceptable predictive potency of the model. The nomogram and C-index confirmed the strong correlation between the risk signature and clinical decision-making. Furthermore, immune cell infiltration analysis and ssGSEA revealed significantly different immune statuses among risk groups. TMB analysis revealed the link between the high-risk group and high TMB. It is worth noting that the cumulative effect of the patients belonging to the high-risk group and having elevated TMB led to decreased patient survival times. The high-risk group depicted greater TIDE scores in contrast with the low-risk group, indicating greater potential for immune escape. Finally, qPCR validated the hub disulfidptosis-related lncRNAs in cell lines. The established novel signature holds potential regarding the prognosis prediction of individuals with ccRCC as well as predicting their responses to immunotherapy.
© 2024. The Author(s).
Conflict of interest statement
The authors declare no competing interests.
Figures
Similar articles
-
Integrated Bioinformatics and Experimental Validation to Identify a Disulfidptosis-Related lncRNA Model for Prognostic Prediction in Papillary Renal Cell Carcinoma.Comb Chem High Throughput Screen. 2025;28(5):883-898. doi: 10.2174/0113862073303084240403051346. Comb Chem High Throughput Screen. 2025. PMID: 38639274
-
Investigating the prognostic role of lncRNAs associated with disulfidptosis-related genes in clear cell renal cell carcinoma.J Gene Med. 2024 Jan;26(1):e3608. doi: 10.1002/jgm.3608. Epub 2023 Oct 28. J Gene Med. 2024. PMID: 37897262
-
Disulfideptosis-associated lncRNAs reveal features of prognostic, immune escape, tumor mutation, and tumor malignant progression in renal clear cell carcinoma.Aging (Albany NY). 2024 Feb 8;16(4):3280-3301. doi: 10.18632/aging.205534. Epub 2024 Feb 8. Aging (Albany NY). 2024. PMID: 38334964 Free PMC article.
-
A new CCCH-type zinc finger-related lncRNA signature predicts the prognosis of clear cell renal cell carcinoma patients.Front Genet. 2022 Sep 30;13:1034567. doi: 10.3389/fgene.2022.1034567. eCollection 2022. Front Genet. 2022. PMID: 36246657 Free PMC article.
-
Development and experimental verification of a prognosis model for disulfidptosis-associated genes in HNSCC.Medicine (Baltimore). 2024 Mar 22;103(12):e37308. doi: 10.1097/MD.0000000000037308. Medicine (Baltimore). 2024. PMID: 38518012 Free PMC article. Review.
Cited by
-
Disulfidptosis in tumor progression.Cell Death Discov. 2025 Apr 28;11(1):205. doi: 10.1038/s41420-025-02495-9. Cell Death Discov. 2025. PMID: 40295497 Free PMC article. Review.
-
Cellular hierarchy framework based on single-cell and bulk RNA sequencing reveals fatty acid metabolic biomarker MYDGF as a therapeutic target for ccRCC.Front Immunol. 2025 Jun 5;16:1615601. doi: 10.3389/fimmu.2025.1615601. eCollection 2025. Front Immunol. 2025. PMID: 40539074 Free PMC article.
References
MeSH terms
Substances
Grants and funding
LinkOut - more resources
Full Text Sources
Medical
Miscellaneous
