. 2024 Feb;25(2):316-329.
doi: 10.1038/s41590-023-01717-5. Epub 2024 Jan 5.

Distinct baseline immune characteristics associated with responses to conjugated and unconjugated pneumococcal polysaccharide vaccines in older adults

Affiliations

Distinct baseline immune characteristics associated with responses to conjugated and unconjugated pneumococcal polysaccharide vaccines in older adults

Sathyabaarathi Ravichandran et al. Nat Immunol. 2024 Feb.

Abstract

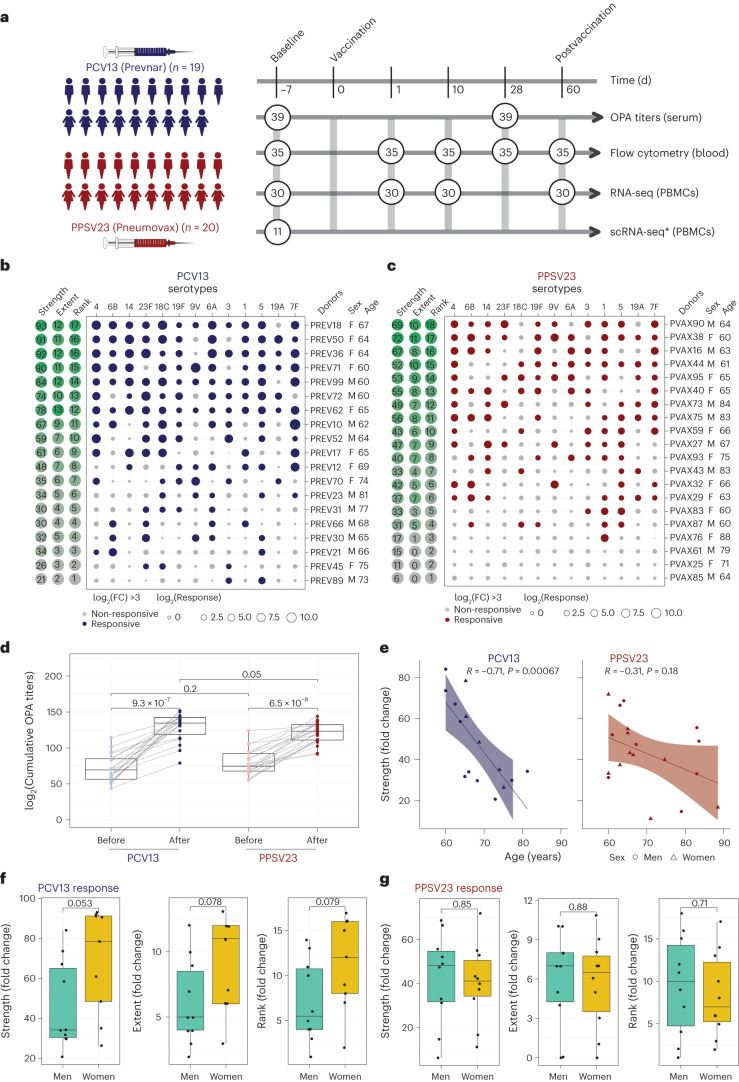
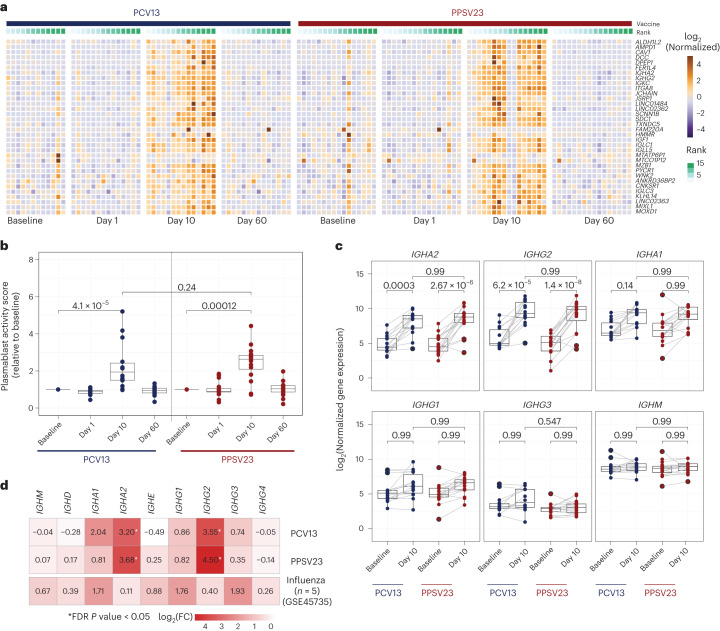
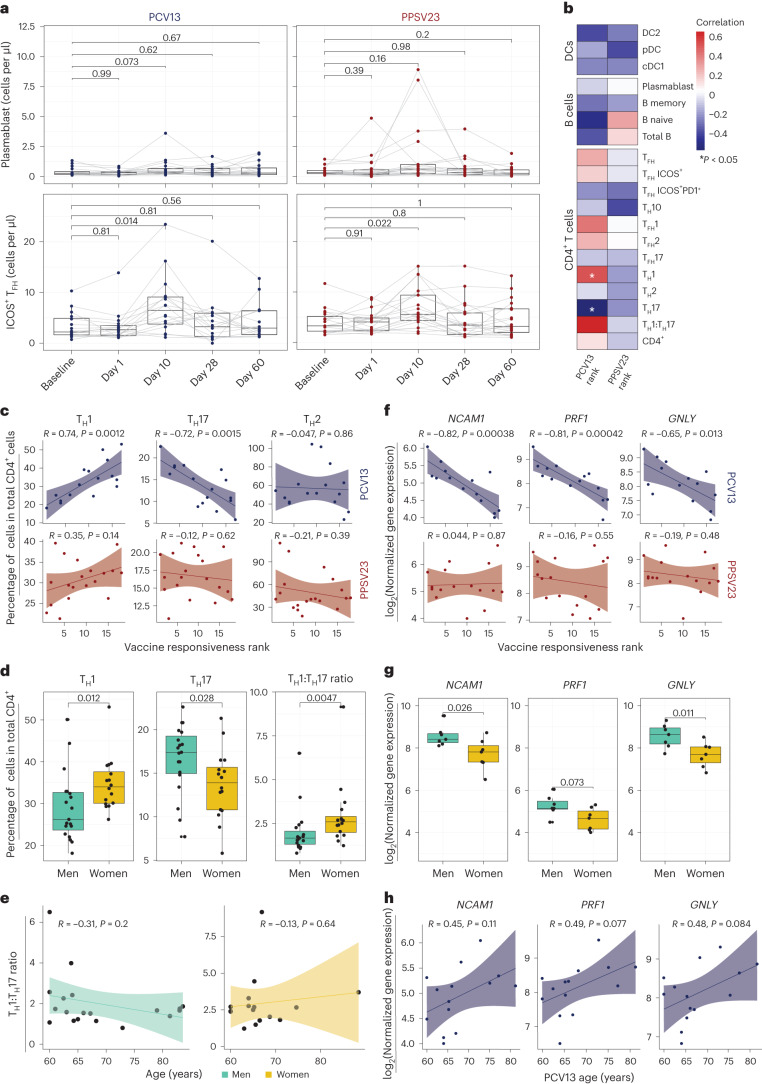
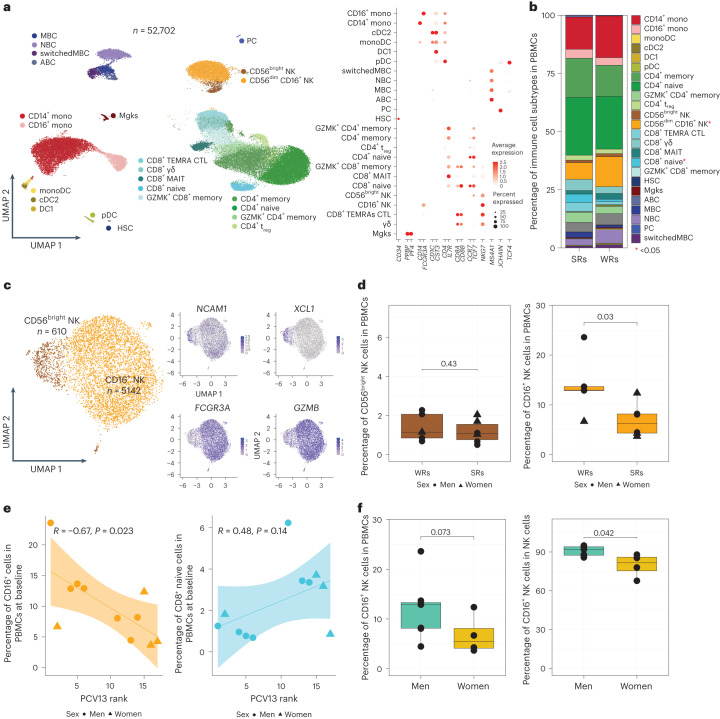
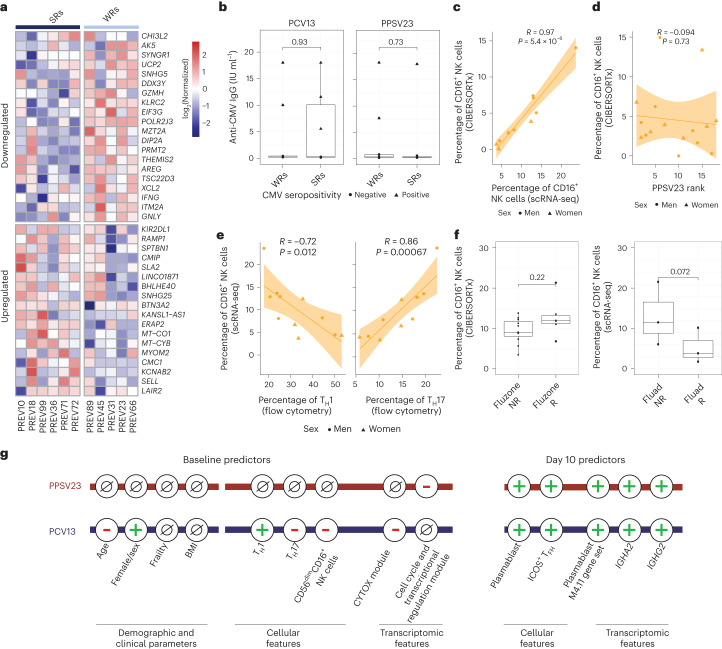
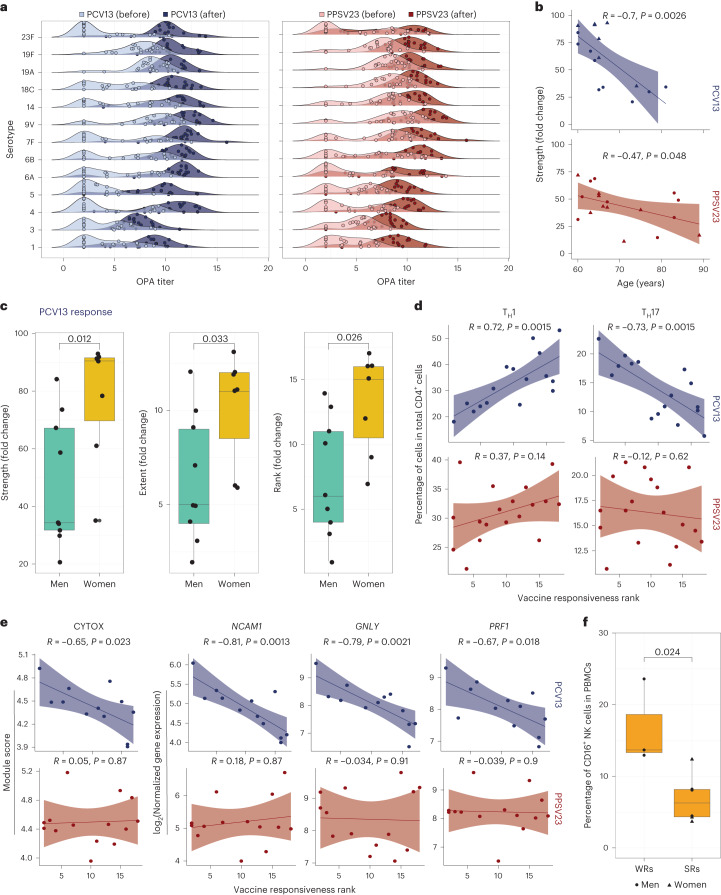
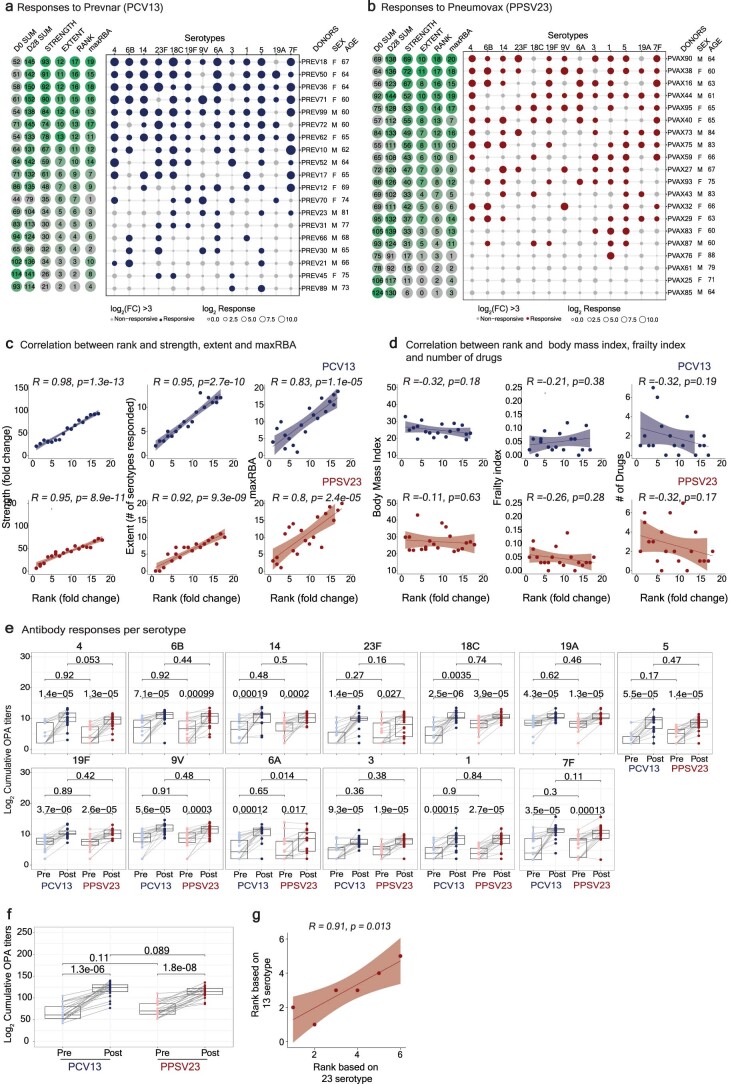
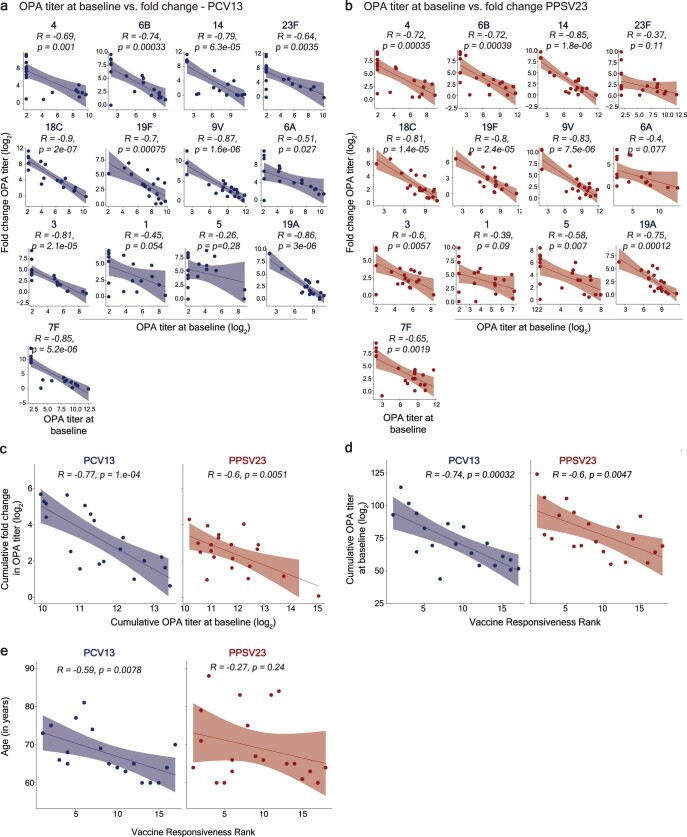
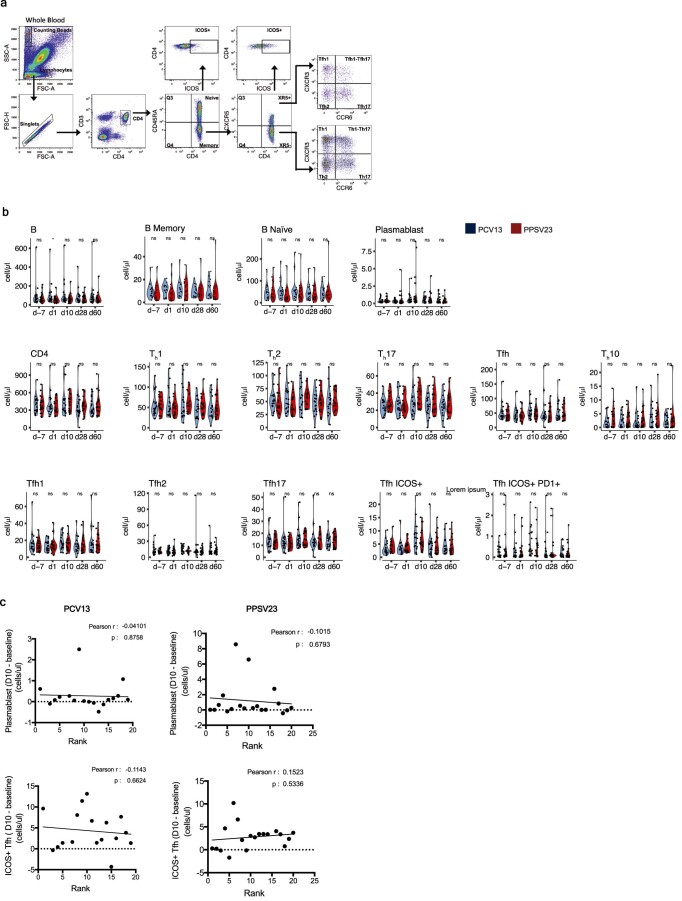
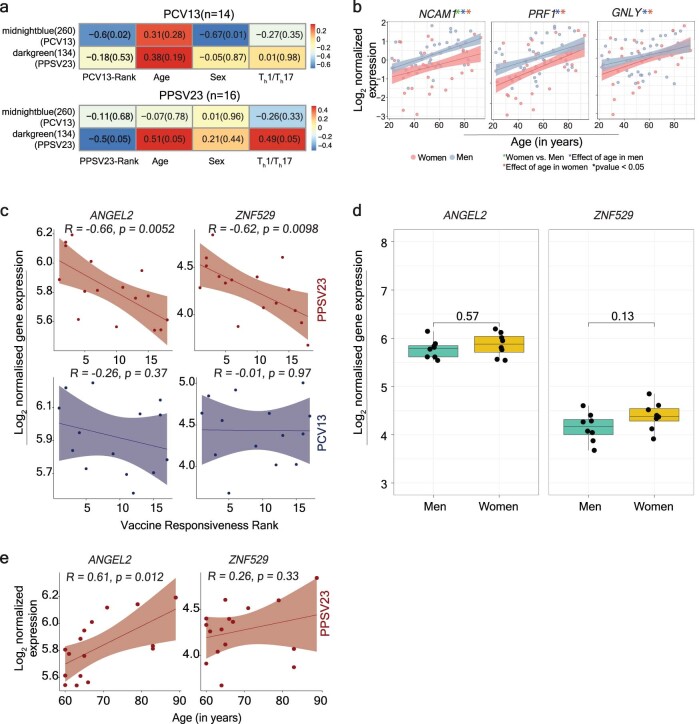
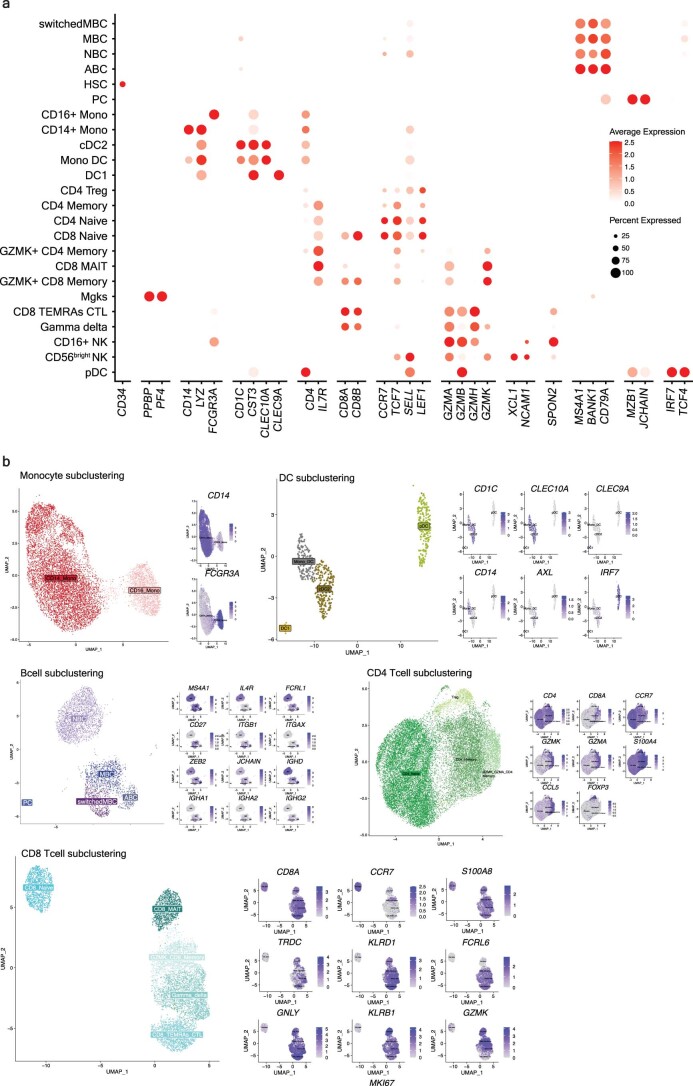
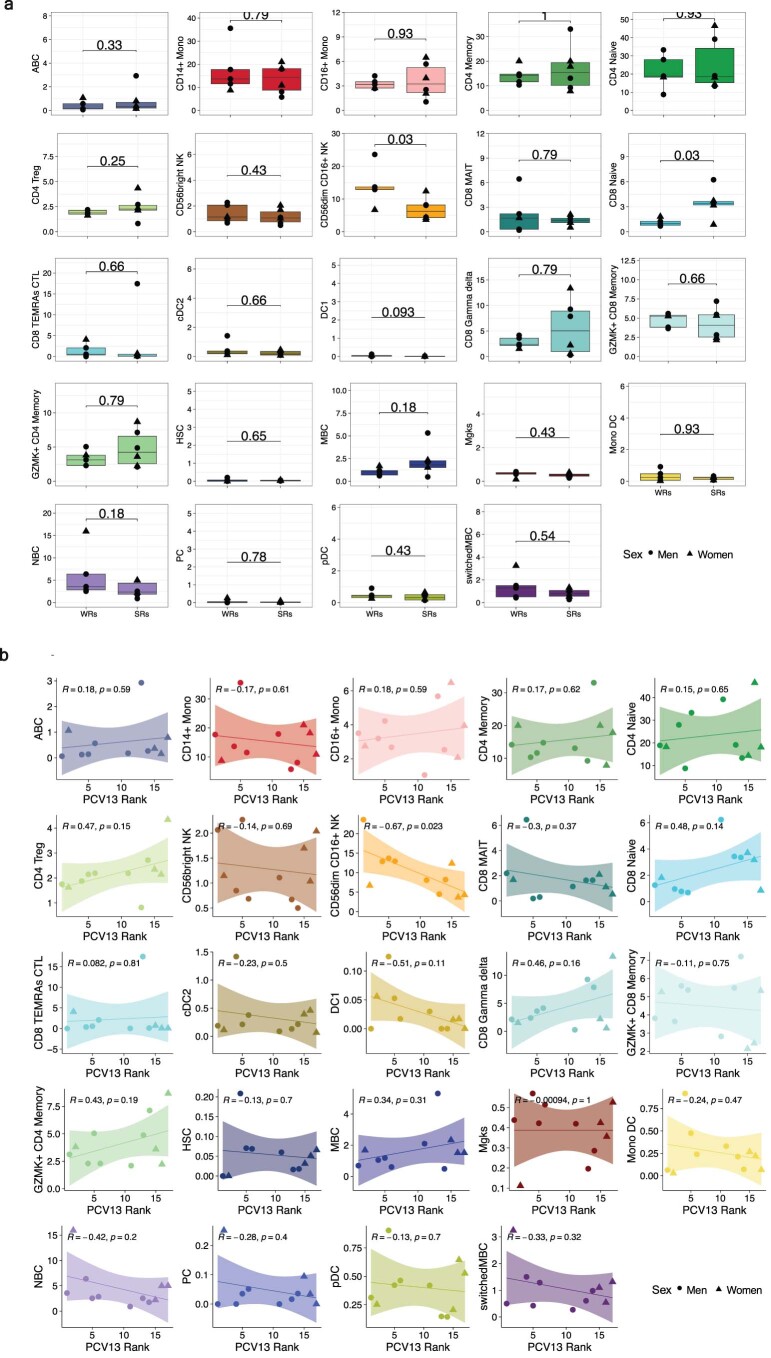
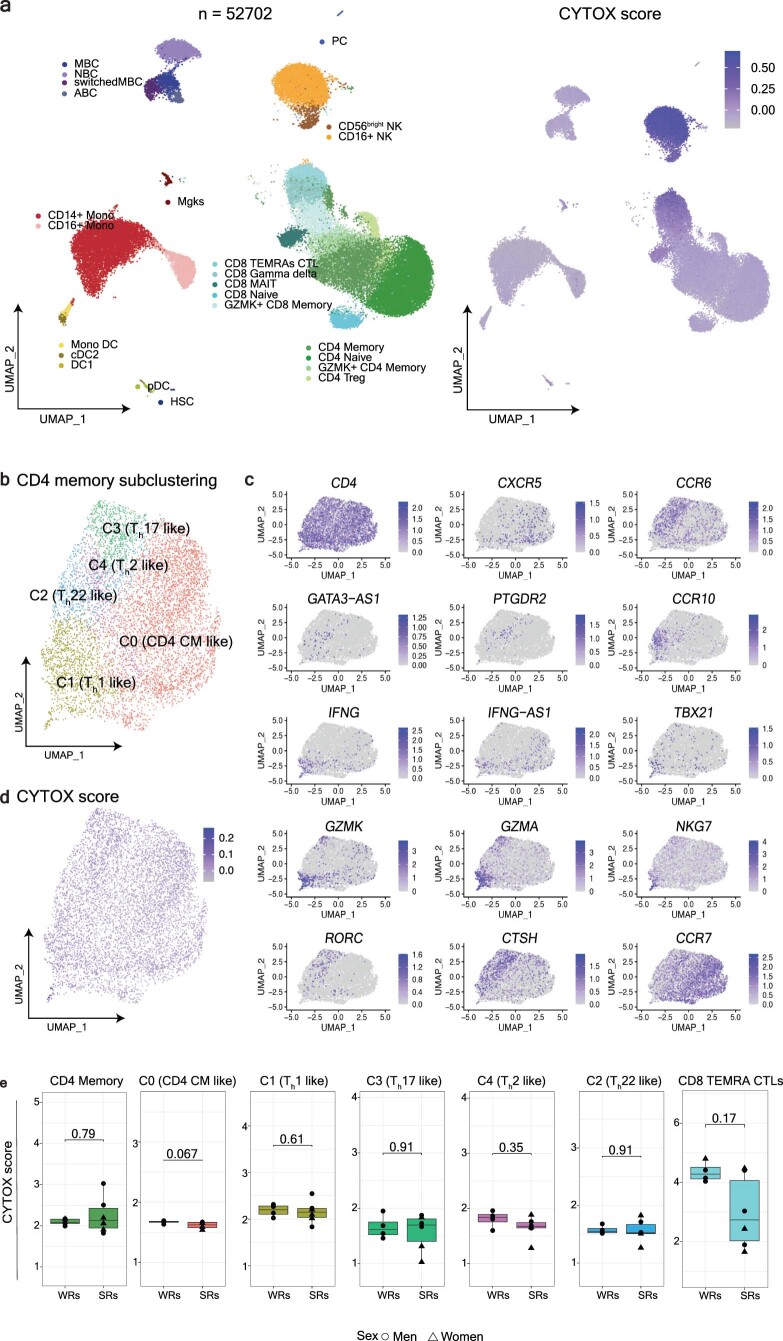
Pneumococcal infections cause serious illness and death among older adults. The capsular polysaccharide vaccine PPSV23 and conjugated alternative PCV13 can prevent these infections; yet, underlying immunological responses and baseline predictors remain unknown. We vaccinated 39 older adults (>60 years) with PPSV23 or PCV13 and observed comparable antibody responses (day 28) and plasmablast transcriptional responses (day 10); however, the baseline predictors were distinct. Analyses of baseline flow cytometry and bulk and single-cell RNA-sequencing data revealed a baseline phenotype specifically associated with weaker PCV13 responses, which was characterized by increased expression of cytotoxicity-associated genes, increased frequencies of CD16+ natural killer cells and interleukin-17-producing helper T cells and a decreased frequency of type 1 helper T cells. Men displayed this phenotype more robustly and mounted weaker PCV13 responses than women. Baseline expression levels of a distinct gene set predicted PPSV23 responses. This pneumococcal precision vaccinology study in older adults uncovered distinct baseline predictors that might transform vaccination strategies and initiate novel interventions.


Conflict of interest statement

While this study was performed, J.B. served on the Board of Directors for Neovacs, is a Board of Directors member and stockholder for Ascend Biopharmaceuticals, Scientific Advisory Board member for Cue Biopharma and stockholder for Sanofi. M.H.N. is an employee of the University of Alabama at Birmingham, which has intellectual property on the target bacteria used for the opsonophagocytosis assays. S.P. serves on the Scientific Advisory Board for Shoreline Biosciences and Qihan Biotechnology and is a Scientific Consultant for Qihan Biotechnology and the Genomics Institute of the Novartis Research Foundation. The other authors declare no competing interests.

Figures

Fig. 1
Fig. 1. Functional antibody response to PCV13 and PPSV23 in older adults.
a, Schematic representation of the study design. Nine women and ten men received the PCV13 vaccine, and ten women and ten men received PPSV23. OPA titers for the 13 serotypes were assessed from serum samples obtained 7 d before vaccination (baseline) and 28 d after vaccination for both vaccines. Anticoagulated blood samples were used for flow cytometric analysis of whole-blood cell populations. PBMCs were isolated for bulk RNA-seq. Prevaccination PBMCs from four women and seven men who received PCV13 were isolated for scRNA-seq. The numbers in circles represent the total numbers of biologically independent samples processed for the indicated assays at the indicated times. Figure created with BioRender.com. The star indicates scRNA-seq data generated exclusively for the PCV13 baseline samples. b, Bubble plot of fold change (FC) in antibody titers for individual serotypes in response to PCV13 (n = 19); M, male; F, female. c, Bubble plot of fold change in antibody titers for individual serotypes in response to PPSV23 (n = 20). Dot size represents the fold change value, and color indicates a significant response (log2(fold change) is >3), with blue for PCV13 and red for PPSV23. Donors are ordered from top to bottom according to the vaccine response rank. On the left, the strength (log2(sum fold change)), extent of response (number of serotypes out of 13 to which an individual mounted a significant response) and rank are presented. d, Prevaccination and postvaccination cumulative OPA titers (expressed as sum log2) in response to PCV13 (n = 19) and PPSV23 (n = 20). e, Correlation analysis between the cumulative fold change (sum log2(fold change)) and age (in years). f,g, Sex-specific differences in strength, extent and rank in donors who received PCV13 (n = 19; f) and PPSV23 (n = 20; g). A Wilcoxon matched-pairs signed-rank test (two sided) was used in d to compare titers before and after vaccination with PCV13 or PPSV23. Box plots display the median and interquartile range (IQR; 25–75%), with whiskers representing the upper and lower quartiles ±1.5× IQR. A Wilcoxon rank-sum test (two sided) was used to compare strength, extent and rank between men and women vaccinated with PCV13 and PPSV23. The Pearson correlation metric was used to perform correlation analyses between strength and age (e), and P values were computed using two-sided t-tests; n represents the number of biological replicates. Source data
Fig. 2
Fig. 2. Plasmablast response elicited after vaccination at day 10 in PBMCs.
a, Heat map of differentially expressed genes between day 10 and baseline assessed using normalized gene expression values. b, Box plot of plasmablast activity scores at baseline and days 1, 10 and 60 in response to PCV13 (n = 14) and PPSV23 (n = 16), calculated using a published gene set (M4.11) and scaled with reference to baseline. c, Box plots showing normalized expression of genes encoding the constant region of the immunoglobulin heavy chain structure in response to PCV13 (n = 14) and PPSV23 (n = 16). d, Heat map showing differential expression of genes encoding the constant region of the immunoglobulin heavy chain structure at day 10 in response to PCV13 (n = 14) and PPSV23 (n = 16) and at day 7 in response to Fluzone (GSE45735 (influenza vaccine); n = 5). Genes with a >1.5-fold difference and FDR-corrected P value of <0.05 are marked with an asterisk (*). A Wilcoxon rank-sum test (two sided) was used to compare plasma cell activity scores between baseline and days 1, 10 and 60 (b). Box plots display the median and IQR (25–75%), with whiskers representing the upper and lower quartiles ±1.5× IQR. A Wilcoxon matched-pairs signed-rank test (two sided) was used to compare the expression of immunoglobulin genes at baseline and day 10 for PCV13 and PPSV23. FDR-corrected P values are shown in c; n represents the number of biological replicates. Source data
Fig. 3
Fig. 3. Baseline TH1:TH17 cell ratio and cytotoxic gene expression are predictive of PCV13 vaccine responsiveness rank.
a, Longitudinal analysis of the absolute numbers of plasmablasts (cells per μl; top) and ICOS+ TFH cells (cells per μl; bottom) among the memory CD4+ T cell population in response to PCV13 (n = 16) and PPSV23 (n = 19). b, Correlation analysis between the absolute number of different cell types (DC, B cell and CD4+ T cell subsets) analyzed in whole blood and ranks. c, Correlation analysis between ranks and frequencies of TH1, TH17 and TH2 cells evaluated at baseline. d, Sex differences in the frequencies of TH1 and TH17 cells and TH1:TH17 cell ratio at baseline (n = 16 for PCV13; n = 19 for PPSV23). TH1 and TH17 cell frequencies were calculated relative to the total CD4+ T cell count. e, Association between TH1:TH17 cell ratio and age among men (green) and women (dark yellow) in response to PCV13 and PPSV23. f, Correlation analysis between baseline expression of cytotoxic genes (NCAM1, GNLY and PRF1) and PCV13 vaccine responsiveness rank (top; n = 14) and PPSV23 vaccine responsiveness rank (bottom; n = 16). g, Sex differences in the expression of NCAM1, PRF1 and GNLY at baseline (n = 14 for PCV13; n = 16 for PPSV23). h, Association between NCAM1, PRF1 and GNLY expression and age (n = 14 for PCV13; n = 16 for PPSV23). Box plots display the median and IQR (25–75%), with whiskers representing the upper and lower quartiles ±1.5× IQR. A Wilcoxon matched-pairs signed-rank test (two sided) was used to compare the absolute numbers of plasmablasts and ICOS+ TFH cells longitudinally (a). Correlation analyses were performed using the Pearson correlation metric (b, c, e, f and h), and P values were computed using two-sided t-tests; n represents the number of biological replicates. Source data
Fig. 4
Fig. 4. CD16+ NK cell frequency in PBMCs is negatively associated with PCV13 vaccine responses.
a, Uniform manifold approximation and projection (UMAP) of PBMCs from 11 PCV13 donors (six SRs and five WRs) showing 24 clusters from 52,702 cells colored by immune cell type. Immune subsets were identified in a supervised manner. Lineage markers are shown in the dot plot; MBC, memory B cell; NBC, naive B cell; ABC, age-associated B cell; mono, monocyte; monoDC, monocyte-derived DC; HSC, hematopoietic stem cell; Mgk, megakaryocyte; MAIT, mucosal-associated invariant T cell; GZMK, granzyme K; PC, plasma cells; CTL, cytotoxic T cell. b, Stacked bar plot of immune cell frequencies in SRs and WRs. The cell types with significant differences in their frequencies between SRs and WRs are marked with a red asterisk (*; P < 0.05). c, UMAP of NK cell subsets with feature plots showing the expression NCAM1, XCL1, FCGR3A and GZMB in blue, highlighting the two NK populations: CD56dimCD16+ NK cells and CD56bright NK cells. d, Box plots of CD16+ NK cell and CD56bright NK cell frequencies in SRs (n = 6) and WRs (n = 5). e, Correlation analysis between PCV13 rank and prevaccination frequencies of CD16+ NK and CD8+ naive T cells (n = 11). f, Sex differences in the prevaccination percentages of CD16+ NK cells in total PBMCs and in total NK cells (n = 11). Box plots display the median and IQR (25–75%), with whiskers representing the upper and lower quartiles ±1.5× IQR. A Wilcoxon rank-sum test (two sided) was used to compare cell percentages between SRs and WRs (b and d) and CD16+ NK cell percentages between men and women (f). Correlations were computed using the Pearson correlation metric (e), and P values were computed using two-sided t-tests; n represents the number of biological replicates. Source data
Fig. 5
Fig. 5. Increased cytotoxicity in CD16+ NK cells of PCV13 WRs.
a, Heat map of the differentially expressed genes in CD16+ NK cells of six PCV13 SRs and five WRs at baseline, as assessed using normalized expression values from the scRNA-seq pseudobulk analysis. b, Box plots comparing anti-CMV IgG titers between SRs and WRs for PCV13 (left) and PPSV23 (right). c, Correlation analysis of prevaccination CD16+ NK cell percentages estimated by scRNA-seq and CIBERSORTx (n = 11). d, Correlation analysis of CIBERSORTx-based estimates of CD16+ NK cells and PPSV23 rank (n = 16) at baseline. e, Correlation analysis of CD16+ NK cell percentages determined by scRNA-seq and TH1 and TH17 cell percentages determined using flow cytometry at baseline. f, Box plots of prevaccination CD16+ NK cell percentages in Fluad responders (R; n = 3) and non-responders (NR; n = 3) and Fluzone trivalent inactivated influenza vaccine responders (n = 5) and non-responders (n = 11). g, Summary schema showing the demographic, clinical, cellular and transcriptomic parameters associated with PCV13 and PPSV23 vaccine responsiveness at baseline and day 10. Box plots display the median and IQR (25–75%), with whiskers representing the upper and lower quartiles ±1.5× IQR. A Wilcoxon rank-sum test (two sided) was used to compare the mean anti-CMV IgG titers between SRs and WRs of PCV13 and PPSV13 donors (b) and prevaccination CD16+ NK cell percentages in Fluad responders and non-responders and Fluzone responders and non-responders (f). Correlation analyses were computed using the Pearson correlation metric (c, d and e), and P values were computed using two-sided t-tests; n represents the number of biological replicates. Source data
Fig. 6
Fig. 6. Association between demographic, cellular and transcriptomic parameters and vaccine responsiveness after the exclusion of non-informative donors.
a, Ridge plot displaying the distribution of before and after vaccination OPA titers for each serotype in the PCV13 (n = 19) and PPSV23 (n = 20) cohorts. Note that baseline titer levels vary among serotypes. Non-informative donors were identified using a published strategy, and associations were recalculated after exclusion of these donors. b, Association between PCV13 (n = 16) and PPSV23 (n = 18) strength and age (in years). c, Sex differences in PCV13 (n = 16) and PPSV23 (n = 18) vaccine responses. Note that women mount significantly stronger responses to the PCV13 vaccine. d, Association between TH1 and TH17 cell percentages at baseline and PCV13 (n = 15) and PPSV23 (n = 17) vaccine responsiveness. e, Correlations between CYTOX scores at baseline and PCV13 (n = 12) and PPSV23 (n = 14) vaccine responsiveness (left) and correlations between the baseline expression of NCAM1, GNLY and PRF1 and PCV13 and PPSV23 vaccine responsiveness (right). f, Baseline abundance of CD16+ NK cells in PCV13 SRs (n = 6) and WRs (n = 3). Correlation analyses were computed using the Pearson correlation metric (b and df), and P values were computed by using two-sided t-tests. Box plots display the median and IQR (25–75%), with whiskers representing the upper and lower quartiles ±1.5× IQR. A Wilcoxon rank-sum test (two sided) was used to compare strength, extent and rank between men and women treated with PCV13 and PPSV23 (c); n represents the number of biological replicates. Source data
Extended Data Fig. 1
Extended Data Fig. 1. Functional antibody response to PCV13 and PPSV23.
Bubble plot showing the fold change in the antibody titers for individual serotypes in response to PCV13 (n = 19) a) and PPSV23 (n = 20) b). The size of the dots represents the magnitude of the fold change (FC) value, and the color indicates significant response (Log2 FC is > 3): blue for PCV13 and red for PPSV23. Donors are ordered from top to bottom according to the vaccine response Rank. On the left side, D0 SUM (sum of pre-vaccination OPA titers to 13 serotypes), D35 SUM (sum of 28 days post-vaccination OPA titers to 13 serotypes), the Strength, the Extent, the Rank and the maxRBA rank (sum of baseline adjusted fold changes to 13 serotypes) for each donor is displayed. c) Correlation between the Rank and the Strength, the Extent, the maxRBA for PCV13 (n = 19; top panel) and PPSV23 (n = 20; bottom panel). d) Correlation between the Rank and body mass index (BMI), frailty index (FI) and number of concomitant drugs. e) OPA titers (Log2) for individual serotypes showing the connecting lines between Pre and post-vaccination. f) Pre-vaccination and post-vaccination cumulative OPA titers (expressed as sum Log2) excluding serotype 6A. g) Correlation of Rank determined from all 23 serotypes and a subset of 13 serotypes present in the PCV13 in an independent cohort. The Pearson correlation metric was used to perform correlation analysis (c, d, and g) and p-value was generated using two-sided t-test. Boxplots display the median and IQR (25–75%), with whiskers representing the upper- and lower-quartile ±1.5 × IQR. The Wilcoxon matched-pairs signed-rank test (two-sided) was used in to compare the difference in mean between pre- and post-vaccination OPA titers for 13 serotypes (e, f) in PCV13 and PPSV23. The ‘n’ represents number of biological replicates. Source data
Extended Data Fig. 2
Extended Data Fig. 2. Baseline OPA titers inversely correlate with fold change in OPA titers and vaccine responsiveness ranks.
Correlation between baseline OPA titers and their post-vaccination fold change for individual serotypes for PCV13 (n = 19) a) and PPSV23 (n = 20) b). c) Association between cumulative baseline OPA titer and fold change for both PCV13 (n = 19) and PPSV23 (n = 20). Both baseline and fold change in OPA titers are expressed on a log2 scale (a, b, c). d) Correlation between cumulative baseline OPA titer and vaccine responsiveness rank for both vaccines. e) Correlation between Rank and age (in years) for PCV13 and PPSV23. The Pearson correlation metric was used to perform correlation analysis and p-value was generated using two-sided t-test. The ‘n’ represents number of biological replicates. Source data
Extended Data Fig. 3
Extended Data Fig. 3. Differential transcriptional changes in response to PCV13 and PPSV23 at day 10.
a) Heatmap showing differentially expressed genes between Day 10 and baseline, using the normalized gene expression. Differentially expressed genes that are common for both vaccines or show differential expression only in PCV13 or PPSV23 are grouped separately. b) Boxplots of the normalized expression of genes coding for the constant region of immunoglobulin heavy chain structure. c) Heatmap of differential expressed genes coding for the constant region of immunoglobulin heavy chain structure at Day 10 in response to PCV13 and PPSV23. Genes with a FC >1.5-fold difference and a FDR p-value <0.05 are marked with stars. d) Correlation analysis between the fold difference in immunoglobulin genes (gene expression at Day 10 - baseline) and the extent of the response (% of serotypes out of 13) for PCV13. e) Correlation analysis between the fold difference in immunoglobulin genes (gene expression at Day 10 - baseline) and the extent of the response (% of serotypes out of 13) for PPV23. f) Correlation between the plasmablasts activity scores (Day 10 vs. baseline) and vaccine responsiveness Rank. The Pearson correlation metric was used to perform correlation analysis (a, c, and d). The Wilcoxon matched-pairs signed-rank test (two-sided) was used to compare the expression of immunoglobulin genes at baseline and Day 10 for PCV13 and PPSV23 (c). The ‘n’ represents number of biological replicates. Source data
Extended Data Fig. 4
Extended Data Fig. 4. No association between changes in plasmablasts and ICOS+ Tfh cells at Day 10 and responses to both vaccines.
a) Representative plots showing the gating strategy for the characterization by flow cytometry of the different memory CD4+ T cell populations. b) Comparative analysis of the absolute number of the different cell types between PCV13 (n = 16) and PPSV23 (n = 19) cohorts over time. c) Correlation between fold difference in plasmablasts cell numbers (d10 - baseline) and vaccine responsiveness Rank (top panel). Correlation between fold difference in ICOS+ Tfh cell numbers (d10 - baseline) and vaccine responsiveness Rank (bottom panel). The Wilcoxon Rank sum test was used to compare the absolute numbers of different cell types: * (p < 0.05), ** (p < 0.01), ***(p < 0.001), **** (p < 0.0001) (b). The Pearson correlation metric was used to perform correlation analysis (a, b, and c), and the p-value was computed using two-sided t test (c). The ‘n’ represents number of biological replicates. Source data
Extended Data Fig. 5
Extended Data Fig. 5. Higher Th1/Th17 ratio mount stronger responses to PCV13.
a) Correlation analysis between PCV13 Rank and the absolute numbers (cells/ul) of the different cell populations at baseline (d-7) (n = 16). b) Correlation analysis between PPSV23 Rank and the absolute numbers (cells/ul) of the different cell populations at baseline (d-7) (n = 19). c) Correlation analysis of Th1/Th17 ratio and vaccine responsiveness Ranks of PCV13 (n = 16) and PPSV23 (n = 19), respectively. The Pearson correlation metric was used to perform correlation analysis (a, b, and c), and the p-value was computed using two-sided t test. The ‘n’ represents number of biological replicates. Source data
Extended Data Fig. 6
Extended Data Fig. 6. Baseline expression of ‘darkgreen module’ genes negatively associated with PPSV23 responses.
a) Heatmap showing the modules correlated with PCV13 Rank, PPSV23 Rank, sex, age and Th1/Th17 ratio. b) Correlation between the expression of cytotoxic genes and age (in years) in an independent dataset. c) Correlation analysis between top correlates of darkgreen module (ANGEL2, and ZNF529) and PPSV23 Rank (n = 16). Correlation analysis between top correlates of darkgreen module (ANGEL2, and ZNF529) and PCV13 Rank (n = 14). d) Boxplot showing the expression of top correlates of darkgreen module (ANGEL2, and ZNF529) in men and women (n = 16). e) Association between ANGEL2, and ZNF529 expression with age (in years). Boxplots display the median and IQR (25–75%), with whiskers representing the upper- and lower-quartile ±1.5× IQR. The Wilcoxon Rank sum test (two-sided) was used to compare the expression of genes in men and women (e). Correlation analysis was performed using the Pearson correlation metric (b,c,e), and the p-value was computed using two-sided t test. The ‘n’ represents number of biological replicates. Source data
Extended Data Fig. 7
Extended Data Fig. 7. Subclustering of baseline PBMC RNA-Seq at the single-cell level.
a) Dot plot showing the marker gene expression for each subset detected in the PBMC scRNA-seq data. b) Single cell subclustering of Monocytes, DCs, B, CD4 and CD8 T cells. Feature plots showing the known markers in blue.
Extended Data Fig. 8
Extended Data Fig. 8. Differential immune cell frequencies between PCV13 SRs and WRs.
a) Stacked bar plot showing immune cell compositions in strong responders (SRs, n = 6) and weak responders (WRs, n = 5). Cell types showing significant difference between SRs and WRs are marked with a star (pvalue < 0.05 starred in red). Boxplot showing the frequency of different immune cell subsets in SRs and WRs. b) Correlation analysis between PCV13 rank and the frequency of different immune cell subsets. Boxplots display the median and IQR (25–75%), with whiskers representing the upper- and lower-quartile ±1.5× IQR. The Wilcoxon Rank sum test (two-sided) was used to compare the cell percentages between PCV13- SRs and WRs. Correlation analysis was performed using the Pearson correlation metric and p-value was computed using two-tailed t-test. The ‘n’ represents number of biological replicates. Source data
Extended Data Fig. 9
Extended Data Fig. 9. The CYTOX Signature stems from CD16+ NK Cells.
a) UMAP representation of PBMCs derived from 11 PCV13 donors, consisting of 6 strong responders (SRs) and 5 weak responders (WRs). This visualization encompasses 24 clusters from a total of 52,702 cells, each color-coded by their respective immune cell type. An accompanying feature plot elucidates the distribution of the CYTOX score across these 24 distinct immune cell populations. The CYTOX score is derived from the expression of genes from module associated with PCV13 response (midnightblue module), showing a Pearson correlation coefficient greater than 0.5. b) Subclustering of CD4+ memory cells highlight subsets expressing marker genes for C0 (central memory like cells), C1 (Th1 like), C2 (Th22 like), C3(Th17 like) and C4 (Th2 like). c) A feature plot to show marker gene expression for memory CD4+ subsets. d) A feature plot showing CYTOX score for memory CD4+ T cells. e) Comparison of CYTOX scores for 6 SRs and 5 WRs for each memory CD4+ subset and CD8+ TEMRA CTLs. Boxplots display the median and IQR (25–75%), with whiskers representing the upper- and lower-quartile ±1.5× IQR. The Wilcoxon Rank sum test (two-sided) was employed to assess differences in the CYTOX scores between the PCV13 SRs and WRs across these CD4 memory subsets and CD8+ TEMRA CTLs. The ‘n’ represents number of biological replicates. Source data
Extended Data Fig. 10
Extended Data Fig. 10. Association between baseline CD16+ NK frequency estimated from CIBERSORTx and PCV13 vaccine responses.
a) Correlation between pre-vaccination cell frequency estimated by scRNA-seq and CIBERSORTx for different immune subtypes. b) Correlation analysis of CD16+ NK frequency at baseline and vaccine responsiveness Ranks of PCV13 (n = 14) and PPSV23 (n = 16), respectively. For the correlation analysis with PPSV23-Rank, cell frequency estimated by CIBERSORTx from the bulk PPSV23 baseline transcriptomes (n = 16) was considered. c) Correlation analysis of CD56bright NK frequency (n = 11) and Th1, and Th17 frequency at baseline. Pearson correlation was used to perform correlation analysis (a,b,c) and p-value was computed using two-tailed t-test. d) UMAP representation of CD16+ NK subsets in fluad responders (n = 3) and non-responders (n = 3) at baseline. Feature plots showing NCAM1, XCL1, FCG3RA and SPON2 in CD16+ NK cells in blue. Correlation analysis was performed using the Pearson correlation metric and p-value was computed using two-tailed t-test. The ‘n’ represents number of biological replicates. Source data

Update of

Similar articles

Cited by

References

    1. Huang SS, et al. Healthcare utilization and cost of pneumococcal disease in the United States. Vaccine. 2011;29:3398–3412. doi: 10.1016/j.vaccine.2011.02.088. - DOI - PubMed
    1. Daniels CC, Rogers PD, Shelton CM. A review of pneumococcal vaccines: current polysaccharide vaccine recommendations and future protein antigens. J. Pediatr. Pharmacol. Ther. 2016;21:27–35. - PMC - PubMed
    1. Weller S, et al. Human blood IgM ‘memory’ B cells are circulating splenic marginal zone B cells harboring a prediversified immunoglobulin repertoire. Blood. 2004;104:3647–3654. doi: 10.1182/blood-2004-01-0346. - DOI - PMC - PubMed
    1. Weller S, et al. T-independent responses to polysaccharides in humans mobilize marginal zone B cells prediversified against gut bacterial antigens. Sci. Immunol. 2023;8:eade1413. doi: 10.1126/sciimmunol.ade1413. - DOI - PMC - PubMed
    1. Douglas RM, Paton JC, Duncan SJ, Hansman DJ. Antibody response to pneumococcal vaccination in children younger than five years of age. J. Infect. Dis. 1983;148:131–137. doi: 10.1093/infdis/148.1.131. - DOI - PubMed