. 2024 Feb;27(2):319-327.
doi: 10.1038/s41593-023-01513-2. Epub 2024 Jan 5.

Women's neuroplasticity during gestation, childbirth and postpartum

Affiliations

Women's neuroplasticity during gestation, childbirth and postpartum

María Paternina-Die et al. Nat Neurosci. 2024 Feb.

Abstract

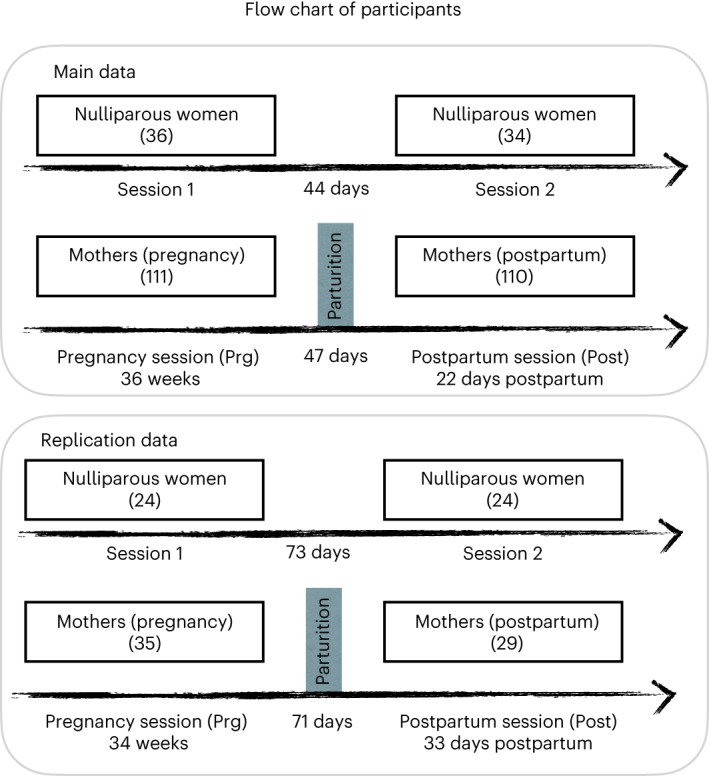
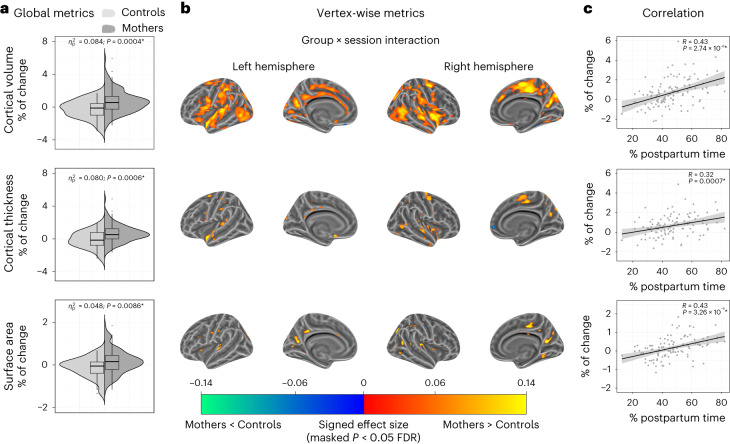
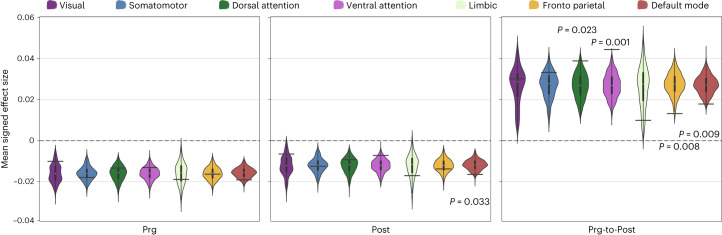
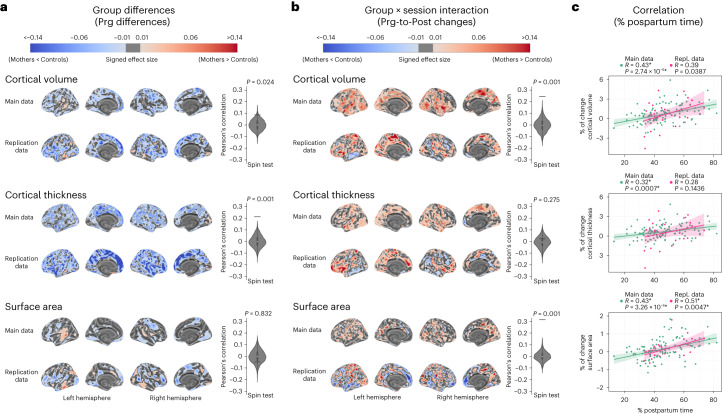
Pregnancy is a unique neuroplastic period in adult life. This longitudinal study tracked brain cortical changes during the peripartum period and explored how the type of childbirth affects these changes. We collected neuroanatomic, obstetric and neuropsychological data from 110 first-time mothers during late pregnancy and early postpartum, as well as from 34 nulliparous women evaluated at similar time points. During late pregnancy, mothers showed lower cortical volume than controls across all functional networks. These cortical differences attenuated in the early postpartum session. Default mode and frontoparietal networks showed below-expected volume increases during peripartum, suggesting that their reductions may persist longer. Results also pointed to different cortical trajectories in mothers who delivered by scheduled C-section. The main findings were replicated in an independent sample of 29 mothers and 24 nulliparous women. These data suggest a dynamic trajectory of cortical decreases during pregnancy that attenuates in the postpartum period, at a different rate depending on the brain network and childbirth type.


Conflict of interest statement

The authors declare no competing interests.

Figures

Fig. 1
Fig. 1. Diagram of participants.
Number of mothers and nulliparous women participating in the first session during late pregnancy (Prg) and the second session during the early postpartum period (Post) and the drop-out between these sessions. In the main and replication datasets, three and six women were excluded because of loss of interest, respectively. Only participants who completed both Prg and Post sessions were included in the analyses.
Fig. 2
Fig. 2. Group differences in cortical volume, thickness and surface area in mothers compared to nulliparous women at late pregnancy and early postpartum sessions.
Group fixed effects at each session were studied through the adjusted linear mixed effect model: CorticalMetric~1+Group+Session+Group×Session+1Participant. a, Violin and embedded boxplots showing the distribution of the global cortical metrics at late pregnancy (Prg) and early postpartum (Post) sessions in mothers (n = 110) and controls (nulliparous women; n = 34). Effect sizes of the group differences in Prg and Post sessions were calculated as the signed partial eta squared (ηp2) associated with the corresponding one-tailed Wald F-tests. Asterisks indicate those differences surviving a P < 0.05 false discovery rate (FDR) correction. Exact P values are reported in Supplementary Table 2. The center line of the boxplot represents the median, the box encloses the lower and upper quartiles and the whiskers extend to the minimum and maximum values within a range of 1.5 times the interquartile range. Of note, the high inter-subject variability in surface area might have reduced the statistical power to detect group differences. b, Vertex-wise binary maps of the significant cortical differences between groups, specifically lower values in mothers compared to controls (FDR-corrected P < 0.05). Yellow, orange and blue indicate lower cortical values during Prg and Post sessions and the overlap between both sessions. Binary maps were projected to the inflated fsaverage template provided by the FreeSurfer software.
Fig. 3
Fig. 3. Longitudinal changes in cortical volume, thickness and surface area from late pregnancy to early postpartum in mothers compared to nulliparous women.
Longitudinal changes were derived from the group × session interaction fixed effect term of the adjusted linear mixed effect model: CorticalMetric~1+Group+Session+Group×Session+1Participant. a, Violin and embedded boxplots showing the distribution of the percentage of change of the global metrics in mothers (n = 110) and controls (nulliparous women; n = 34). Effect sizes were calculated as the signed partial eta squared (ηp2) associated with the corresponding one-tailed Wald F-tests. Asterisks indicate those changes surviving a P < 0.05 false discovery rate (FDR) correction. The center line of the boxplot represents the median, the box encloses the lower and upper quartiles and the whiskers extend to the minimum and maximum values within a range of 1.5 times the interquartile range. b, Vertex-wise signed effect size maps (ηp2) of the group × session interaction (FDR-corrected P < 0.05), indicating larger decreases (blue) and larger increases (red) in mothers than in controls. Signed effect size maps were projected to the inflated fsaverage template provided by the FreeSurfer software. c, Correlations between the global percentages of change in cortical metrics and the percentage of postpartum time between sessions. The black line and the shaded area represent the least squares regression line and the 95% confidence intervals, respectively. Asterisks indicate two-tailed Pearson’s correlation coefficients (R) surviving an FDR-corrected P < 0.05. Uncorrected P values (P) below the threshold of 0.0001 are reported in exponential notation.
Fig. 4
Fig. 4. Spin testing for the mean signed effect sizes of the vertex-wise group differences in cortical volume.
Group differences between mothers (n = 110) and nulliparous women (controls; n = 34) in cortical volume within the seven large-scale functional brain networks. Black horizontal bars represent the observed values and the violin plots reflect the null distributions obtained using 1,000 spin-permutations of the maps. The exact one-tailed P values are reported when P < 0.05. No multiple comparison corrections were applied. The white dot on the center of the boxplot represents the median, the box encloses the lower and upper quartiles and the whiskers extend to the minimum and maximum values within a range of 1.5 times the interquartile range. Prg-to-Post, from pregnancy to postpartum sessions.
Fig. 5
Fig. 5. Comparison between the main and replication datasets.
Main dataset comprised 110 mothers and 34 nulliparous women (controls); replication dataset comprised 29 mothers and 24 controls. a, Vertex-wise signed effect size maps of the cortical group differences indicating lower (blue) and higher (red) values in mothers compared to controls at late pregnancy (Prg). b, Vertex-wise signed effect size maps of the cortical longitudinal changes indicating larger decreases (blue) and larger increases (red) in mothers compared to controls. For a and b, signed effect size (ηp2) maps (collapsed to ±0.14) of the one-tailed Wald F-tests were projected to the inflated fsaverage template provided by the FreeSurfer software. Black outlines on brain surfaces enclose results surviving a false discovery rate (FDR)-corrected P < 0.05. Plots to the right of the maps test the spatial correspondence between the main and replication maps by means of one-tailed spin tests using Pearson’s correlation. Black horizontal bars represent the observed values and the violin plots reflect the null distributions obtained using 1,000 spin-permutations of the maps. The white dot on the center of the boxplot represents the median, the box encloses the lower and upper quartiles and the whiskers extend to the minimum and maximum values within a range of 1.5 times the interquartile range. c, Correlations between the global percentages of change in cortical metrics and the percentage of postpartum time between sessions in the main (green) and replication (pink) datasets. Colored lines and the shaded areas represent the least squares regression lines and the 95% confidence intervals. Asterisks indicate two-tailed Pearson’s correlation coefficients (R) surviving an FDR-corrected P < 0.05. Uncorrected P values (P) below the threshold of 0.0001 are reported in exponential notation. Prg-to-Post, from pregnancy to postpartum sessions; Repl., replication.
Fig. 6
Fig. 6. Correlation matrix of the neuropsychological variables in the mothers’ group (n = 110).
The diagonal shows the distribution of the variables; the lower diagonal shows the scatterplots with the least square regression lines and the 95% confidence intervals, and the upper diagonal shows the Pearson coefficients (R) and associated uncorrected P values. Blue and red cells represent negative and positive correlations, respectively. Asterisks indicate Pearson coefficients surviving a two-tailed P < 0.05 FDR correction. P values below the threshold of 0.0001 are reported in exponential notation. From left to right, the neuropsychological variables correspond to the following questionnaires: Maternal Attachment Scale, Edinburgh Depression Scale, PSQI, PSS, Pregnancy Anxiety Scale, Maternal Stress Scale and Birth Experience Questionnaire.
Fig. 7
Fig. 7. Longitudinal changes in cortical metrics in mothers who initiated labor and mothers who underwent a scheduled C-section.
a, Violin and embedded boxplots showing the distribution of the global percentages of change in cortical volume, thickness and surface area. Longitudinal changes were derived from the group × session interaction fixed effect term of the adjusted linear mixed effect model: CorticalMetric~1+Group+Session+Group×Session+1Participant. Signed effect sizes were calculated as partial eta squared (ηp2) associated with the corresponding one-tailed Wald F-tests. Asterisks indicate results surviving a P < 0.05 false discovery rate (FDR) correction. Nulliparous women (control; n = 34) are displayed as a reference to mothers who initiated labor (n = 99) and mothers who underwent scheduled C-sections (pre-labor; n = 11). The center line of the boxplot represents the median, the box encloses the lower and upper quartiles and the whiskers extend to the minimum and maximum values within a range of 1.5 times the interquartile range. b, Correlations between the global percentages of change in cortical metrics and the percentage of postpartum time between sessions in mothers undergoing labor (orange) and pre-labor (purple). Colored lines and shaded areas represent the least squares regression lines and the 95% confidence intervals, respectively. Asterisks indicate two-tailed Pearson’s correlation coefficients (R) surviving a P < 0.05 FDR correction. For a and b, uncorrected P values (P) below the threshold of 0.0001 are reported in exponential notation.

References

    1. Thornburg, K. L., Bagby, S. P. & Giraud, G. D. in Knobil and Neill’s Physiology of Reproduction Vol. 2 (eds. Plant, T. M. & Zeleznik, A. J.) 1927–1955 (Elsevier, 2015).
    1. Pawluski JL, Hoekzema E, Leuner B, Lonstein JS. Less can be more: fine tuning the maternal brain. Neurosci. Biobehav. Rev. 2022;133:104475. - PMC - PubMed
    1. Hillerer KM, Jacobs VR, Fischer T, Aigner L. The maternal brain: an organ with peripartal plasticity. Neural Plasticity. 2014;2014:574159. - PMC - PubMed
    1. Feldman R. The adaptive human parental brain: implications for children’s social development. Trends Neurosci. 2015;38:387–399. - PubMed
    1. Barba-Müller E, Craddock S, Carmona S, Hoekzema E. Brain plasticity in pregnancy and the postpartum period: links to maternal caregiving and mental health. Arch. Womens Mental Health. 2019;22:289–299. - PMC - PubMed