. 2024 Mar;31(3):498-512.
doi: 10.1038/s41594-023-01181-7. Epub 2024 Jan 5.

The potential of epigenetic therapy to target the 3D epigenome in endocrine-resistant breast cancer

Affiliations

The potential of epigenetic therapy to target the 3D epigenome in endocrine-resistant breast cancer

Joanna Achinger-Kawecka et al. Nat Struct Mol Biol. 2024 Mar.

Abstract

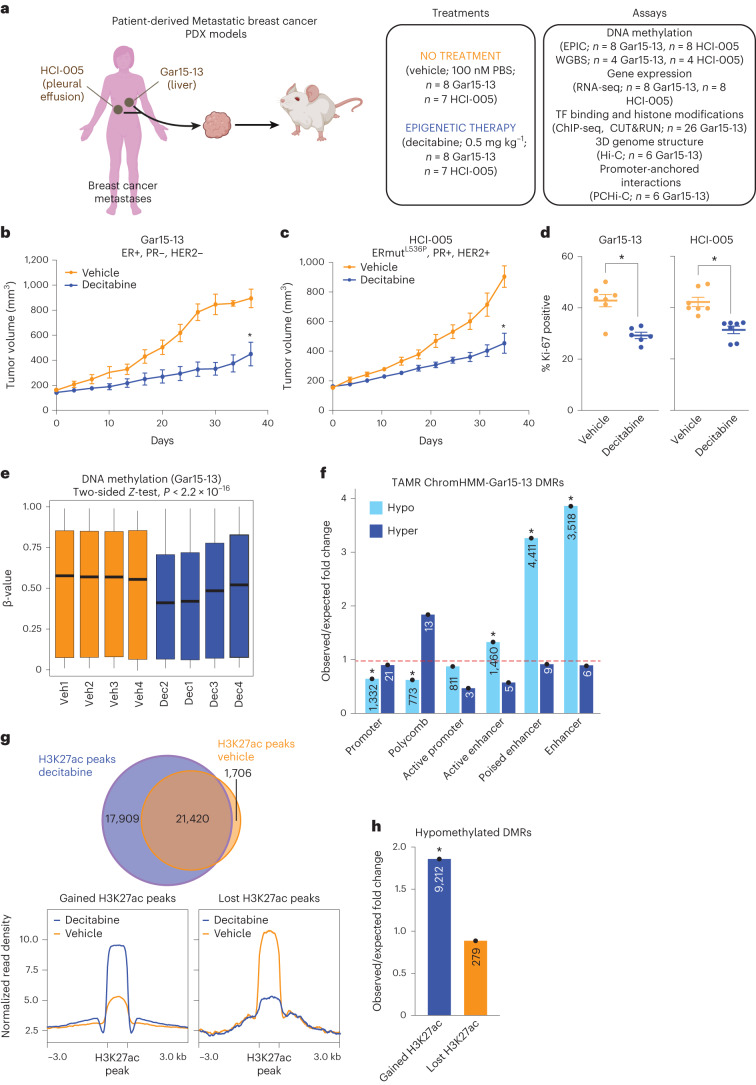
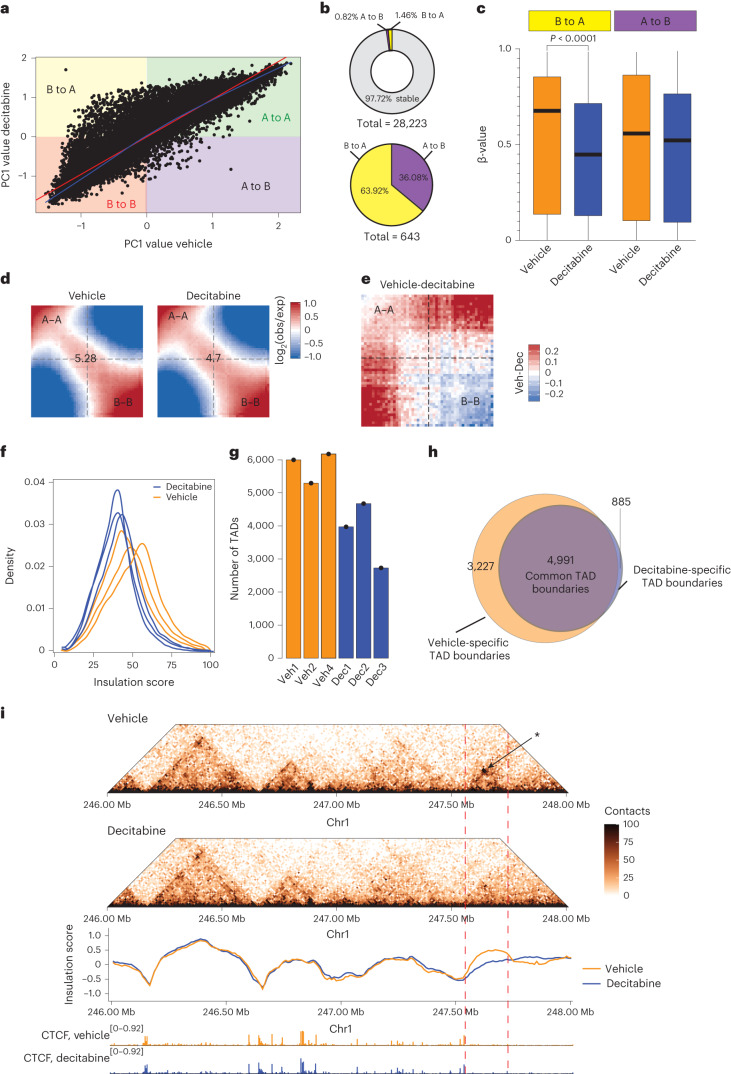
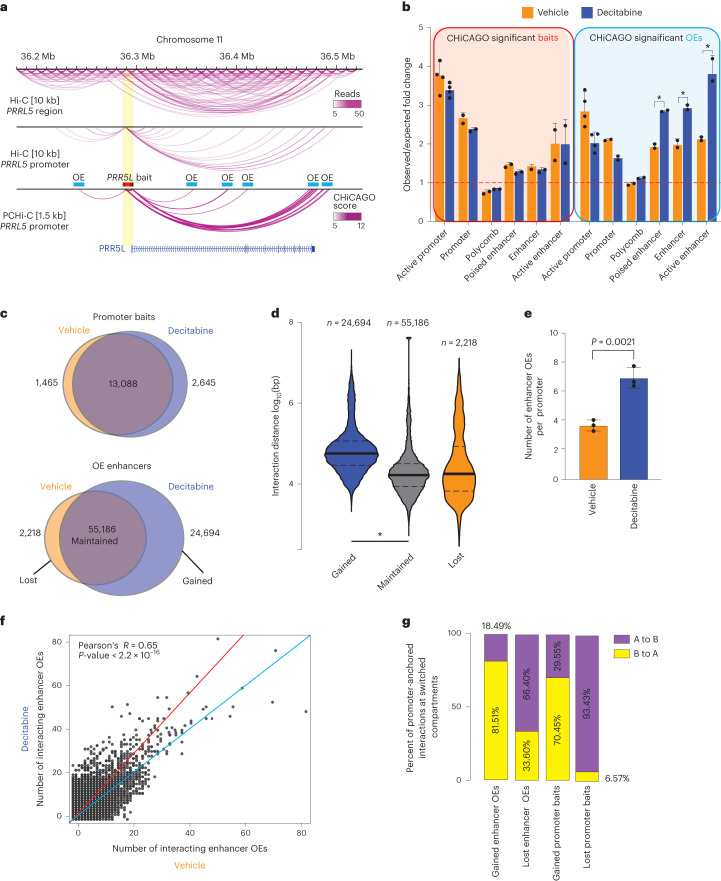
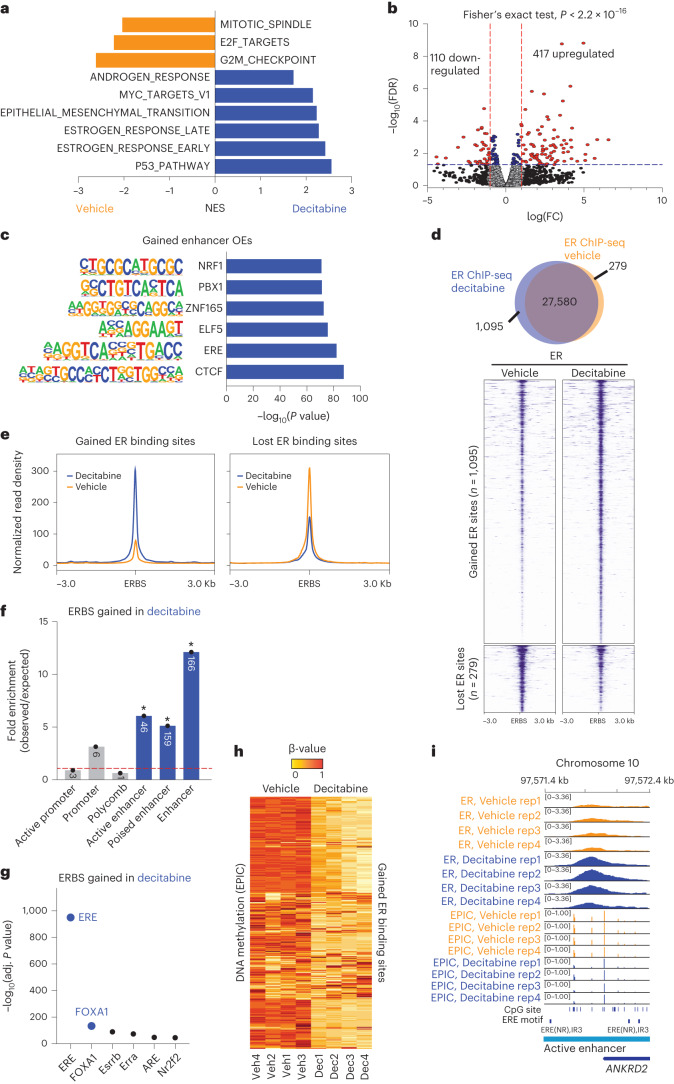
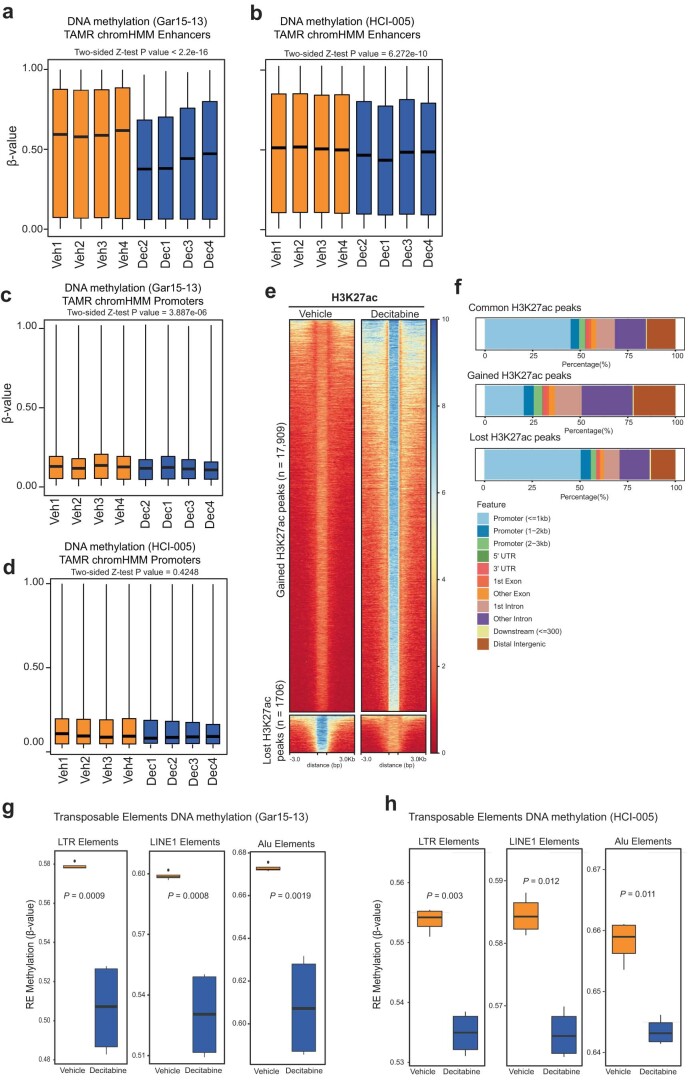
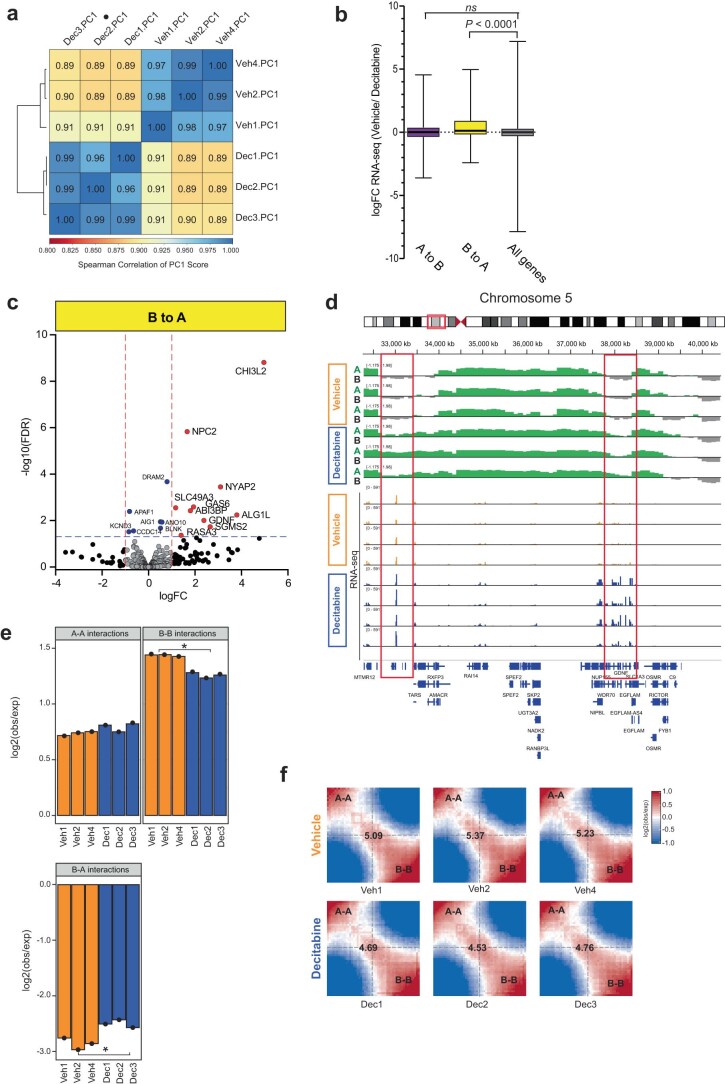
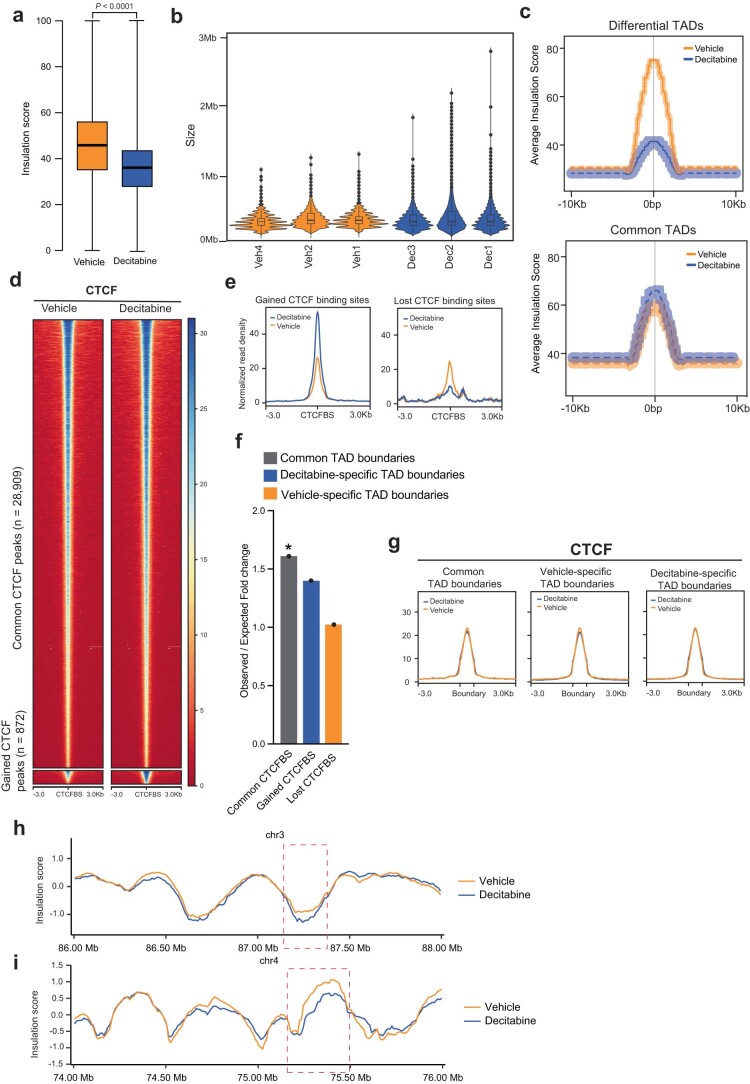
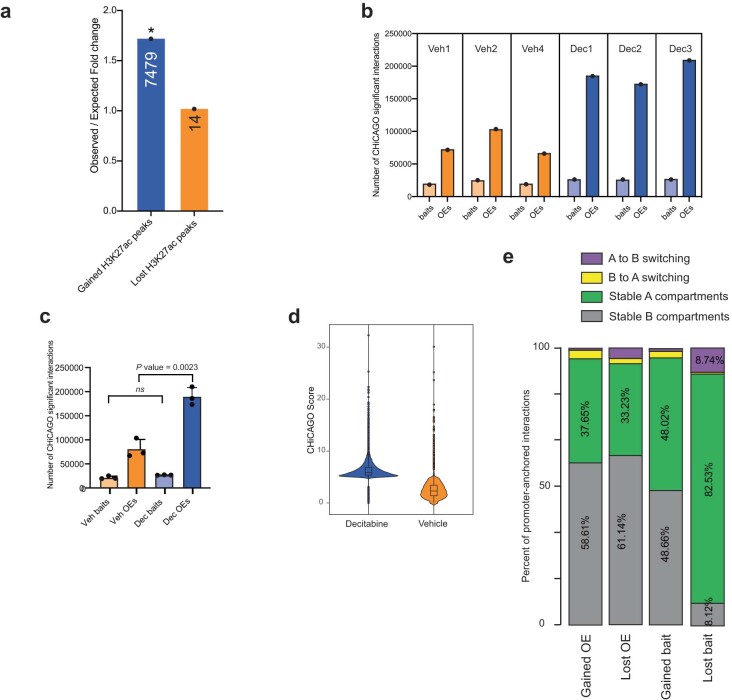
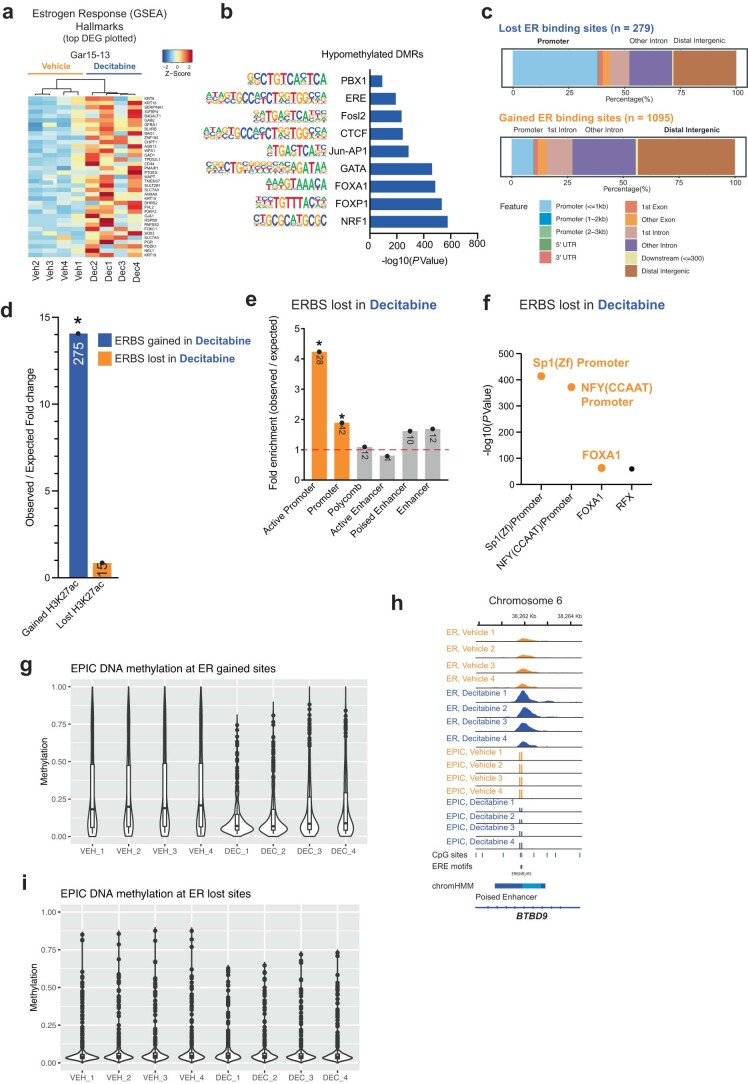
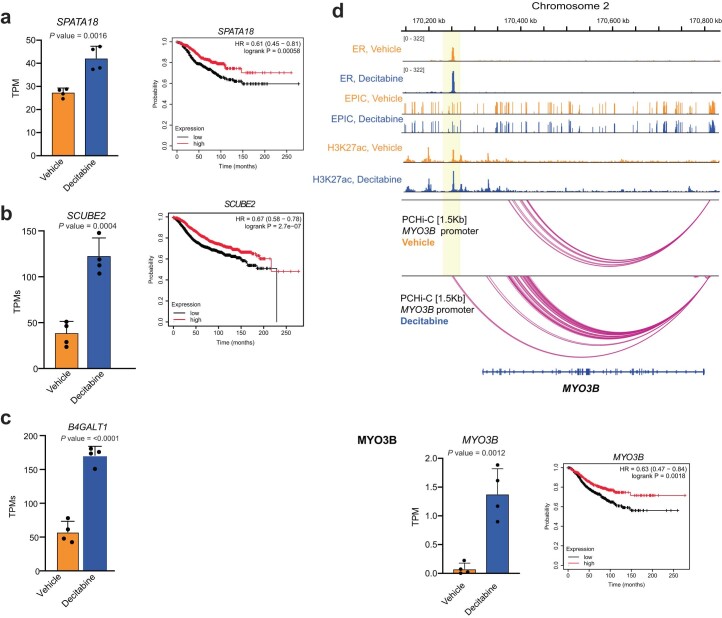
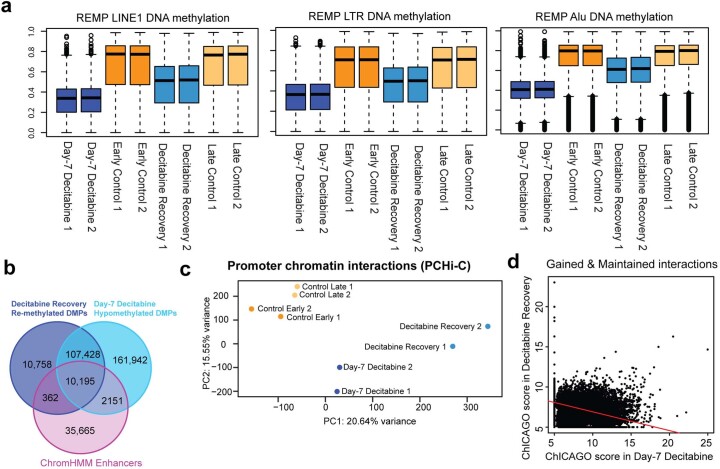
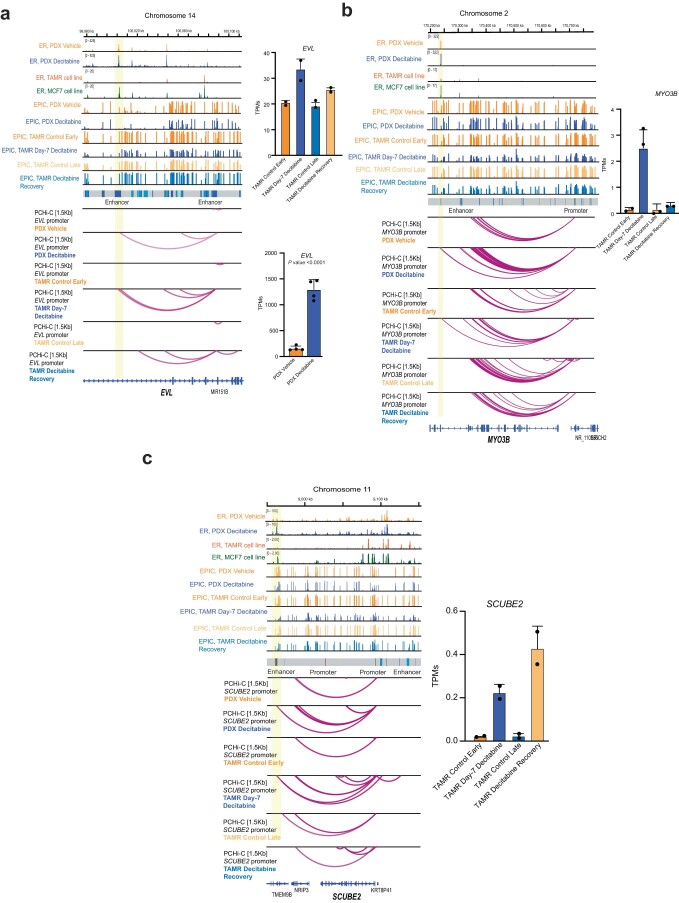
Three-dimensional (3D) epigenome remodeling is an important mechanism of gene deregulation in cancer. However, its potential as a target to counteract therapy resistance remains largely unaddressed. Here, we show that epigenetic therapy with decitabine (5-Aza-mC) suppresses tumor growth in xenograft models of pre-clinical metastatic estrogen receptor positive (ER+) breast tumor. Decitabine-induced genome-wide DNA hypomethylation results in large-scale 3D epigenome deregulation, including de-compaction of higher-order chromatin structure and loss of boundary insulation of topologically associated domains. Significant DNA hypomethylation associates with ectopic activation of ER-enhancers, gain in ER binding, creation of new 3D enhancer-promoter interactions and concordant up-regulation of ER-mediated transcription pathways. Importantly, long-term withdrawal of epigenetic therapy partially restores methylation at ER-enhancer elements, resulting in a loss of ectopic 3D enhancer-promoter interactions and associated gene repression. Our study illustrates the potential of epigenetic therapy to target ER+ endocrine-resistant breast cancer by DNA methylation-dependent rewiring of 3D chromatin interactions, which are associated with the suppression of tumor growth.


Conflict of interest statement

A.S. is an employee of Arima Genomics. The other authors declare no competing interests.

Figures

Fig. 1
Fig. 1. Decitabine inhibits tumor growth and induces widespread DNA hypomethylation.
a, Schematic of study design. Created with Biorender.com. WGBS: whole-genome bisulfite sequencing; TF, transcription factor b, Gar15-13 PDX growth curves for vehicle-treated (100 nM PBS, n = 7 mice) and decitabine-treated (0.5 mg kg–1, n = 7 mice) tumors. Data are represented as mean ± s.e.m. and analyzed using a two-tailed, unpaired Student’s t-test at the ethical or experimental endpoint. *P < 0.001. Endpoint test details are t = 5.678, df = 8, P = 0.0009. c, HCI-005 PDX growth curves for vehicle-treated (100 nM PBS, n = 8 mice), and decitabine-treated (0.5 mg kg−1, n = 7 mice) tumors. Data are represented as mean ± s.e. and analyzed using a two-tailed, unpaired Student’s t-test at the ethical or experimental endpoint. *P < 0.001. Endpoint test details are t = 5.231, df = 9, P = 0.0001. d, Ki-67 positivity at endpoint in Gar15-13 and HCI-005 PDXs. Data were analyzed using a two-tailed, unpaired Student’s t-test. *P < 0.001. Endpoint test details are t = 4.748, df = 11, P = 0.0006 and t = 4.698, df = 12, P = 0.0005 for Gar15-13 and HCI-005, respectively. e, Distribution of DNA methylation for vehicle-treated and decitabine-treated Gar15-13 PDXs (n = 4 biological replicates each). Box plots show median, interquartile range and maximum–minimum. Data were analyzed using the two-sided Z-test. f, O/E fold change enrichment of DMRs in Gar15-13 decitabine compared to vehicle across TAMR ChromHMM regulatory regions. *P < 0.001 (permutation test). Numbers located within each specific region are presented in the respective column. g, Overlap of consensus H3K27ac peaks between vehicle-treated and decitabine-treated Gar15-13 PDXs (n = 3 biological replicates each). Average signal intensity of H3K27ac at gained and lost H3K27ac binding sites in Gar15-13 PDXs. h, O/E fold change enrichment of hypomethylated DMRs in Gar15-13 decitabine compared to vehicle across gained and lost H3K27ac peaks. *P < 0.001 (permutation test). The numbers located within each specific region are presented in the respective column. Source data
Fig. 2
Fig. 2. Loss of DNA methylation results in de-compaction of chromatin.
a, Correlation between average eigenvalues per bin in vehicle-treated and decitabine-treated Gar15-13 PDX tumors. b, Top panel: distribution of stable (A to A; B to B) and switching (A to B; B to A) compartments in decitabine-treated Gar15-13 tumors compared to vehicle-treated tumors. Bottom panel: distribution of different types of switching compartments (A to B; B to A) in decitabine-treated tumors compared to vehicle-treated tumors. c, DNA methylation levels at compartment regions that switched their assignment from B to A and from A to B in decitabine-treated (n = 4 biological replicates) and vehicle-treated (n = 4 biological replicates) PDX tumors. Black line indicates median ± s.d. Box plots show median, interquartile range and maximum–minimum DNA methylation. Data were analyzed using the two-sided Z-test. d, Average contact enrichment (saddle plots) between pairs of 50 kb loci arranged by their PC1 eigenvector in vehicle-treated and decitabine-treated tumors. Average data from n = 3 biological replicates shown. The numbers at the center of the heatmaps indicate compartment strength calculated as the log2 transformed ratio of (A–A + B–B) / (A–B + B–A) using the mean values. e, Saddle plots calculated using the averaged PC1 obtained from vehicle-treated (n = 3 biological replicates) and decitabine-treated (n = 3 biological replicates) tumors. f, Density plot of insulation scores calculated in vehicle-treated and decitabine-treated tumors. g, Number of TADs identified in vehicle-treated and decitabine-treated (n = 3 biological replicates each) PDX tumors. h, Overlap between TAD boundaries identified in vehicle-treated and decitabine-treated tumors. i, Snapshot of region on chromosome 1, showing vehicle-treated and decitabine-treated tumor Hi-C matrixes. Loss of a TAD in decitabine-treated samples is indicated with an arrow, concomitant with decreased insulation at that region. Merged Hi-C data from replicates (n = 3) at 10 kb resolution. Merged CTCF CUT&RUN signal shown below. Source data
Fig. 3
Fig. 3. Loss of DNA methylation rewires 3D enhancer–promoter interactions.
a, Browser snapshot of interaction landscape at the PRR5L gene demonstrating increased coverage of promoter-anchored interactions in PCHi-C at 1.5 kb resolution compared to Hi-C at 10 kb resolution. Bait and other end (OE) regions are marked for illustrative purposes. b, ChromHMM (TAMR) annotation of CHiCAGO significant interaction bait (promoter) and OE regions (putative enhancers) in decitabine-treated and vehicle samples (*P < 0.001, permutation test). c, Overlap between promoter bait and OE enhancer regions for CHiCAGO significant interactions in vehicle-treated and decitabine-treated tumors. Merged data across n = 3 biological replicates shown. d, Violin plots showing the log10 genomic distance of promoter interactions whose enhancer OEs are gained, maintained or lost following decitabine treatment. *P < 0.0001, two-sided Wilcoxon rank sum test. Merged data across n = 3 biological replicates shown. e, Average number of enhancer OE interactions per promoter bait. Error bars indicate the interquartile range. P value from two-sided Wilcoxon rank sum test. f, Number of enhancer OE interactions per promoter bait for each CHiCAGO significant promoter-anchored interaction in vehicle-treated and decitabine-treated tumors. Merged data across n = 3 biological replicates shown. Data analyzed with two-tailed Pearson’s correlation test. g, Overlap of promoter baits and enhancer OEs that are either gained or lost in decitabine with compartments that switch with decitabine (A to B or B to A).
Fig. 4
Fig. 4. Rewired 3D chromatin interactions align with altered transcription.
a, Normalized enrichment scores (NES) for signature gene sets representing differentially expressed genes in RNA-seq data from Gar15-13 PDX tumors treated with decitabine compared to vehicle (n = 4 biological replicates; FDR < 0.05). b, Decitabine versus vehicle differential expression of genes that are located at enhancer–promoter interactions gained with decitabine treatment. Data analyzed with two-sided Fisher’s exact test. c, Transcription factor motifs significantly enriched at promoter-interacting enhancers (enhancer OEs) gained with decitabine treatment. Only motifs with binomial P < 0.05 are shown. d, Overlap of consensus ER peaks in vehicle-treated and decitabine-treated Gar15-13 PDX tumors (n = 4 biological replicates each). Heatmaps indicate ER ChIP-seq signal intensity at ERBS gained and lost in decitabine-treated compared to vehicle-treated tumors. e, Average signal intensity of ER ChIP-seq binding (Gar15-13 vehicle-treated and decitabine-treated tumors) at gained and lost ERBS with decitabine treatment. f, ChromHMM (TAMR) annotation (*P < 0.001, permutation test) of ERBS gained with decitabine treatment compared to matched random regions across the genome. Size of the overlap is presented in the respective column. g, Transcription factor motifs enriched at ERBS gained with decitabine treatment compared to matched random regions generated from ERE binding motifs across the genome. h, DNA methylation levels (β-values) at gained ERBS in decitabine-treated and vehicle-treated PDX tumors (n = 4 biological replicates each). i, Browser snapshot of ER ChIP-seq together with EPIC DNA methylation (vehicle and decitabine treatments, n = 4 biological replicates each) showing gain of ER binding and loss of DNA methylation at an enhancer region of ER target gene ANKRD2.
Fig. 5
Fig. 5. Rewired ER-bound interactions are associated with activation of ER target genes.
a, O/E fold change enrichment of gained enhancer OEs for ER binding gained and lost following decitabine treatment (*P < 0.0001, permutation test). b, Average ER ChIP-seq signal intensity (Gar15-13 vehicle-treated and decitabine-treated tumors) at ERBS located at DNA hypomethylation-induced enhancer OEs. c, Expression of genes connected to gained ER-mediated enhancer OEs in vehicle-treated and decitabine-treated tumors. d, Browser snapshots showing the promoter-anchored interactions at the SPATA18 gene, together with the average ER ChIP-seq signal, EPIC DNA methylation, H3K27ac CUT&RUN signal, ChromHMM track and PCHi-C interaction track. Merged replicate data are shown (n = 4 biological replicates each; n = 3 biological replicates each for CUT&RUN and PCHi-C). In decitabine-treated tumors, the SPATA18 promoter displays an increased number of interactions with an upstream enhancer region, which gains ER and H3K27ac binding with decitabine treatment, concomitant with loss of DNA methylation. Expression of the SPATA18 gene was upregulated in decitabine-treated tumors (shown in Extended Data Fig. 7a). e, Browser snapshots showing promoter-anchored interactions at the SCUBE2 ER target gene, together with ER ChIP-seq, EPIC DNA methylation, H3K27ac CUT&RUN signal, ChromHMM track and PCHi-C interaction track. Merged replicate data are shown (n = 4 biological replicates each; n = 3 biological replicates each for CUT&RUN and PCHi-C). In decitabine-treated tumors, the SCUBE2 promoter displays additional interactions with a distal enhancer, which gains ER and H3K27ac binding with decitabine treatment. Expression of the SCUBE2 gene was significantly upregulated in decitabine-treated tumors (shown in Extended Data Fig. 7b). f, Browser snapshots showing promoter-anchored interactions at the B4GALT1 ER target gene, together with ER ChIP-seq, EPIC DNA methylation, H3K27ac CUT&RUN signal, ChromHMM track and PCHi-C interaction track. Merged replicate data are shown (n = 4 biological replicates each, n = 3 biological replicates for CUT&RUN and PCHi-C). In decitabine-treated tumors, the B4GALT1 promoter displays additional long-range interactions with a distal enhancer, which gains ER and H3K27ac binding with decitabine treatment. Expression of the B4GALT1 gene was significantly upregulated in decitabine-treated tumors (shown in Extended Data Fig. 7c).
Fig. 6
Fig. 6. Dynamics between DNA methylation and 3D chromatin interactions.
a, Experimental design for the TAMR cell line study. Created with Biorender.com. b, Distribution of DNA methylation for control early, control late, day-7 decitabine and decitabine recovery (n = 2 technical replicates each) TAMRs for all EPIC probes. Black line indicates median ± s.d. Box plots show median, interquartile range and maximum–minimum DNA methylation. c, O/E fold change enrichment of DMRs in day-7 decitabine TAMRs compared to control early across TAMR ChromHMM regulatory regions (*P < 0.001, permutation test). The numbers located within each specific region are presented in the respective column. d, O/E fold change enrichment of day-7 decitabine hypomethylated DMRs (compared to control early) and decitabine recovery re-methylated DMRs (compared to day-7 decitabine) for ER binding in TAMRs (*P < 0.0001, permutation test). e, O/E fold change enrichment of EPIC DMRs that become re-methylated in decitabine recovery TAMRs compared to day-7 decitabine cells across TAMR ChromHMM regulatory regions (*P < 0.001, permutation test). The numbers located within each specific region are presented in the respective column. f, Number of enhancer OEs per promoter bait for each promoter-anchored interaction in day-7 decitabine and control early TAMRs. Merged data across replicates shown. Data were analyzed by two-tailed Pearson’s correlation test. g, Number of enhancer OEs per promoter bait for each promoter-anchored interaction in decitabine recovery and control late TAMRs. Merged data across replicates shown. Data were analyzed by two-tailed Pearson’s correlation test. h, Schematic representation of two identified classes (gained and lost; gained and maintained) of gained chromatin interactions in TAMRs. i, Overlap of enhancer OEs between day-7 decitabine and control early (left panel) and decitabine recovery and control late TAMRs (right panel). Bottom diagram shows overlap between gained interactions in day-7 decitabine versus control early and in decitabine recovery versus control late, demonstrating the number of gained and lost versus gained and maintained interactions. Merged data across replicates shown. Source data
Fig. 7
Fig. 7. Dynamics of altered ER-bound 3D chromatin interactions on gene transcription.
a, Differential expression of genes involved in gained interactions in day-7 decitabine-treated TAMRs. Genes included in representative examples are labeled. b, Differential expression of genes involved in gained interactions in decitabine recovery TAMRs. Genes included in representative examples are labeled. c, Browser snapshots showing promoter-anchored interactions at the SPATA18 ER target gene. Gar15-13 PDX vehicle-treated and decitabine-treated data tracks are overlayed with ER ChIP-seq for TAMR and MCF7 cell lines, EPIC methylation for TAMRs, ChromHMM track and PCHi-C for TAMR cell line data. Merged replicate data are shown (n = 4 biological replicates each for Gar15-13 and n = 2 technical replicates for TAMRs). In decitabine-treated PDXs and TAMRs (day-7 decitabine), the SPATA18 promoter displays an increased number of interactions with an upstream enhancer region, which gains ER binding with decitabine-treatment in PDXs, concomitant with loss of DNA methylation in both PDXs and TAMRs. These ectopic chromatin interactions are lost after 28 days of decitabine recovery with partial recovery of DNA methylation at that locus. SPATA18 gene expression was significantly upregulated in decitabine-treated versus vehicle-treated PDXs (bottom right, RNA-seq transcripts per million, TPM) and in day-7 decitabine-treated TAMRs and suppressed in decitabine recovery TAMRs (bottom left, RNA-seq TPM). d, Browser snapshots showing promoter-anchored interactions at the B4GALT1 ER target gene. Gar15-13 PDX vehicle-treated and decitabine-treated data tracks are overlayed with ER ChIP-seq for TAMR and MCF7 cell lines, EPIC methylation for TAMRs, ChromHMM track and PCHi-C for TAMR cell line data. Merged replicate data are shown (n = 4 biological replicates each for Gar15-13 and n = 2 technical replicates for TAMRs). In decitabine-treated PDXs and TAMRs (day-7 decitabine), the B4GALT1 promoter displays an increased number of long-range interactions with a distal enhancer region, which gains ER binding with decitabine treatment in PDXs, concomitant with loss of DNA methylation in both PDXs and TAMRs. These ectopic chromatin interactions are partially reversed after 28 days of recovery with recovery of DNA methylation at that enhancer locus. B4GALT1 expression increased decitabine-treated versus vehicle-treated PDXs (bottom right, RNA-seq TPM) and in day-7 decitabine-treated TAMRs compared to control early samples and was restored in decitabine recovery TAMRs (bottom left, RNA-seq TPM). Source data
Extended Data Fig. 1
Extended Data Fig. 1. Decitabine treatment induces DNA hypomethylation.
(a) Mice were treated with indicated doses of Decitabine for 35 consecutive days and mice weight was assayed to determine the most appropriate Decitabine concentration. (b) Representative images of ER immunohistochemistry staining in Gar15-13 Vehicle- and Decitabine-treated PDXs. Scale bars, 50 µm. Below: Quantification of the ER immunohistochemistry staining in Gar15-13 Vehicle- and Decitabine-treated PDXs (n = 6 mice each). Data represented as mean ± SEM. Data analysed using a two-tailed Wilcoxon matched-pairs signed rank test. * P value < 0.01. Endpoint test details are mean Diff = 0.149 95% CI (0.06021-0.2388), P value = 0.0027. (c) Distribution of DNA methylation in Vehicle and Decitabine-treated Gar15-13 PDXs (n = 4 biological replicates each) for all EPIC probes. Black line indicates median ± SD. Box plots show median, inter-quartile range and maximum/minimum DNA methylation. Data analysed using the two-sided Z test. (d) Distribution of DNA methylation in Vehicle and Decitabine-treated HCI-005 PDXs (n = 4 biological replicates each) for all EPIC probes. Black line indicates median ± SD. Box plots show median, inter-quartile range and maximum/minimum DNA methylation. Data analysed using the two-sided Z test. (e) Distribution of DNA methylation in HCI-005 Vehicle and Decitabine-treated (n = 4 biological replicates each) tumours for all EPIC probes. Box plots show median, inter-quartile range and maximum/minimum DNA methylation. Data analysed using the two-sided Z test. (f) RefSeq annotation of Vehicle vs. Decitabine hypomethylated probes (Gar15-13). (g) RefSeq annotation of Vehicle vs. Decitabine hypomethylated probes (HCI-005). (h) Observed over expected fold change enrichment of DMRs in HCI-005 Decitabine treatment compared to Vehicle across TAMR ChromHMM regulatory regions. * P value < 0.001 (permutation test). The numbers of DMRs located within each specific regions are presented in the respective column. DMR, differentially methylated region. Source data
Extended Data Fig. 2
Extended Data Fig. 2. Decitabine induced DNA hypomethylation at regulatory elements.
(a) Distribution of DNA methylation for Vehicle and Decitabine-treated (n = 4 biological replicates each) Gar15-13 PDXs for EPIC probes located at TAMR ChromHMM enhancer regions. Black line indicates median ± SD. Box plots show median, inter-quartile range and maximum/minimum DNA methylation. Data analysed using the two-sided Z test. (b) Distribution of DNA methylation for Vehicle and Decitabine-treated (n = 4 biological replicates each) HCI-005 PDXs for EPIC probes located at TAMR ChromHMM enhancer regions. Black line indicates median ± SD. Box plots show median, inter-quartile range and maximum/minimum DNA methylation. Data analysed using the two-sided Z test. (c) Distribution of DNA methylation for Vehicle and Decitabine-treated (n = 4 biological replicates each) Gar15-13 PDXs for EPIC probes located at TAMR ChromHMM promoter regions. Black line indicates median ± SD. Box plots show median, inter-quartile range and maximum/minimum DNA methylation. Data analysed using the two-sided Z test. (d) Distribution of DNA methylation for Vehicle and Decitabine-treated (n = 4 biological replicates each) HCI-005 for EPIC probes located at TAMR ChromHMM promoter regions. Black line indicates median ± SD. Box plots show median, inter-quartile range and maximum/minimum DNA methylation. Data analysed using the two-sided Z test. (e) H3K27ac CUT&RUN heatmap at H3K27ac binding sites gained and lost in Decitabine compared to Vehicle-treated Gar15-13 PDXs. (f) RefSeq annotation of Vehicle vs. Decitabine common, gained and lost H3K27ac binding sites in Gar15-13. (g) Distribution of DNA methylation for Vehicle and Decitabine-treated (n = 4 biological replicates each) Gar15-13 PDXs for EPIC probes mapping to LTR, LINE1 and Alu elements (REMP annotation). Black line indicates median ± SD. Box plots show median, inter-quartile range and maximum/minimum DNA methylation. Data analysed using the two-sided Z test. (h) Distribution of DNA methylation for Vehicle and Decitabine-treated HCI-005 PDXs for EPIC probes mapping to LTR, LINE1 and Alu elements (REMP annotation) (n = 4 biological replicates each). Black line indicates median ± SD. Box plots show median, inter-quartile range and maximum/minimum DNA methylation. Data analysed using the two-sided Z test.
Extended Data Fig. 3
Extended Data Fig. 3. Alteration to A/B compartment structure upon Decitabine treatment.
(a) Spearman pairwise correlations between the eigenvectors (PC1) in Decitabine-treated and Vehicle (n = 3 biological replicates each) Gar15-13 PDXs. Samples are ordered according to complete linkage hierarchal clustering. (b) logFC expression between Vehicle and Decitabine-treated (n = 3 biological replicates each) Gar15-13 PDXs of genes located either at A to B or B to A switching compartments. P value: two-sided Wilcox rank sum test. Box plots show median, inter-quartile range and maximum/minimum log fold change. (c) Decitabine vs. Vehicle differential expression of genes located at compartment that switched from B to A assignment in Decitabine-treated tumours. Information on all genes included in Supplementary Table 8. (d) Browser snapshot of Hi-C eigenvectors and RNA-seq in Vehicle and Decitabine-treated tumours (n = 3 biological replicates for Hi-C and n = 4 biological replicates for RNA-seq each), showing demarcation of open (A-type; positive values) and closed (B-type; negative values) compartment changes across a region on chromosome 5, which is associated with increased expression of the GDNF gene located within this region. (e) log2 observed over expected A – A, B – B and B – A compartment interactions in Vehicle (n = 3 biological replicates) for and Decitabine (n = 3 biological replicates) Gar15-13 PDXs. * P value two-tailed Students t-test < 0.05. (f) Average contact enrichment between pairs of 50Kb loci arranged by their PC1 eigenvector in Vehicle and Decitabine-treated tumours. The numbers at the center of the heatmaps indicate compartment strength calculated as the log2 ratio of (A–A + B–B)/ (A–B + B–A) using the mean values.
Extended Data Fig. 4
Extended Data Fig. 4. Alteration to TAD structure upon Decitabine treatment.
(a) Average insulation score calculated by TADtool at 50Kb resolution in three biological replicates of Decitabine-treated and Vehicle Gar15-13 PDXs. P value two-sided Wilcox rank sum test. Box plots show median, inter-quartile range and maximum/minimum insulation score. (b) Distribution in TAD sizes for Vehicle and Decitabine treated Gar15-13 PDXs (n = 3 biological replicates each). Box plots show median, inter-quartile range and maximum/minimum log fold change. (c) Average insulation score at differential and common TADs. Lines show mean values, while light shading represents SEM. (d) CTCF CUT&RUN heatmaps at CTCF binding sites gained and lost in Decitabine compared to Vehicle-treated Gar15-13 PDXs. (e) Average signal intensity of CTCF CUT&RUN binding (Gar15-13 Vehicle- and Decitabine-treated PDXs) at gained and lost CTCF binding sites with Decitabine treatment. (f) Observed over expected fold change enrichment of common, gained, and lost CTCF binding sites (CTCFBS) in Decitabine treated Gar15-13 tumours compared to Vehicle across unaltered, Decitabine-specific and Vehicle-specific TAD boundaries. * P value < 0.001 (permutation test). (g) Average signal intensity of CTCF CUT&RUN binding (Gar15-13 Vehicle- and Decitabine-treated tumours) at unaltered, Vehicle-specific and Decitabine-specific TAD boundaries. (h) Snapshot of region on chromosome 3, showing insulation score calculated in Vehicle and Decitabine-treated tumour Hi-C matrixes, demonstrating loss of TAD boundary insulation is Decitabine-treated samples (indicated with a red box). Merged Hi-C data from n = 3 biological replicates shown at 10Kb resolution. (i) Snapshot of region on chromosome 4, showing insulation score calculated in Vehicle and Decitabine-treated tumour Hi-C matrixes, demonstrating loss of TAD boundary insulation is Decitabine-treated samples (indicated with a red box). Merged Hi-C data from n = 3 biological replicates shown at 10Kb resolution.
Extended Data Fig. 5
Extended Data Fig. 5. Alteration to promoter-anchored interactions upon Decitabine treatment.
(a) Observed over expected fold change enrichment of gained OE interacting regions and gained and lost H3K27ac binding sites. * P value < 0.001 (permutation test). Size of the overlap is presented in the respective column. (b) Number of promoter baits and enhancer OEs involved in significant CHiCAGO interactions for each of the PCHi-C maps from Vehicle and Decitabine-treated Gar15-13 tumours (n = 3 biological replicates each). (c) Average number of promoter baits and enhancer OEs involved in significant CHiCAGO interactions across the three Vehicle and three Decitabine-treated PCHi-C replicates. Error bars indicate SD. P value two-sided Wilcoxon rank-sum test. (d) ChICAGO scores of promoter-anchored interactions identified from PCHi-C data in Decitabine and Vehicle tumours. Data from n = 3 biological replicate tumours shown. Box plots show median, inter-quartile range and maximum/minimum log fold change. (e) Percentage of promoter-anchored interactions located in chromosomal compartments that switched assignments (A to B or B to A) and stable A or B compartments. Source data
Extended Data Fig. 6
Extended Data Fig. 6. Alterations to Estrogen Receptor binding upon Decitabine treatment.
(a) RNA-seq heatmap of Decitabine-induced changes in expression of genes belonging to the Estrogen Response (GSEA) Hallmarks. Top differentially expressed genes plotted (FDR < 0.05). (b) Transcriptions factor motifs enriched at hypomethylated DMRs between Vehicle- and Decitabine-treated Gar15-13 PDXs compared to matched random regions across the genome. Only motifs with binomial P value < 0.05 are shown. (c) RefSeq annotation of Vehicle vs. Decitabine lost and gained ERBS in Gar15-13. (d) Observed over expected fold change enrichment of gained ER binding sites (ERBS) and gained and lost H3K27ac binding sites. * P value < 0.001 (permutation test). Size of the overlap is presented in the respective column. (e) ChromHMM (TAMR) annotation (*P value < 0.001, permutation test) of ER binding sites lost with Decitabine treatment compared to matched random regions across the genome. Size of the overlap is presented in the respective column. (f) Motifs enriched at ERBS lost with Decitabine treatment compared to matched random regions generated from ERE binding motifs across the genome. Only motifs with binomial P value < 0.05 are shown. (g) DNA methylation levels at gained ERBS in Decitabine-treated (n = 4 biological replicates) and Vehicle (n = 4 biological replicates) PDX Gar15-13 PDXs. Box plots show median, inter-quartile range and maximum/minimum log fold change. (h) Browser snapshot of ER ChIP-seq and EPIC DNA methylation (Vehicle and Decitabine-treated PDXs, n = 4 biological replicates each), showing concomitant gain of ER binding and loss of DNA methylation at enhancer of ER target gene BTBD9. (i) DNA methylation levels at lost ERBS in Decitabine-treated (n = 4 biological replicates) and Vehicle (n = 4 biological replicates) Gar15-13 PDXs. Box plots show median, inter-quartile range and maximum/minimum log fold change. DMR, differentially methylated region. ERBS, ER binding site.
Extended Data Fig. 7
Extended Data Fig. 7. Expression of genes at ER-bound chromatin interactions.
a) The relative mRNA expression levels of SPATA18 gene from RNA-seq (two-tailed t-test P < 0.05 derived from n = 4 biological replicates). Error bars indicate SD from four samples. Kaplan–Meier survival plot showing the ability of SPATA18 gene to stratify ER+ breast cancer patients in the METABRIC cohort into good and poor outcome groups. Data analysed using the log-rank test. P values indicated within the graph. (b) The relative mRNA expression levels of SCUBE2 gene from RNA-seq (two-tailed t-test P < 0.05 derived from n = 4 biological replicates). All data are represented as mean ± SD. Error bars indicate SD from four samples. Kaplan–Meier survival plot showing the ability of SCUBE2 gene to stratify ER+ breast cancer patients in the METABRIC cohort into good and poor outcome groups. Data analysed using the log-rank test. P values indicated within the graph. (c) The relative mRNA expression levels of B4GALT1 gene from RNA-seq (two-tailed t-test P < 0.05 derived from n = 4 biological replicates). All data are represented as mean ± SD. Error bars indicate SD from four samples. (d) Browser snapshots showing the promoter-anchored interactions at the MYO3B ER target gene, together with ER ChIP-seq, EPIC DNA methylation, H3K27ac CUT&RUN signal, ChromHMM track and PCHi-C interaction track. Merged replicate data shown (n = 4 biological replicates each, n = 3 biological replicates for CUT&RUN and PCHi-C). In Decitabine-treated tumours, the MYO3B promoter displays increased number of interactions with an enhancer, which gains ER and H3K27ac binding with Decitabine treatment. The relative expression of the MYO3B gene was significantly upregulated in Decitabine-treated tumours (two-tailed t-test P < 0.05 derived from n = 4 biological replicates) and associated with good outcome in ER+ breast cancer patients in the METABRIC cohort. Data analysed using the log-rank test. P values indicated within the graph. All data are represented as mean ± SD. Error bars indicate SD from four samples. Source data
Extended Data Fig. 8
Extended Data Fig. 8. 3D epigenome dynamics in time-course of Decitabine treatment.
(a) Distribution of DNA methylation for Control (Control Early/Late), Day-7 Decitabine and Decitabine Recovery (n = 2 technical replicates each) TAMR cells for EPIC probes mapping to LTR, LINE1 and Alu elements (REMP annotation). Black line indicates median ± SD. Box plots show median, inter-quartile range and maximum/minimum DNA methylation. (b) Overlap of DMPs that are re-methylated in Decitabine Recovery compared to Day-7 Decitabine, Day-7 Decitabine hypomethylated DMPs and ChromHMM enhancer regions. (c) Principal component analysis showing the relationship among the PCHi-C promoter-anchored interactions of TAMR cells treated with Decitabine (Day-7 Decitabine) and following 28 days recovery (Decitabine Recovery) as well as matched control cells (Control Early and Late) (n = 2 technical replicates each). Data plotted for normalised ChICAGO interaction scores. (d) CHiCAGO significance scores for each “Gained & Maintained” chromatin interaction in Day-7 Decitabine and Decitabine Recovery TAMR cells. Merged data across n = 2 technical replicates shown.
Extended Data Fig. 9
Extended Data Fig. 9. Dynamic expression of genes at ER-bound chromatin interactions in time-course of Decitabine treatment.
(a) Browser snapshots showing promoter-anchored interactions at the EVL ER target gene. Gar15-13 PDX Vehicle- and Decitabine-treated data tracks are overlayed with ER ChIP-seq for TAMR/MCF7 cell lines; EPIC methylation for TAMRs; ChromHMM track and finally PCHi-C for TAMR cell line data. Merged replicate data shown (n = 4 biological replicates each for Gar15-13 and n = 2 technical replicates for TAMRs) In Decitabine-treated PDXs and TAMRs (Day-7 Decitabine), the EVL promoter displays additional interactions with enhancer region, which gains ER binding with Decitabine treatment in PDXs, concomitant with loss of DNA methylation in both PDXs and TAMRs. These ectopic interactions are lost after 28 days of recovery with recovery of DNA methylation at that locus. Expression of the EVL gene was significantly upregulated in Decitabine-treated vs. Vehicle PDXs (bottom right, RNA-seq TPM) and increased in Day-7 Decitabine TAMRs compared to Control Early and was restored in Decitabine Recovery (top right, RNA-seq TPM). (b) Browser snapshots showing promoter-anchored interactions at the MYO3B ER target gene. Gar15-13 Vehicle- and Decitabine-treated PDX data tracks are overlayed with ER ChIP-seq for TAMR/MCF7; EPIC methylation for TAMRs; ChromHMM track and finally PCHi-C for TAMRs. In Decitabine-treated PDXs and TAMRs (Day-7 Decitabine), the MYO3B promoter displays increased number of interactions with an enhancer, which gains ER binding with Decitabine treatment in PDXs. The relative expression of the MYO3B gene increased in Day-7 Decitabine-treated TAMRs (RNA-seq TPM). Error bars indicate SD from two samples. (c) Browser snapshots showing promoter-anchored interactions at the SCUBE2 ER target gene. Gar15-13 PDX Vehicle- and Decitabine treatment data tracks are overlayed with ER ChIP-seq for TAMR/MCF7; EPIC methylation for TAMRs, ChromHMM track and finally PCHi-C. In Day-7 Decitabine-treated PDXs and TAMRs, the SCUBE2 promoter displays additional interactions with a distal enhancer, which gains ER binding with Decitabine treatment. Expression of the SCUBE2 gene was upregulated in Day-7 Decitabine and its expression continued to increase in Decitabine Recovery. Error bars indicate SD from two samples. Merged replicate data shown (n = 4 biological replicates for Gar15-13 and n = 2 technical replicates for TAMRs).

References

    1. Farcas AM, Nagarajan S, Cosulich S, Carroll JS. Genome-wide estrogen receptor activity in breast cancer. Endocrinology. 2021;162:bqaa224. doi: 10.1210/endocr/bqaa224. - DOI - PMC - PubMed
    1. Garcia-Martinez L, Zhang Y, Nakata Y, Chan HL, Morey L. Epigenetic mechanisms in breast cancer therapy and resistance. Nat. Commun. 2021;12:1786. doi: 10.1038/s41467-021-22024-3. - DOI - PMC - PubMed
    1. Ross-Innes CS, et al. Differential oestrogen receptor binding is associated with clinical outcome in breast cancer. Nature. 2012;481:389–393. doi: 10.1038/nature10730. - DOI - PMC - PubMed
    1. Lupien M, et al. Growth factor stimulation induces a distinct ERα cistrome underlying breast cancer endocrine resistance. Genes Dev. 2010;24:2219–2227. doi: 10.1101/gad.1944810. - DOI - PMC - PubMed
    1. Achinger-Kawecka J, Clark SJ. Disruption of the 3D cancer genome blueprint. Epigenomics. 2017;9:47–55. doi: 10.2217/epi-2016-0111. - DOI - PubMed