. 2024 Jan 5;31(1):2.
doi: 10.1186/s12929-023-00990-8.

Localization, traffic and function of Rab34 in adipocyte lipid and endocrine functions

Affiliations

Localization, traffic and function of Rab34 in adipocyte lipid and endocrine functions

Jaime López-Alcalá et al. J Biomed Sci. .

Abstract

Background: Excessive lipid accumulation in the adipose tissue in obesity alters the endocrine and energy storage functions of adipocytes. Adipocyte lipid droplets represent key organelles coordinating lipid storage and mobilization in these cells. Recently, we identified the small GTPase, Rab34, in the lipid droplet proteome of adipocytes. Herein, we have characterized the distribution, intracellular transport, and potential contribution of this GTPase to adipocyte physiology and its regulation in obesity.

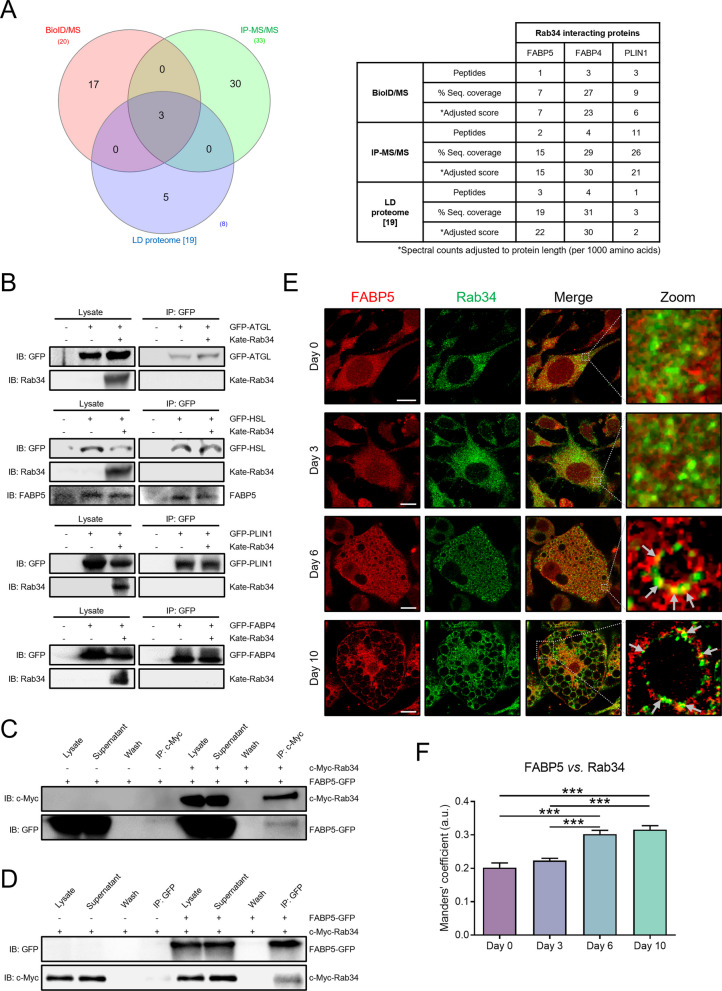
Methods: 3T3-L1 and human primary preadipocytes were differentiated in vitro and Rab34 distribution and trafficking were analyzed using markers of cellular compartments. 3T3-L1 adipocytes were transfected with expression vectors and/or Rab34 siRNA and assessed for secretory activity, lipid accumulation and expression of proteins regulating lipid metabolism. Proteomic and protein interaction analyses were employed for the identification of the Rab34 interactome. These studies were combined with functional analysis to unveil the role played by the GTPase in adipocytes, with a focus on the actions conveyed by Rab34 interacting proteins. Finally, Rab34 regulation in response to obesity was also evaluated.

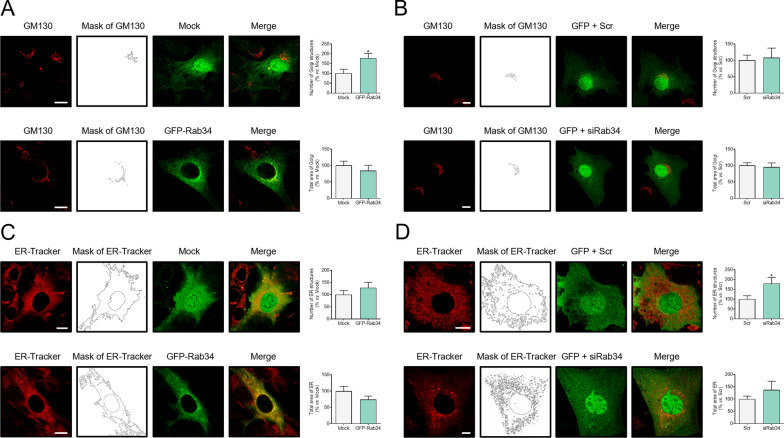
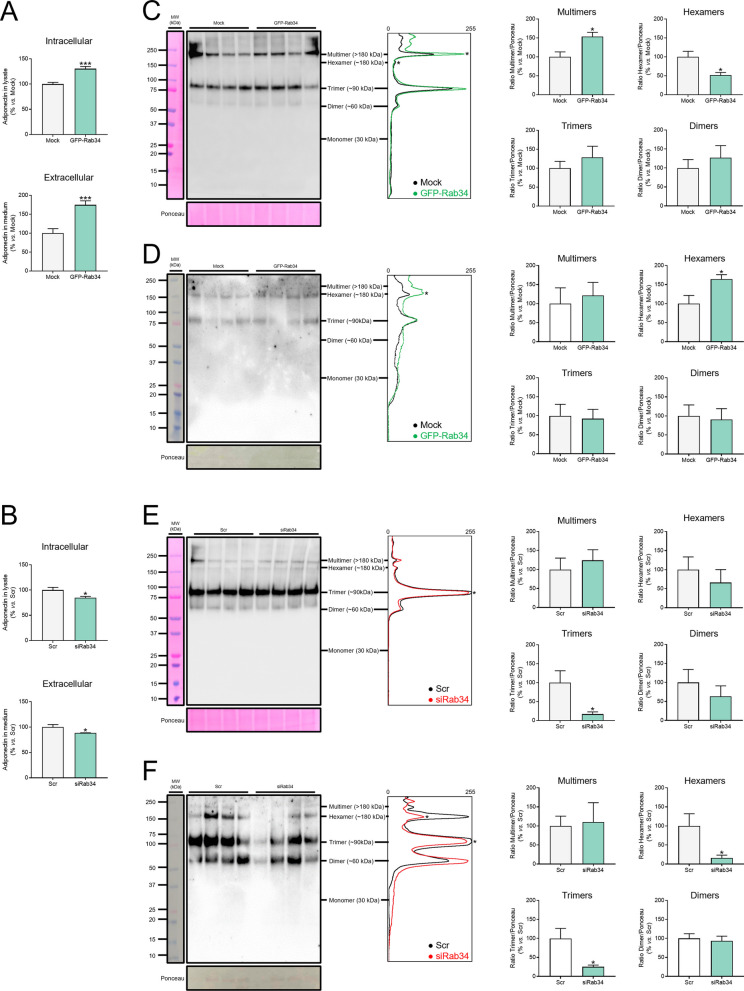
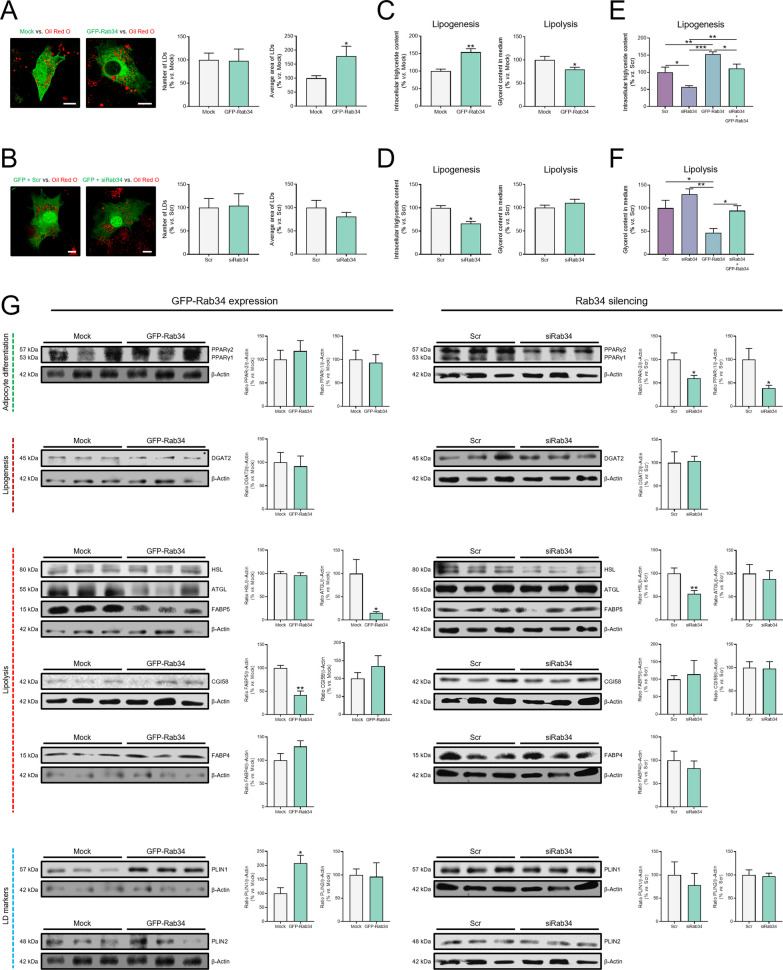
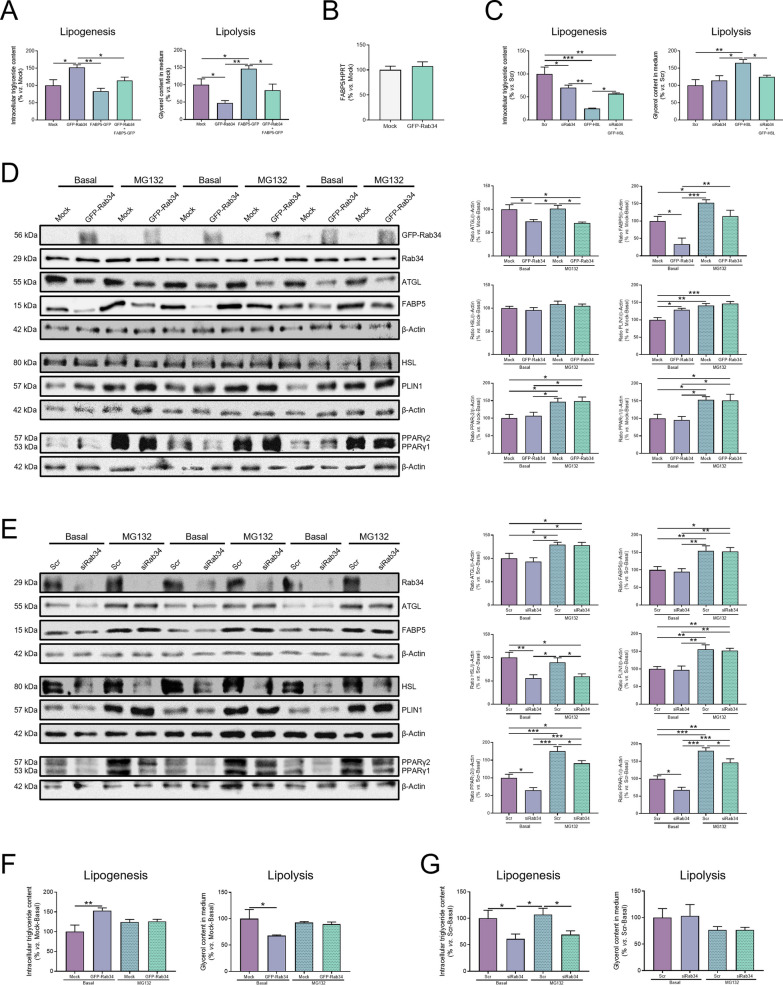
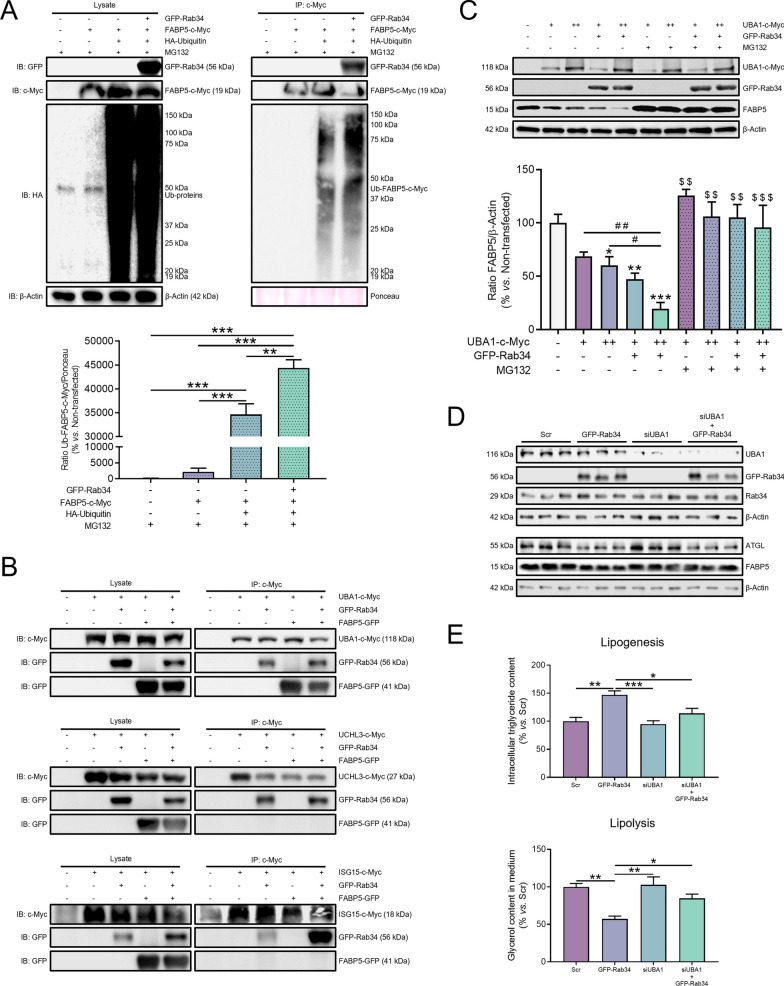
Results: Our results show that Rab34 localizes at the Golgi apparatus in preadipocytes. During lipid droplet biogenesis, Rab34 translocates from the Golgi to endoplasmic reticulum-related compartments and then reaches the surface of adipocyte lipid droplets. Rab34 exerts distinct functions related to its intracellular location. Thus, at the Golgi, Rab34 regulates cisternae integrity as well as adiponectin trafficking and oligomerization. At the lipid droplets, this GTPase controls lipid accumulation and lipolysis through its interaction with the E1-ubiquitin ligase, UBA1, which induces the ubiquitination and proteasomal degradation of the fatty acid transporter and member of Rab34 interactome, FABP5. Finally, Rab34 levels in the adipose tissue and adipocytes are regulated in response to obesity and related pathogenic insults (i.e., fibrosis).

Conclusions: Rab34 plays relevant roles during adipocyte differentiation, including from the regulation of the oligomerization (i.e., biological activity) and secretion of a major adipokine with insulin-sensitizing actions, adiponectin, to lipid storage and mobilization from lipid droplets. Rab34 dysregulation in obesity may contribute to the altered adipokine secretion and lipid metabolism that characterize adipocyte dysfunction in conditions of excess adiposity.

Keywords: Adipocytes; Adiponectin; Golgi apparatus; Lipid droplets; Lipid metabolism; Protein trafficking; Rab34.


Conflict of interest statement

The authors confirm that there are no competing interests.

Figures

Fig. 1
Fig. 1
Rab34 distribution and expression during differentiation of 3T3-L1 cells into adipocytes. A Representative confocal images of 3T3-L1 cells immunostained for Rab34 during differentiation (days 0, 3, 6 and 10), and representative immunoblot and protein quantification of Rab34 in 3T3-L1 cell extracts during differentiation (days 0, 3, 6 and 10). Data are expressed as the ratio of Rab34 immunosignal to β-Actin immunosignal and represent the mean ± SEM of n = 4 biological replicates. B Representative images of 3T3-L1 cells double-immunostained with antibodies against Rab34 and the LD marker, PLIN1, or the cis-Golgi marker, GM130, respectively. C Colocalization study of Rab34 with cell compartments during the process of differentiation of 3T3-L1 cells. 3T3-L1 cells were labeled with anti-Rab34 or GFP-Rab34 and antibodies against different intracellular markers: STX6 (trans-Golgi), SEC23 (COPII vesicles), ARF1 (COPI vesicles), ERGIC53 (ERGIC), or SEC16A (ERES). Manders’ coefficients were calculated to assess the colocalization between signals. Data are expressed as the mean ± SEM (n = 12 cells/differentiation day, 2 replicate studies). *P < 0.05; **P < 0.01; ***P < 0.001. Scale bar: 10 μm
Fig. 2
Fig. 2
Analysis of Rab34 association with LDs upon brefeldin A (BFA) treatment. 3T3-L1 cells were exposed to BFA (20 μmol/L, 1 h) at day 2 or day 4 of differentiation. Forty-eight hours after treatment, cells were processed for confocal microscopy or immunoblotting studies. A Cells were triple-immunostained with anti-GM130, anti-Rab34 and anti-PLIN1 sera. Graphs show the number and average size of LDs (µm2) per cell and per experimental condition (n = 10 cells/experimental condition, 2 replicate studies). Scale bar: 10 μm. B Western blot analysis of Rab34 protein content in cells exposed to medium alone (control) or to BFA at D2 or D4. Data are referred to control cultures at day 2 of differentiation (100%) and expressed as mean ± SEM (n = 3 biological replicates/experimental condition). C Manders’ coefficient (expressed in arbitrary units, a.u.) for colocalization of Rab34 and PLIN1 immunosignals in 3T3-L1 cells, expressed as mean value per cell (upper graph) or according to LD area (µm2) (middle and lower graphs). Data are expressed as mean ± SEM (n = 10 cells/experimental condition, 2 replicate studies). *P < 0.05; **P < 0.01; ***P < 0.001
Fig. 3
Fig. 3
Effects of Rab34 expression/silencing on Golgi/ER structure in 3T3-L1 adipocytes. AD Representative images of 3T3-L1 cells transfected with GFP (Mock) or GFP-Rab34 vectors and Scramble siRNA (Scr) or Rab34 siRNA (siRab34), and stained with anti-GM130 (A, B) or ER-Tracker (C, D). Cells were transfected at day 3 and collected at day 5 (expression studies) or day 6 (silencing studies) of differentiation. Morphometric analyses were carried out using ImageJ software. The number of GM130-positive structures and total Golgi area (A, B), and ER-positive structures and total ER area (C, D) in cells expressing GFP-Rab34 or siRab34 are referred to their corresponding controls (Mock/Scr; 100%). Data are expressed as mean ± SEM (n = 10 cells/experimental condition, 2 replicate studies). Scale bar: 10 μm
Fig. 4
Fig. 4
Effects of Rab34 expression/silencing on the secretory pathway in 3T3-L1 adipocytes. AF Quantification of adiponectin secretion and oligomerization in control cells (Mock/Scr) and cells expressing GFP-Rab34 (A, C, D) or siRab34 (B, E, F). A, B Adiponectin content in protein extracts (intracellular) and the culture media (extracellular) in control cells and cells expressing GFP-Rab34 (A) or transfected with siRab34 (B) were analyzed by ELISA (n = 6 biological replicates). CF Representative immunoblots and quantification of adiponectin multimers, hexamers, trimers and dimers in intra- and extracellular extracts from control cells and cells expressing GFP-Rab34 (C, D) or transfected with siRab34 (E, F). Cells were transfected at day 3 and collected at day 5 (expression studies) or day 6 (silencing studies) of differentiation. Cell samples were collected and the proteins were resolved in non-reducing SDS-PAGE gels with a 4–20% gradient and subjected to Western blot and densitometric analysis. Ponceau S was used as loading control. Data are referred to values in control cells (Mock; Scr) (100%) and expressed as the mean ± SEM (n = 4 biological replicates). *P < 0.05; ***P < 0.001 vs. Mock/Scr
Fig. 5
Fig. 5
Effects of Rab34 expression/silencing on lipid accumulation in adipocytes. A, B Representative images of 3T3-L1 cells transfected at day 3 of differentiation with GFP (Mock), GFP-Rab34, Scramble siRNA (Scr) or Rab34 siRNA (siRab34) and stained with Oil Red O at day 5 (expression, A) or day 6 (silencing, B) of differentiation. Morphometric analyses were carried out using ImageJ software. The number and average area of LDs was calculated per cell and referred to values in control cells (100%) (Mock, A; Scr, B). Data are expressed as mean ± SEM (n = 10 cells/experimental condition, 2 replicate studies). Scale bar: 10 μm. C, D Quantification of TG content (lipogenesis) and glycerol release (lipolysis) in each condition. Data are referred to values in control cells (Mock; Scr) (100%) and expressed as mean ± SEM (n = 4 biological replicates). E, F Measurement of triglyceride content (lipogenesis) and glycerol release (lipolysis) in cells expressing GFP-Rab34 or siRab34, alone or in combination (Rab34 recovery). Data are referred to control cultures (Scr) (100%) and expressed as mean ± SEM (n = 3 biological replicates). G Quantification of the protein levels of markers of adipocyte differentiation, lipogenesis, lipolysis, and LD markers in 3T3-L1 cells transfected with Mock (GFP) or Rab34 (GFP-Rab34) expression vectors (left panel), or Scramble (Scr) or Rab34 siRNA (siRab34) (right panel). Cells were transfected at day 3 and collected at day 5 (expression studies) or day 6 (silencing studies) of differentiation. The β-Actin immunoreactive band in each membrane was employed as a reference for quantification of the corresponding proteins that were revealed in the same blot. Data correspond to the ratio of each immunosignal to β-actin immunosignal and are referred to values in control cells (Mock; Scr) (100%). Data represent the mean ± SEM (n = 3 biological replicates). *P < 0.05; **P < 0.01; ***P < 0.001
Fig. 6
Fig. 6
Identification of the Rab34 Interactome. A Venn diagram of the proteins participating in the “Metabolism of lipids” pathway from Reactome Pathways dataset that were identified by the three proteomic approaches analyzed in this study: (i) BioID/MS (20 proteins); (ii) IP-MS/MS (33 proteins); and (iii) Proteome of adipocyte LDs (8 proteins) [19]. Among them, the lipid chaperones, FABP4 and FABP5, and the LD-associated protein, PLIN1, were present in the three proteomic datasets. Spectral counts were adjusted to protein length (per 1000 amino acids). B Co-immunoprecipitation experiments in HEK-293 AD cells expressing Kate-Rab34 and either GFP-ATGL, GFP-HSL, GFP-PLIN1, and GFP-FABP4 using anti-GFP beads. Both lysates and immunoprecipitates (IP) were subjected to immunoblotting with anti-GFP and anti-Rab34; anti-FABP5 antibodies were also used for studies using GFP-HSL. C, D Co-immunoprecipitation experiments in HEK-293 AD cells expressing c-Myc-Rab34 and FABP5-GFP, alone or in combination, using anti-c-Myc-beads (C) or anti-GFP-beads (D). Immunoblotting studies of lysates and IP were carried out using anti-c-Myc (C) or anti-GFP antibodies (D). E Representative confocal images of 3T3-L1 cells showing the colocalization (merge) of Rab34 (green) and FABP5 (red) during differentiation (days 0, 3, 6 and 10). Arrows indicate Rab34/FABP5 colocalization (yellow) at the LD surface. F Manders’ coefficient between Rab34 and FABP5 was calculated to quantify the degree of colocalization between both signals. Data represent the mean ± SEM (n = 10 cells/differentiation day, 2 replicate studies). ***P < 0.001. Scale bar: 10 μm
Fig. 7
Fig. 7
Rab34 actions on lipid metabolism are mediated by FABP5 in a proteasome-dependent manner. A Quantification of the lipogenic and lipolytic activities of 3T3-L1 cells expressing GFP-Rab34, FABP5-GFP or a combination of both expression vectors as compared to cells expressing the empty GFP vector (Mock). B RT-qPCR analysis of FABP5 mRNA expression levels in 3T3-L1 cells expressing GFP-Rab34. FABP5 mRNA levels were calculated using the Ct method and HPRT as housekeeping gene, and expressed as the mean ± SEM (n = 3 biological experiments). C Quantification of the lipogenic and lipolytic activities of 3T3-L1 cells expressing siRab34, GFP-HSL or a combination of both nucleic acids as compared to cells transfected with scramble siRNA (Scr). (D, E) Quantitative immunoblotting analysis of Rab34, ATGL, FABP5, HSL, PLIN1, PPARγ1, and PPARγ2 in 3T3-L1 cells expressing GFP-Rab34 (D) or siRab34 (E), and exposed or not (Basal) to the proteasome inhibitor, MG132 (10 μmol/L, 12 h). Cells transfected with the empty GFP vector (Mock) or scramble siRNA (Scr) were employed as controls. Graphs show the ratio of each immunosignal to β-actin immunosignal. Data are expressed as the mean ± SEM (n = 3 biological replicates). F, G Lipogenic and lipolytic activities of 3T3-L1 cells expressing GFP-Rab34 (F) or siRab34 (G) and exposed or not (Basal) to the proteasome inhibitor, MG132 (10 μmol/L, 12 h). Data are expressed as a percentage of values in control cultures and represent the mean ± SEM (n = 3 individual experiments). All data are referred to values in control cells (100%) (Basal; Mock/Scr). *P < 0.05; **P < 0.01; ***P < 0.001
Fig. 8
Fig. 8
UBA1 conveys Rab34 action on FABP5 stability to regulate lipid metabolism. A Transfected 3T3-L1 cells with the indicated plasmids (GFP-Rab34 or FABP5-c-Myc) were treated with MG132 (10 μmol/L, 12 h) and lysed under denaturing conditions. c-Myc-tagged FABP5 was purified by anti-c-Myc immunoprecipitation and ubiquitinated FABP5 was detected by Western Blot. An expression vector coding for hemagglutinin (HA)-tagged ubiquitin (HA-Ubiquitin) was employed for cotransfection of cells expressing FABP5-c-Myc, alone or in combination with GFP-Rab34. The graph shows the ratio of Ubiquitinated-FABP5-c-Myc immunosignal to Ponceau S immunosignal. Data are referred to values in non-transfected cells (100%) and expressed as mean ± SEM (n = 3 biological replicates). **P < 0.01; ***P < 0.001. B Co-immunoprecipitation analysis in cells expressing GFP-Rab34 and vectors coding for LD-associated proteins related to ubiquitination/deubiquitination processes: UBA1-c-Myc (top panel), UCHL3-c-Myc (middle panel), or ISG15-c-Myc (bottom panel). In each experimental setting, proteins were purified by anti-c-Myc immunoprecipitation and detected by Western Blot using anti-c-Myc or anti-GFP antibodies. C Representative immunoblots and quantification of FABP5 levels in 3T3-L1 cells transfected with GFP-Rab34 (+ , 0.8 µg/µL), UBA1-c-Myc (+ , 0.8 µg/µL; +  + , 1.6 µg/µL) or both expression vectors in the absence or presence of MG132 (10 µmol/L, 12 h). Data represent the ratio of FABP5 immunosignal to β-actin immunosignal and referred to values in non-transfected cells (100%). Data are expressed as mean ± SEM (n = 3 biological replicates). *P < 0.05; **P < 0.01; ***P < 0.001 vs. non-transfected cells. $$P < 0.01; $$$P < 0.001 vs. their respective condition treated with MG132. #P < 0.05; ##P < 0.01. D, E Rescue experiments of FABP5 in 3T3-L1 cells expressing GFP-Rab34 and UBA1 siRNA (siUBA1), alone or in combination. At the end of the experiments, cells were processed for immunoblotting studies (D) (see also Fig. S4) and for measurement of TGs (lipogenesis) and glycerol content (lipolysis) (E). Data are referred to values in control cells (100%; Scr), and expressed as mean ± SEM (n = 3 biological replicates). *P < 0.05; **P < 0.01; ***P < 0.001
Fig. 9
Fig. 9
Characterization of Rab34 in human adipocytes and animal models of obesity. A Representative confocal microscopy images of mature adipocytes isolated from human omental (OM) and subcutaneous (SC) adipose tissue double-immunostained with the anti-Rab34 antibody and antibodies against PLIN1, GM130, and ERGIC53 or labeled with the ER-Tracker. B Representative confocal microscopy images of human OM and SC preadipocytes at different days of differentiation (day 5 and 10). Cells were incubated with the anti-Rab34 antibody and either antibodies against ERGIC53 or PLIN1 or the ER-Tracker. For detection of ERES, cells expressing GFP-Rab34 were incubated with an anti-SEC16A antibody. Manders’ coefficients were calculated to assess the colocalization between signals. Data are expressed as the mean ± SEM (n = 13 cells/differentiation day, 2 replicate studies). C, D Representative immunoblots and quantification of Rab34 levels in white adipose tissue (WAT) samples from mice fed standard (STD) vs. high-fat diet (HFD) (C), and wild-type (WT) vs. ob/ob mice (D). Data are referred to values in control mice (100%), and expressed as mean ± SEM (n = 6). *P < 0.05; **P < 0.01; ***P < 0.001. Scale bar: 10 μm
Fig. 10
Fig. 10
Schematic representation of the proposed trafficking route and mechanisms of action of Rab34 in adipocytes. Rab34 is located at the Golgi apparatus in preadipocytes (1) and transferred to the LD surface upon LD biogenesis. Specifically, Rab34 is transported from the Golgi to ER-related compartments via COPI-mediated retrograde transport pathway (2) and targeted to the LD surface via ERGIC (3a) and/or ERES (3b). Once at the LDs, Rab34 could bind FABP5 (4) and recruit UBA1 (5), which would promote ubiquitination and proteasomal degradation of FABP5 (6). FABP5 clearance from LDs would prevent full activation of phosphorylated HSL (p-HSL) thus reducing lipolysis, which would ultimately result in increased lipid accumulation in LDs. The figure was partly generated using Servier Medical Art, provided by Servier, licensed under a Creative Commons Attribution 3.0 unported license

Similar articles

Cited by

References

    1. Ducharme NA, Bickel PE. Lipid droplets in lipogenesis and lipolysis. Endocrinology. 2008;149:942–949. doi: 10.1210/en.2007-1713. - DOI - PubMed
    1. Rutkowski JM, Stern JH, Scherer PE. The cell biology of fat expansion. J Cell Biol. 2015;208:501–512. doi: 10.1083/jcb.201409063. - DOI - PMC - PubMed
    1. Walther TC, Farese RV. Lipid droplets and cellular lipid metabolism. Annu Rev Biochem. 2012;81:687–714. doi: 10.1146/annurev-biochem-061009-102430. - DOI - PMC - PubMed
    1. Rodríguez A, Ezquerro S, Méndez-Giménez L, et al. Revisiting the adipocyte: a model for integration of cytokine signaling in the regulation of energy metabolism. Am J Physiol Endocrinol Metab. 2015;309:E691–714. doi: 10.1152/ajpendo.00297.2015. - DOI - PubMed
    1. Guilherme A, Virbasius JV, Puri V, et al. Adipocyte dysfunctions linking obesity to insulin resistance and type 2 diabetes. Nat Rev Mol Cell Biol. 2008;9:367–377. doi: 10.1038/nrm2391. - DOI - PMC - PubMed