. 2024 Jan 5;19(1):5.
doi: 10.1186/s13020-023-00876-9.

Combination of mangiferin and T0901317 targeting autophagy promotes cholesterol efflux from macrophage foam cell in atherosclerosis

Affiliations

Combination of mangiferin and T0901317 targeting autophagy promotes cholesterol efflux from macrophage foam cell in atherosclerosis

Qian Chen et al. Chin Med. .

Abstract

Background: The synthetic liver X receptor ligand (LXR) T0901317 (T0) has been reported to attenuate atherosclerosis (AS) without hyperglyceridemia due to innovative drug combination or nano-sized drug delivery. Given the key roles of mangiferin (MGF) in lipid metabolism and atherogenesis, it is critical to investigate progression of atherosclerotic lesion after combined treatment of MGF and T0.

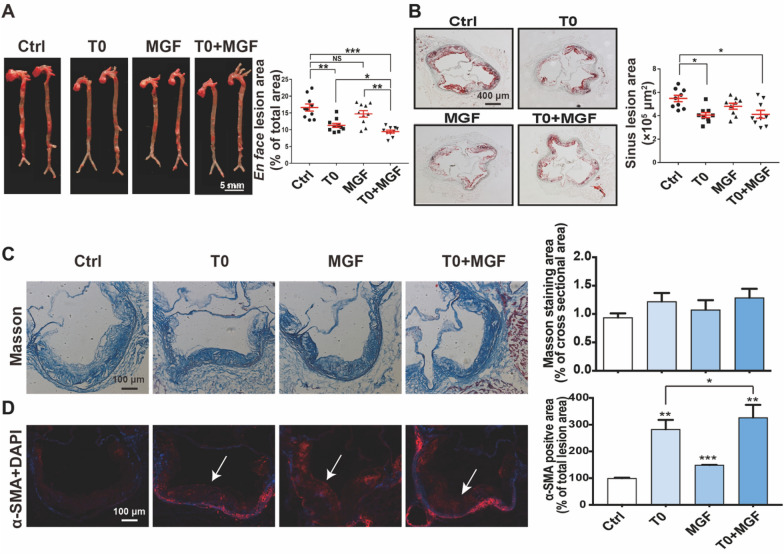
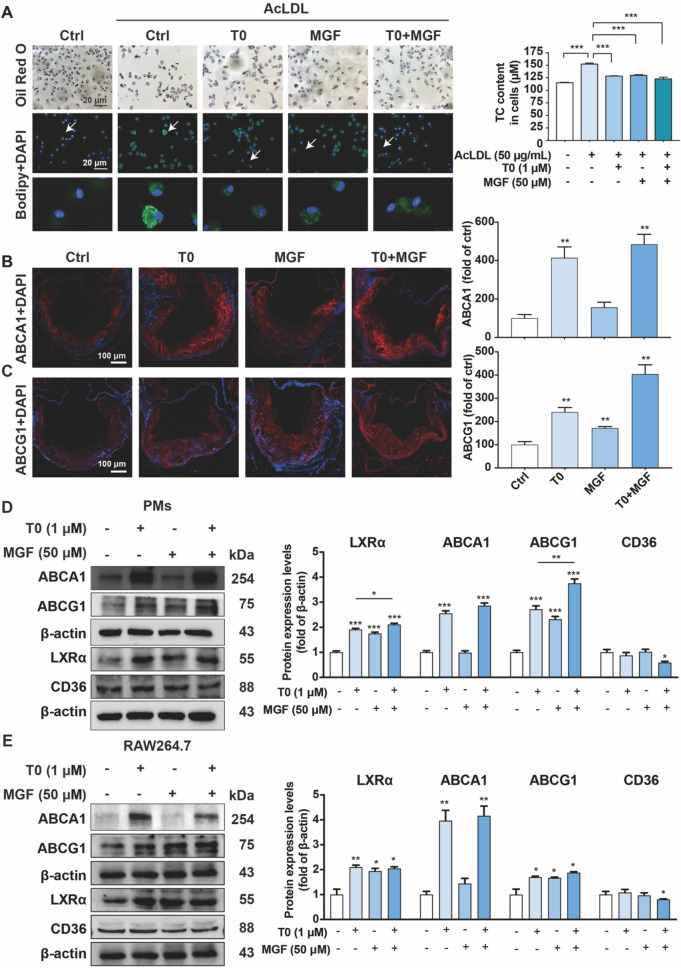
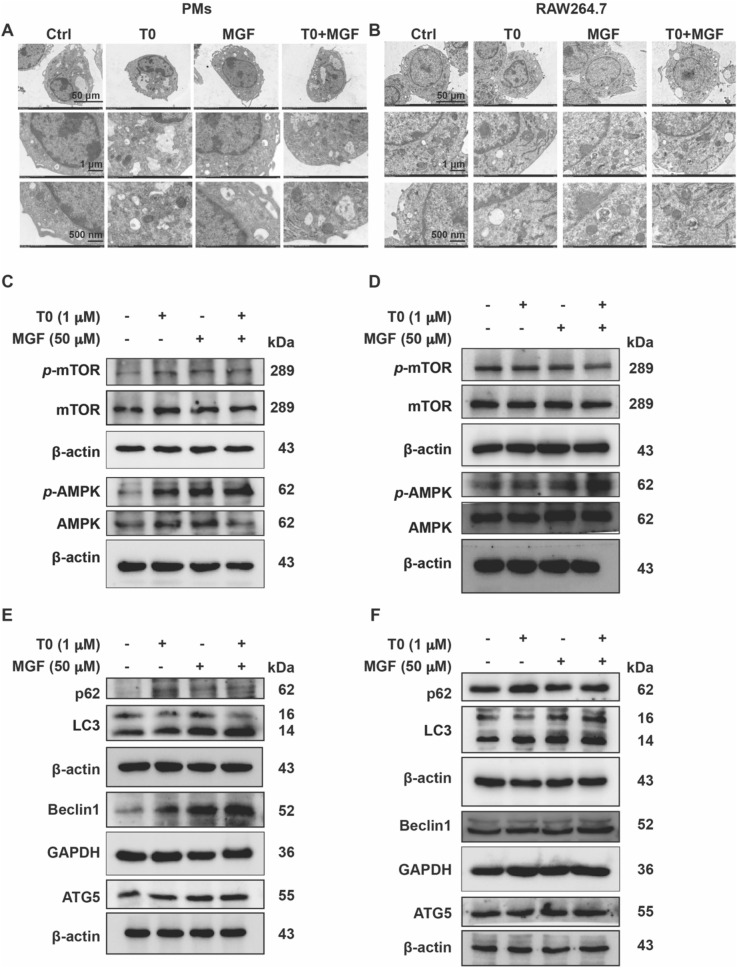
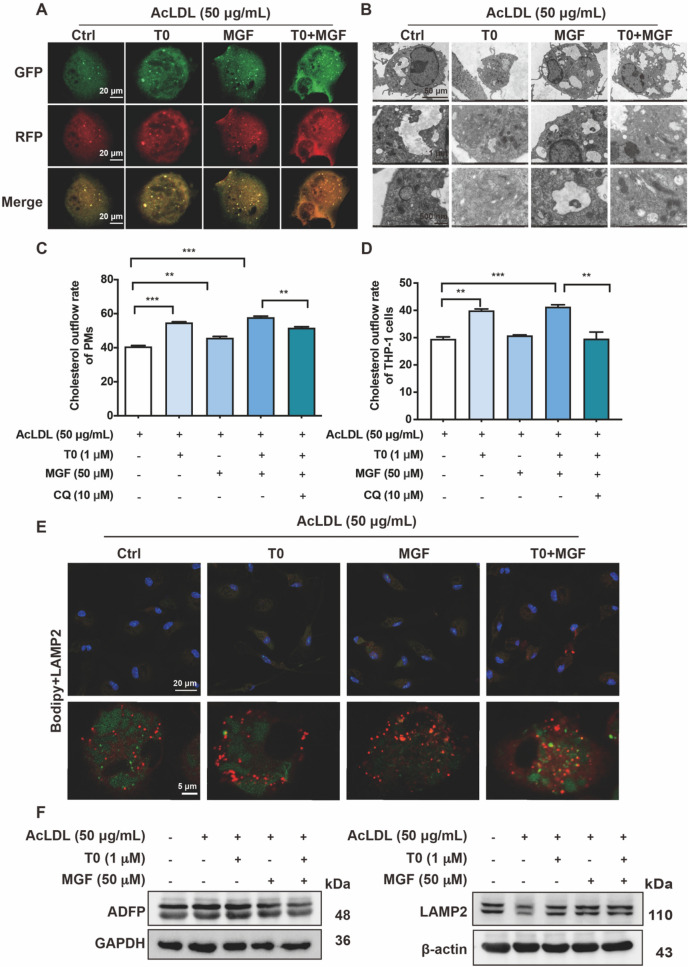
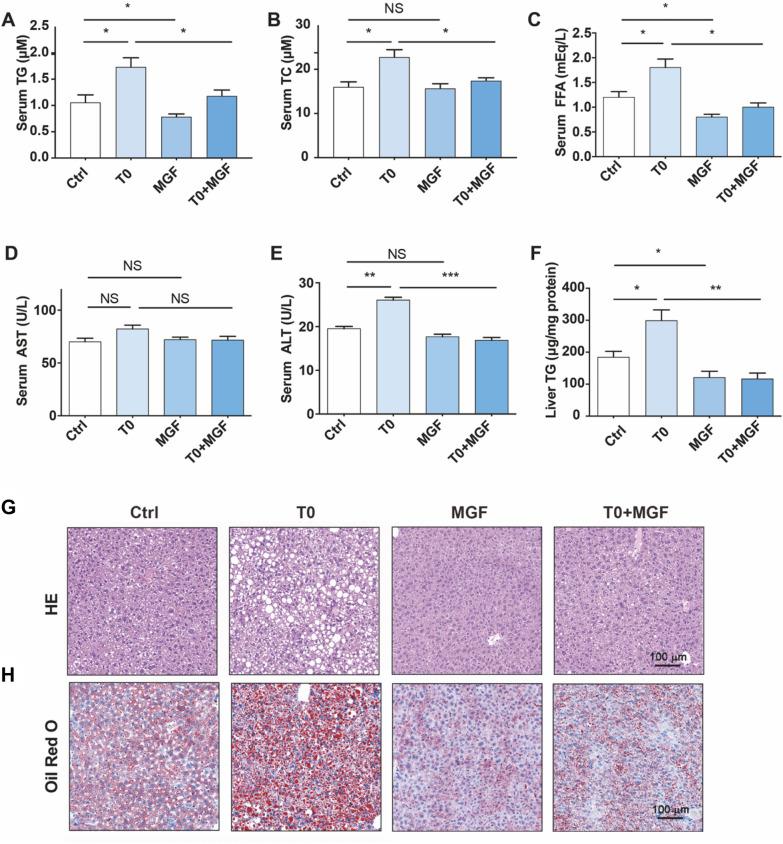
Methods: Atherosclerotic plaque formation and hepatic lipid accumulation were compared in Apoe-/- mice among T0 and/or MGF treatment. The in vitro functions of MGF and T0 were analyzed by Oil-red O staining, cholesterol efflux assay, transmission electron microscopy and western blot analyses with or without acetylated low density lipoprotein.

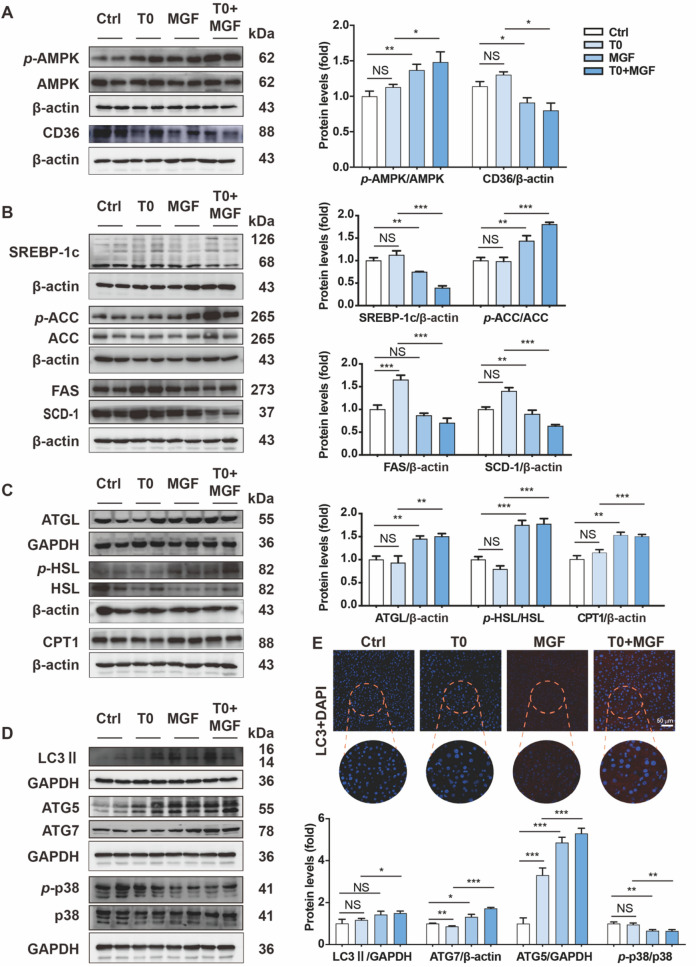
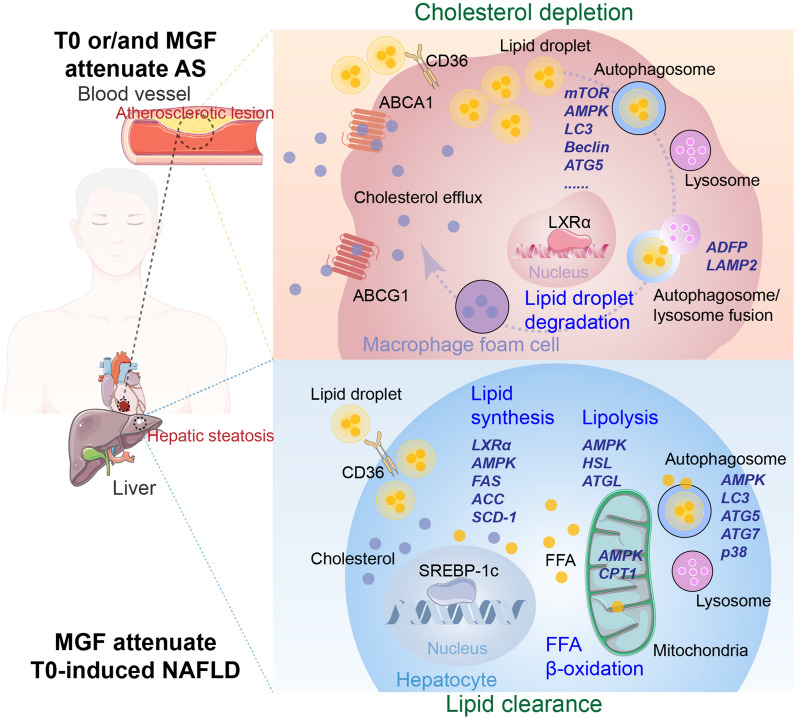
Results: The combination therapy are effective regulators for atherosclerotic plaque formation in Apoe-/- mice, due to upregulation of ABCA1 and ABCG1 induced by LXR activation. Subsequently, we identified autophagy promoted by MGF and T0 treatment establishes a positive feedback loop that increases cholesterol efflux, resulted from LXRα activation. Under atherogenic conditions, the autophagy inhibitor CQ abolished the enhancement effect on cholesterol outflow of MGF and T0. Mechanically, MGF and T0 promotes LXRα and mTOR/AMPK signaling cascade in macrophage, and promotes AMPK signaling cascade in hepatocyte, leading to lipid metabolic homeostasis.

Conclusions: Altogether, our findings reveal that MGF and T0 engages in AS therapy without side effects by activating AMPK-dependent autophagy to promote macrophage cholesterol efflux, and MGF might serve as a natural compound to assist T0 in AS via targeting autophagy.

Keywords: Autophagy; Cholesterol efflux; Macrophage foam cells; Mangiferin; T0901317.


Conflict of interest statement

The authors declare no competing interests.

Figures

Fig. 1
Fig. 1
Effects of mangiferin (MGF) and T0901317 (T0) on inhibition of AS progression. Apoe−/− mice fed with high fat diet (HFD) in four groups (n = 10/group) received the following treatment for 16 weeks. Ctrl: vehicle; T0: oral gavage of T0 (1 mg∙kg−1 bodyweight/day); MGF: oral gavage of MGF (200 mg kg−1 bodyweight/day); T0 + MGF: oral gavage of T0 and MGF. After treatment, aortas were collected for the following assays. A Lesions in en face aorta were determined by Oil Red O staining and lesion areas were expressed as % of total en face aorta areas. Scale bar, 5 mm. ***p < 0.001, **p < 0.01, *p < 0.05, NS: not significant (n = 10). B Sinus lesions in aortic root were determined by Oil Red O staining and lesion areas were expressed as μm2/section. Scale bar, 400 μm. *p < 0.05 (n = 9). C Collagen content areas were determined by Masson staining of aortic root cross sections and quantified by a computer-assisted image analysis protocol (n = 3). Scale bar, 100 μm. D Expression of α-SMA (stained with red fluorescent color) was determined by immunofluorescent staining of aortic root cross sections and quantified by a computer-assisted image analysis protocol. Scale bar, 100 μm. ***p < 0.001, **p < 0.01, *p < 0.05 (n = 3)
Fig. 2
Fig. 2
Treatment of T0 and MGF activates expression of LXR target molecules in macrophage and inhibits foam cell formation. A Peritoneal macrophages collected from mice were stained with Oil Red O or anti-bodipy antibody (green) to evaluate formation of foam cells (> 10 lipid droplets per cell, > 10 fields per sample), scale bar, 20 μm; and cholesterol contents were measured. ***p < 0.001, n = 3. Expression of (B) ABCA1 and (C) ABCG1 (stained with red fluorescent color) was determined by immunofluorescent staining of aortic root cross sections from Apoe−/− mice and quantified by a computer-assisted image analysis protocol. Scale bar, 100 μm. **p < 0.01, n = 3. Expression of ABCA1, ABCG1, LXRα and CD36 in cultured peritoneal macrophages (D) and RAW264.7 cells (E) was determined by western blot with total proteins extracted from cell samples. ***p < 0.001, **p < 0.01, *p < 0.05 (n = 3)
Fig. 3
Fig. 3
Autophagy is implicated in lipid droplet degradation under combined treatment of T0 and MGF. Representative digital images of electron microscopy reveal autophagic vacuoles accumulating in the cytoplasm of peritoneal macrophages (A) and RAW264.7 cells (B). Scale bar, 50 μm, 1 μm, 500 nm. Expression of p-mTOR, mTOR, p-AMPK, and AMPK in peritoneal macrophages (C) and RAW264.7 cells (D) was determined by western blot with total proteins extracted from cell samples. Expression of p62, LC3, Beclin1 and ATG5 in peritoneal macrophages (E) and RAW264.7 cells (F) was determined by western blot with total proteins extracted from cell samples
Fig. 4
Fig. 4
Autophagic flux modulates foam cell cholesterol efflux under combined treatment of T0 and MGF. A Peritoneal macrophages incubated with AcLDL were assayed for the puncta of GFP-LC3 (green)/RFP-LC3 (red) during the early stages of autophagy. Scale bar, 20 μm. B Representative digital images of electron microscopy reveal autophagic vacuoles accumulating in the cytoplasm of peritoneal macrophages treated with AcLDL. Scale bar, 50 μm, 1 μm, 500 nm. Quantitation of cholesterol outflow rate with or without chloroquine (CQ) under combined treatment of T0 and MGF in peritoneal macrophages (C) and human THP-1 macrophage treated with AcLDL (D). E Peritoneal macrophages were stained with bodipy (green) and LAMP2 (red) to identify lipophagy in macrophage foam cells under AcLDL-treated conditions. Scale bar, 20 μm, 5 μm. F Expression of ADFP and LAMP2 in AcLDL-treated peritoneal macrophages was determined by western blot with total proteins extracted from cell samples
Fig. 5
Fig. 5
Treatment of T0 and MGF blocks LXR-induced fatty liver and hyperglyceridemia in Apoe−/− mice. A Serum TG, (B) TC, (C) FFA, (D) AST and (E) ALT levels were analyzed by commercial kits. F Hepatic TG quantitative analysis with total liver lipid extract. ***p < 0.001, **p < 0.01, *p < 0.05 (n = 3). G HE attaining of liver paraffin sections. H Oil Red O staining of liver frozen sections. Scale bar, 100 μm. Ctrl: vehicle; T0: oral gavage of T0 (1 mg kg−1 bodyweight/day); MGF: oral gavage of MGF (200 mg∙kg−1 bodyweight/day); T0 + MGF: oral gavage of T0 and MGF
Fig. 6
Fig. 6
Treatment of T0 and MGF activates AMPK signaling pathway to suppress hepatic lipogenesis and induce autophagy to accelerate hepatic degradation in Apoe−/− mice. A Expression of p-AMPK, AMPK, and CD36 was determined by western blot with total proteins extracted from liver samples of Apoe−/− mice. B Expression of lipid biosynthesis related SREBP-1c, p-ACC, ACC, FAS and SCD-1. C Expression of lipolysis related ATGL, p-HSL and HSL, and β-oxidation relative CPT1. D Expression of autophagy related LC3II, ATG5, ATG7, p-p38 and p38. ***p < 0.001, **p < 0.01, *p < 0.05 (n = 3). E Hepatic red fluorescent LC3 protein was determined by immunofluorescent staining. Scale bar, 50 μm
Fig. 7
Fig. 7
Model for the function of combined treatment of T0 and MGF in the AS related dyslipidemia targeting autophagy in cholesterol efflux from macrophage foam cells. On the one hand, T0 alone or T0 and MGF promote macrophage cholesterol efflux by activating LXRα to augment the expression of ABCA1 and ABCG1 and also enhance lipophagy in atherosclerotic lesion. Of note, in mammalian macrophage foam cells, lipid droplets are tagged for autophagic fusion, possibly beginning with mTOR-AMPK signaling to initiate lipid droplet degradation for further cholesterol depletion. On the other hand, T0-induced hepatic lipid abnormal accumulation is attenuated by MGF. In this scenario, MGF may activate AMPK signaling to suppress lipid synthesis and accelerate lipolysis for β-oxidation of free fatty acid. Alternatively, hepatic lipid droplets may be degraded through autophagy mechanism mediated by AMPK, and relative classical factors LC3, ATGs and p38 to facilitate hepatic lipophagy

Similar articles

Cited by

References

    1. Hwang IC, Kim CH, Kim JY, Choi HM, Yoon YE, Cho GY. Rate of change in 10-year atherosclerotic cardiovascular disease risk and its implications for primary prevention. Hypertension. 2023;80(8):1697–1706. doi: 10.1161/HYPERTENSIONAHA.122.20678. - DOI - PubMed
    1. Neels JG, Gollentz C, Chinetti G. Macrophage death in atherosclerosis: potential role in calcification. Front Immunol. 2023;14:1215612. doi: 10.3389/fimmu.2023.1215612. - DOI - PMC - PubMed
    1. Linton MF, Yancey PG, Tao H, Davies SS. HDL function and atherosclerosis: reactive dicarbonyls as promising targets of therapy. Circ Res. 2023;132(11):1521–1545. doi: 10.1161/CIRCRESAHA.123.321563. - DOI - PMC - PubMed
    1. Tucker B, Ephraums J, King TW, Abburi K, Rye KA, Cochran BJ. Impact of impaired cholesterol homeostasis on neutrophils in atherosclerosis. Arterioscler Thromb Vasc Biol. 2023;43(5):618–627. doi: 10.1161/ATVBAHA.123.316246. - DOI - PubMed
    1. Pownall HJ, Rosales C, Gillard BK, Gotto AM., Jr High-density lipoproteins, reverse cholesterol transport and atherogenesis. Nat Rev Cardiol. 2021;18(10):712–723. doi: 10.1038/s41569-021-00538-z. - DOI - PubMed