

Mechanistic study of the transmission pattern of the SARS-CoV-2 omicron variant
- PMID: 38183172
- PMCID: PMC11059747
- DOI: 10.1002/prot.26663
Mechanistic study of the transmission pattern of the SARS-CoV-2 omicron variant
Abstract
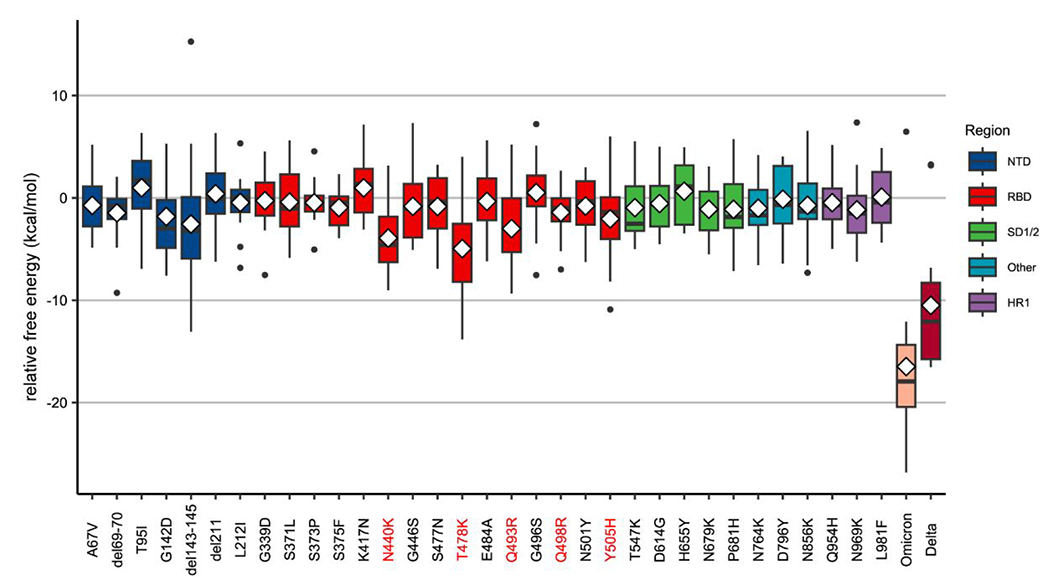
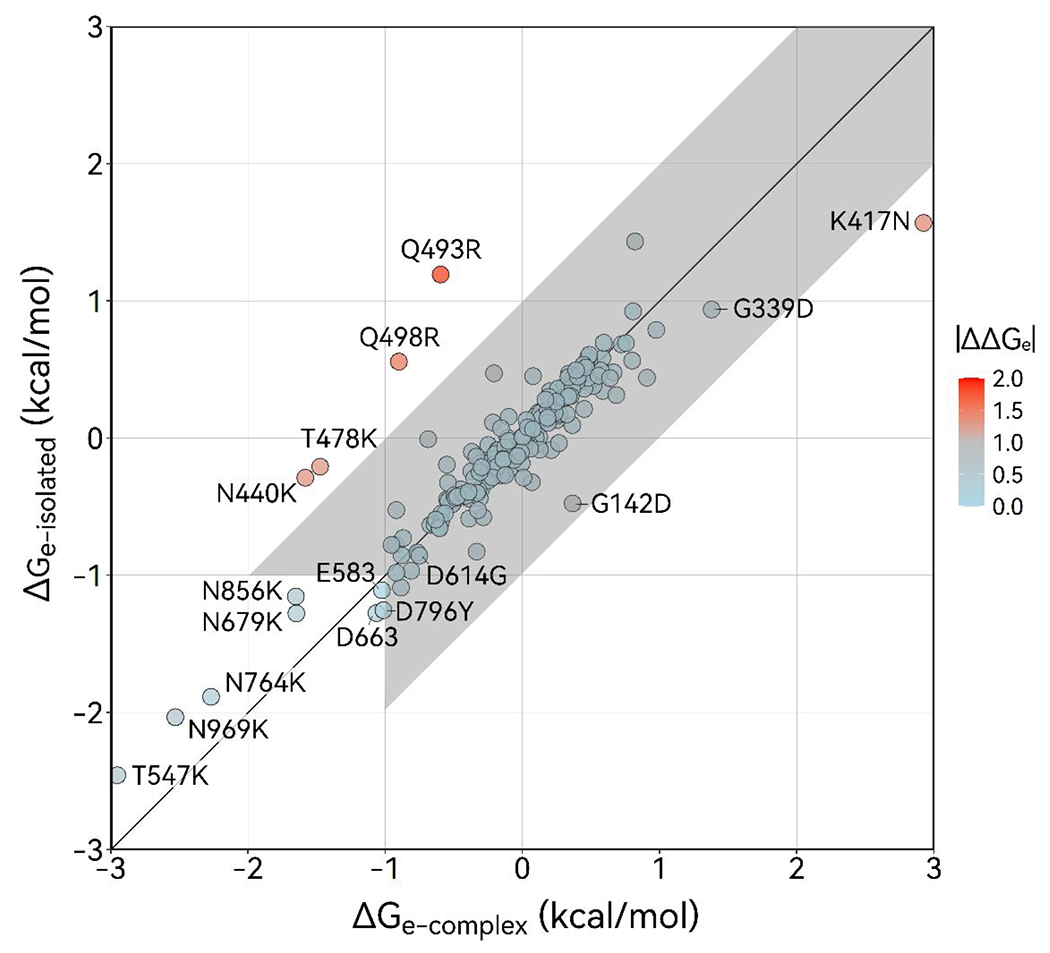
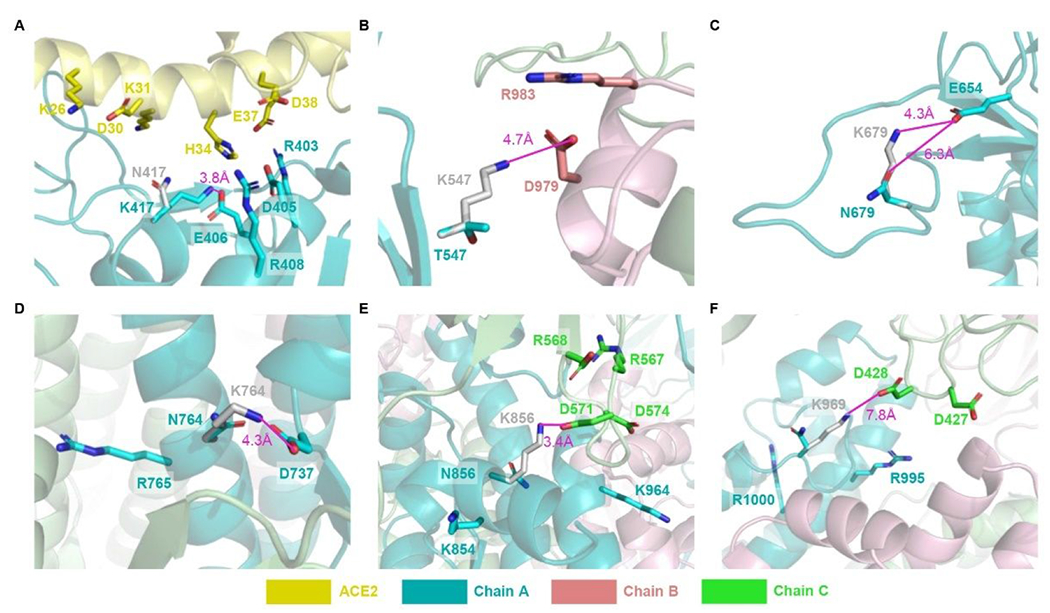
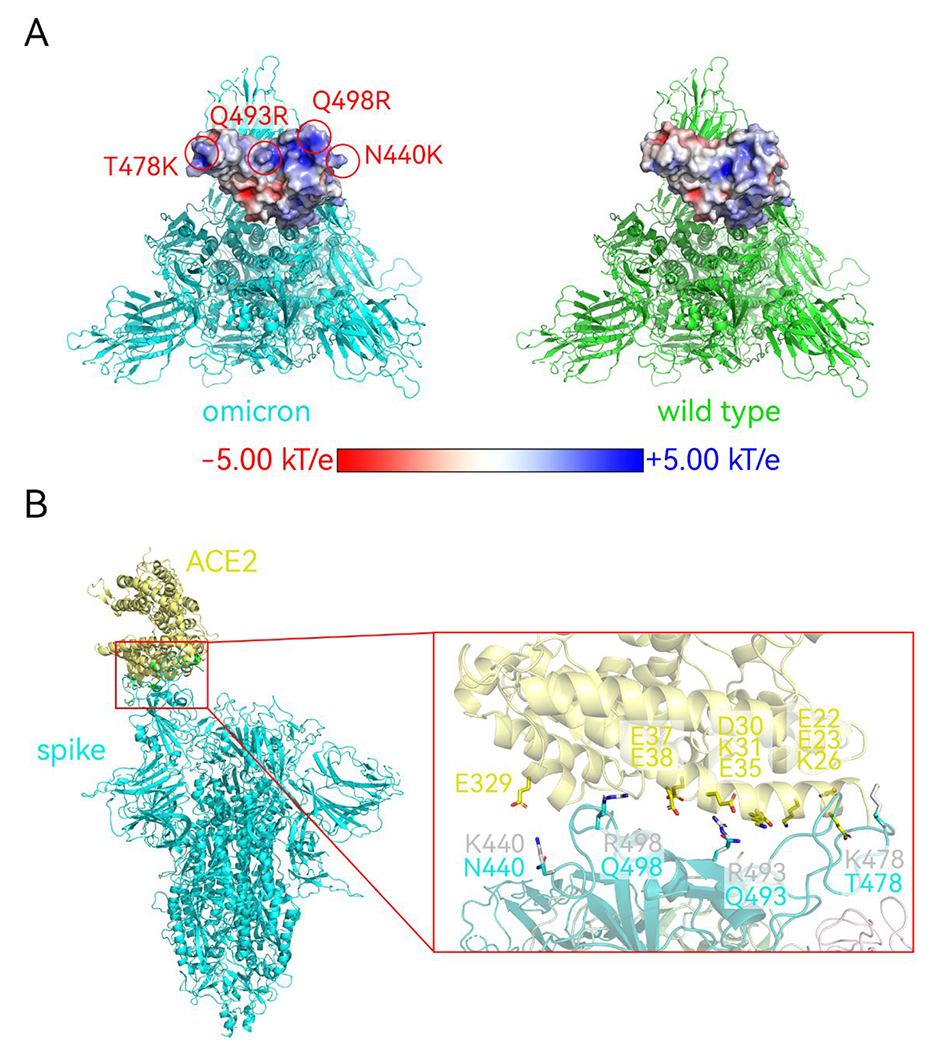
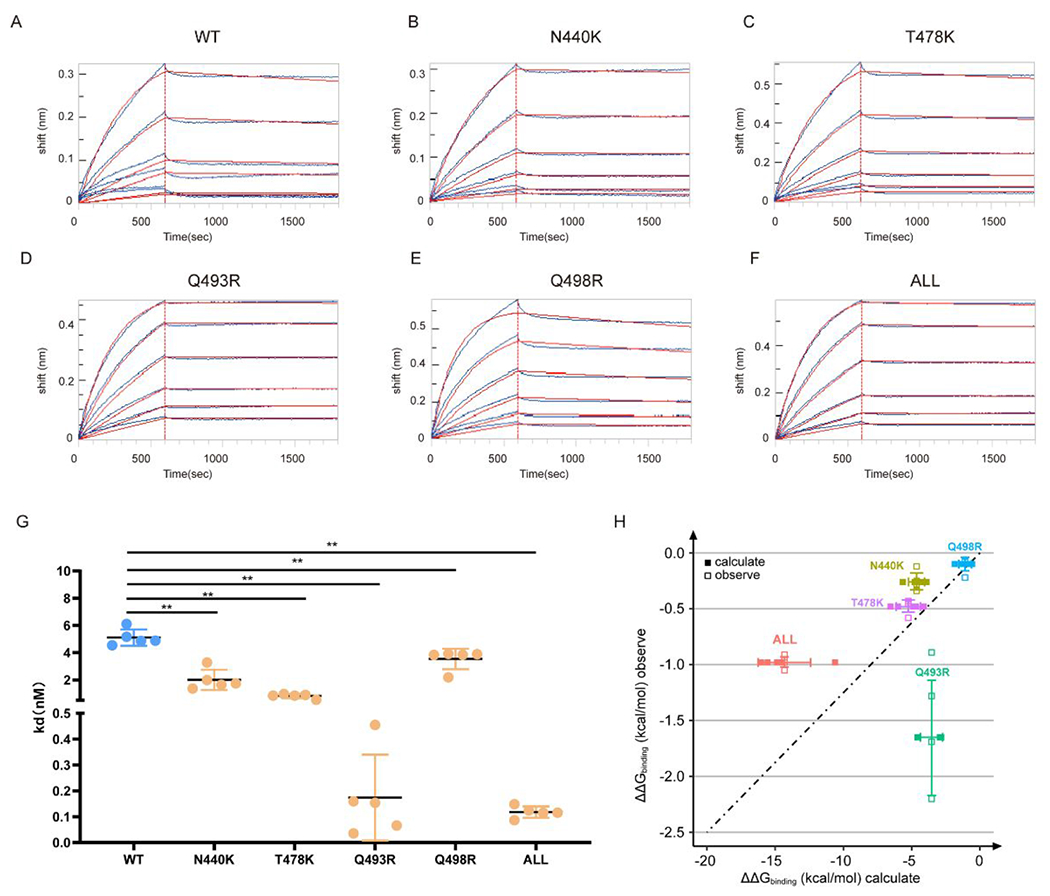
The omicron variant of severe acute respiratory syndrome coronavirus 2 (SARS-CoV-2) characterized by 30 mutations in its spike protein, has rapidly spread worldwide since November 2021, significantly exacerbating the ongoing COVID-19 pandemic. In order to investigate the relationship between these mutations and the variant's high transmissibility, we conducted a systematic analysis of the mutational effect on spike-angiotensin-converting enzyme-2 (ACE2) interactions and explored the structural/energy correlation of key mutations, utilizing a reliable coarse-grained model. Our study extended beyond the receptor-binding domain (RBD) of spike trimer through comprehensive modeling of the full-length spike trimer rather than just the RBD. Our free-energy calculation revealed that the enhanced binding affinity between the spike protein and the ACE2 receptor is correlated with the increased structural stability of the isolated spike protein, thus explaining the omicron variant's heightened transmissibility. The conclusion was supported by our experimental analyses involving the expression and purification of the full-length spike trimer. Furthermore, the energy decomposition analysis established those electrostatic interactions make major contributions to this effect. We categorized the mutations into four groups and established an analytical framework that can be employed in studying future mutations. Additionally, our calculations rationalized the reduced affinity of the omicron variant towards most available therapeutic neutralizing antibodies, when compared with the wild type. By providing concrete experimental data and offering a solid explanation, this study contributes to a better understanding of the relationship between theories and observations and lays the foundation for future investigations.
Keywords: SARS‐CoV‐2; computational biology; omicron; spike protein.
© 2024 The Authors. Proteins: Structure, Function, and Bioinformatics published by Wiley Periodicals LLC.
Figures

Similar articles
-
V367F Mutation in SARS-CoV-2 Spike RBD Emerging during the Early Transmission Phase Enhances Viral Infectivity through Increased Human ACE2 Receptor Binding Affinity.J Virol. 2021 Jul 26;95(16):e0061721. doi: 10.1128/JVI.00617-21. Epub 2021 Jul 26. J Virol. 2021. PMID: 34105996 Free PMC article.
-
Conformational Dynamics and Binding Interactions of SARS-CoV-2 Spike Protein Variants: Omicron, XBB.1.9.2, and EG.5.J Chem Inf Model. 2025 Jul 28;65(14):7651-7667. doi: 10.1021/acs.jcim.5c00308. Epub 2025 Jul 11. J Chem Inf Model. 2025. PMID: 40643983 Free PMC article.
-
Structures of the Omicron spike trimer with ACE2 and an anti-Omicron antibody.Science. 2022 Mar 4;375(6584):1048-1053. doi: 10.1126/science.abn8863. Epub 2022 Feb 8. Science. 2022. PMID: 35133176 Free PMC article.
-
Distinct Conformations of SARS-CoV-2 Omicron Spike Protein and Its Interaction with ACE2 and Antibody.Int J Mol Sci. 2023 Feb 14;24(4):3774. doi: 10.3390/ijms24043774. Int J Mol Sci. 2023. PMID: 36835186 Free PMC article. Review.
-
Structural basis of severe acute respiratory syndrome coronavirus 2 infection.Curr Opin HIV AIDS. 2021 Jan;16(1):74-81. doi: 10.1097/COH.0000000000000658. Curr Opin HIV AIDS. 2021. PMID: 33186231 Review.
Cited by
-
The Diverse Nature of the Molecular Interactions That Govern the COV-2 Variants' Cell Receptor Affinity Ranking and Its Experimental Variability.Int J Mol Sci. 2024 Feb 23;25(5):2585. doi: 10.3390/ijms25052585. Int J Mol Sci. 2024. PMID: 38473831 Free PMC article.
References
Publication types
MeSH terms
Substances
Supplementary concepts
Grants and funding
LinkOut - more resources
Full Text Sources
Medical
Miscellaneous
