. 2024 Jul 1;146(7):071002.
doi: 10.1115/1.4064406.

Mechanical Models of Collagen Networks for Understanding Changes in the Failure Properties of Aging Skin

Affiliations

Mechanical Models of Collagen Networks for Understanding Changes in the Failure Properties of Aging Skin

Nathan J Witt et al. J Biomech Eng. .

Abstract

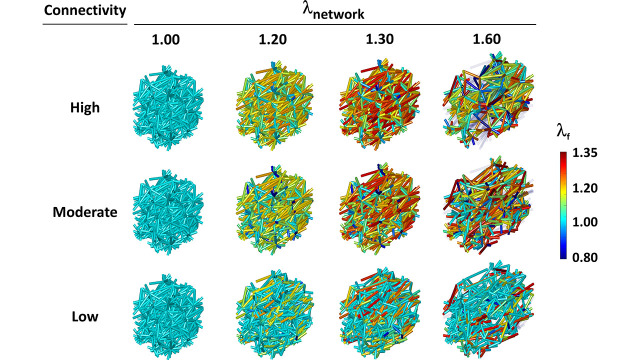
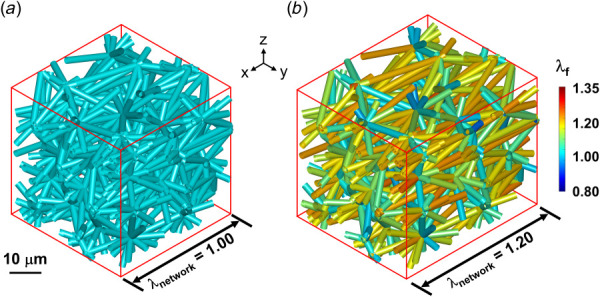
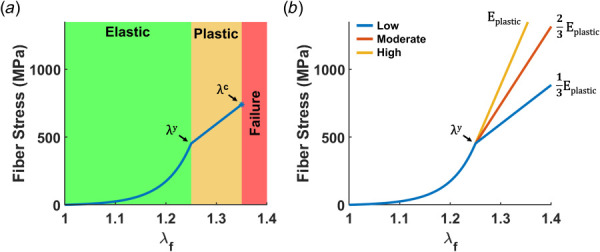
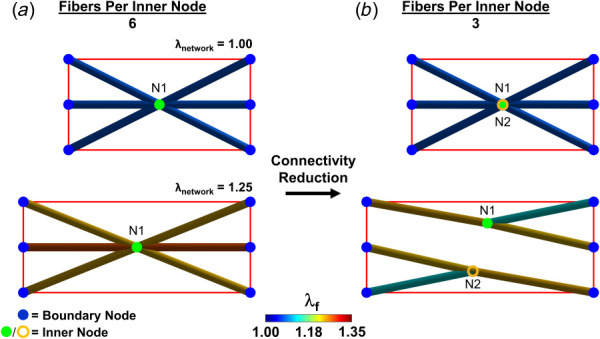
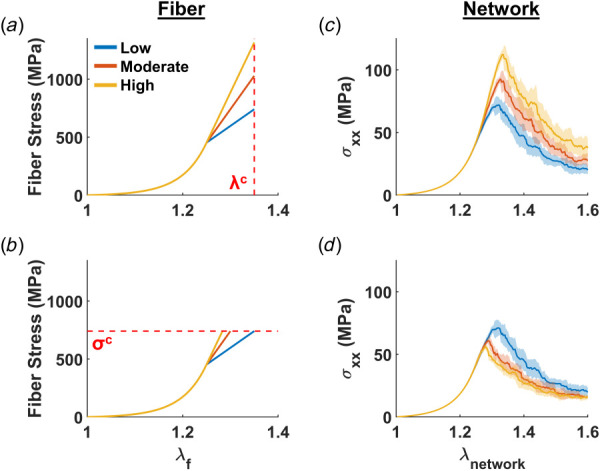
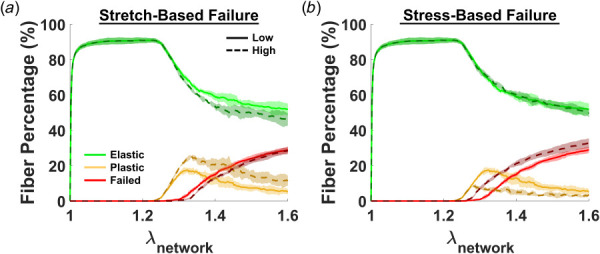
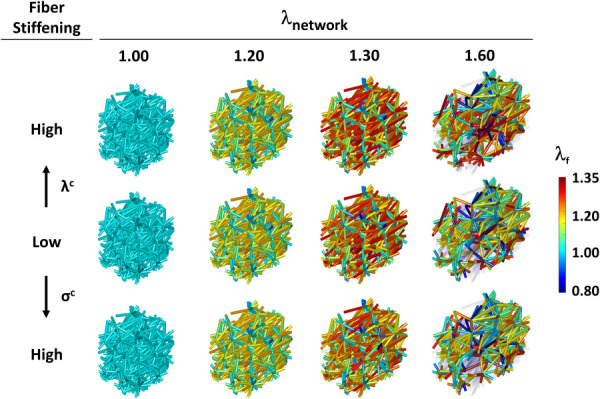
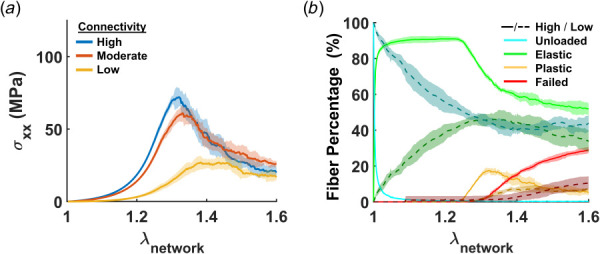
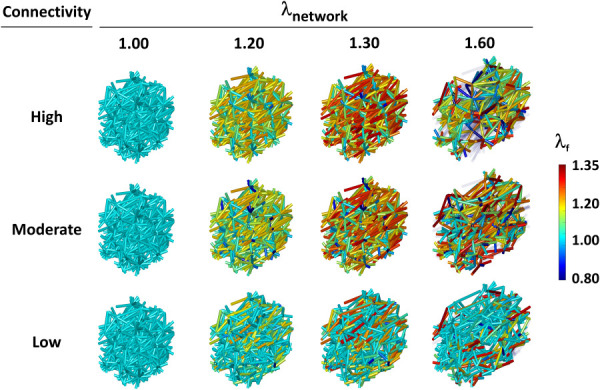
Skin undergoes mechanical alterations due to changes in the composition and structure of the collagenous dermis with aging. Previous studies have conflicting findings, with both increased and decreased stiffness reported for aging skin. The underlying structure-function relationships that drive age-related changes are complex and difficult to study individually. One potential contributor to these variations is the accumulation of nonenzymatic crosslinks within collagen fibers, which affect dermal collagen remodeling and mechanical properties. Specifically, these crosslinks make individual fibers stiffer in their plastic loading region and lead to increased fragmentation of the collagenous network. To better understand the influence of these changes, we investigated the impact of nonenzymatic crosslink changes on the dermal microstructure using discrete fiber networks representative of the dermal microstructure. Our findings suggest that stiffening the plastic region of collagen's mechanical response has minimal effects on network-level stiffness and failure stresses. Conversely, simulating fragmentation through a loss of connectivity substantially reduces network stiffness and failure stress, while increasing stretch ratios at failure.

Keywords: aging; biomechanics; collagen; dermis; fiber networks; multiphoton microscopy; non-affine; tissue damage.


Figures

None
Graphical abstract
Representative collagen fiber network. During loading, the (a) RVE containing a Delaunay fiber network is stretched in the −x direction while the RVE faces normal to the y and z axes plane are fixed. (b)The fibers reorient and stretch to satisfy force equilibrium. The color bar indicates the magnitude of the fiber stretch ratio (λf) for a given network stretch ratio (λnetwork).
Fig. 1
Representative collagen fiber network. During loading, the (a) RVE containing a Delaunay fiber network is stretched in the −x direction while the RVE faces normal to the y and z axes plane are fixed. (b)The fibers reorient and stretch to satisfy force equilibrium. The color bar indicates the magnitude of the fiber stretch ratio (λf) for a given network stretch ratio (λnetwork).
Fiber mechanical response and increase in stiffness with nonenzymatic crosslink accumulation. (a) Fiber stresses increase nonlinearly through loading regions 1 and 2 in the elastic phase. Once the fiber length reaches the yield point, λy, the slope changes and the plastic deformation phase begins. Fibers continue to elongate until either a critical fiber stretch ratio, λc, is reached (depicted), or a critical fiber stress σc is reached (not depicted). (b) For the scenario where nonenzymatic crosslink accumulation represents increased fiber stiffness, the parameter Eplastic was set to 1/3 Eplastic, 2/3 Eplastic, or Eplastic to represent low, medium, and high crosslink accumulation, respectively.
Fig. 2
Fiber mechanical response and increase in stiffness with nonenzymatic crosslink accumulation. (a) Fiber stresses increase nonlinearly through loading regions 1 and 2 in the elastic phase. Once the fiber length reaches the yield point, λy, the slope changes and the plastic deformation phase begins. Fibers continue to elongate until either a critical fiber stretch ratio, λc, is reached (depicted), or a critical fiber stress σc is reached (not depicted). (b) For the scenario where nonenzymatic crosslink accumulation represents increased fiber stiffness, the parameter Eplastic was set to 1/3 Eplastic, 2/3 Eplastic, or Eplastic to represent low, medium, and high crosslink accumulation, respectively.
Simple schematic illustrating the process for decreasing network connectivity independent of other network parameters. (a) A network with six fibers connected to a single inner node, N1, has a fiber connectivity of six. All fibers remain connected at N1 during uniaxial stretching. (b) To simulate fragmentation and a 50% reduction in network connectivity, a coincident node, N2, which shared the same initial coordinates, was added, and the fibers were randomly distributed between these nodes for a connectivity reduction from six to three. The reduction in connectivity alters fiber kinematics and the network mechanical responses while the other properties of the network remain unchanged.
Fig. 3
Simple schematic illustrating the process for decreasing network connectivity independent of other network parameters. (a) A network with six fibers connected to a single inner node, N1, has a fiber connectivity of six. All fibers remain connected at N1 during uniaxial stretching. (b) To simulate fragmentation and a 50% reduction in network connectivity, a coincident node, N2, which shared the same initial coordinates, was added, and the fibers were randomly distributed between these nodes for a connectivity reduction from six to three. The reduction in connectivity alters fiber kinematics and the network mechanical responses while the other properties of the network remain unchanged.
Fiber and network mechanical responses to changes in nonenzymatic fiber stiffening and stretch versus stress failure rules. (a) Fiber-level response to nonenzymatic crosslink induced stiffening past the yield point (λy = 1.25) using a stretch-based fiber failure rule of λc = 1.35 versus (b) a stress-based fiber failure rule of σc = 740 MPa. Note that the failure curves for the baseline case (blue) are equivalent in (a) and (b). The network level response to increased crosslinking for stretch (c) and stress (d) based failure rules. Depicted are the average (solid lines) and standard deviation (shaded regions) for n = 5 networks. (Color version online.)
Fig. 4
Fiber and network mechanical responses to changes in nonenzymatic fiber stiffening and stretch versus stress failure rules. (a) Fiber-level response to nonenzymatic crosslink induced stiffening past the yield point (λy = 1.25) using a stretch-based fiber failure rule of λc = 1.35 versus (b) a stress-based fiber failure rule of σc = 740 MPa. Note that the failure curves for the baseline case (blue) are equivalent in (a) and (b). The network level response to increased crosslinking for stretch (c) and stress (d) based failure rules. Depicted are the average (solid lines) and standard deviation (shaded regions) for n = 5 networks. (Color version online.)
Percentage of network fibers in each loading region for the low and high crosslinked cases. For all cases, approximately 91% of fibers were rapidly recruited into the elastic region, while the remaining fibers were either in compression (8.5%) or unloaded (0.5%). (a) Using a stretch-based failure rule with highly crosslinked fibers (dotted line) resulted in a higher percentage of plastically deformed fibers compared to the baseline low crosslinked case (solid line) common to both failure rules. (b) For a stress-based failure rule with high crosslinking, more fibers failed with failure initiating at a lower network stretch. Note that the moderate case falls between the low and high cases and was omitted for clarity. Depicted are the average (solid lines) and standard deviation (shaded regions) for n = 5 networks.
Fig. 5
Percentage of network fibers in each loading region for the low and high crosslinked cases. For all cases, approximately 91% of fibers were rapidly recruited into the elastic region, while the remaining fibers were either in compression (8.5%) or unloaded (0.5%). (a) Using a stretch-based failure rule with highly crosslinked fibers (dotted line) resulted in a higher percentage of plastically deformed fibers compared to the baseline low crosslinked case (solid line) common to both failure rules. (b) For a stress-based failure rule with high crosslinking, more fibers failed with failure initiating at a lower network stretch. Note that the moderate case falls between the low and high cases and was omitted for clarity. Depicted are the average (solid lines) and standard deviation (shaded regions) for n = 5 networks.
Representative network kinematics in response to fiber stiffening in the plastic region for stretch and stress-based failure rules. Network kinematics for high fiber stiffening (i.e., high crosslinking) cases with stretch (λc) or stress-based (σc) failure rules were identical to the baseline low fiber stiffening (low crosslinking, middle row) until the network stretch ratio (λnetwork) exceeded 1.25. In all networks, fibers realigned toward the direction of loading, deformed elastically, and then plastically until failing (transparent fibers) depending on which fiber failure rule was invoked. Videos for each case are included in supplementary movies 1, 3, and 6 of the Supplemental Materials on the ASME Digital Collection.
Fig. 6
Representative network kinematics in response to fiber stiffening in the plastic region for stretch and stress-based failure rules. Network kinematics for high fiber stiffening (i.e., high crosslinking) cases with stretch (λc) or stress-based (σc) failure rules were identical to the baseline low fiber stiffening (low crosslinking, middle row) until the network stretch ratio (λnetwork) exceeded 1.25. In all networks, fibers realigned toward the direction of loading, deformed elastically, and then plastically until failing (transparent fibers) depending on which fiber failure rule was invoked. Videos for each case are included in supplementary movies 1, 3, and 6 of the Supplemental Materials on the ASME Digital Collection.
Changes in network behavior due to reduced network connectivity. (a) Lower connectivity reduced network stiffness and ultimate failure stress and increased the corresponding failure stretches. (b) The percentage of fibers in each loading region was impacted by network connectivity, including the percentage of unloaded fibers (blue). Compared to highly connected networks (solid lines), low connectivity networks (dashed lines) experienced a slower rate of fiber recruitment into the elastic region due to the large number of unloaded fibers that were retained throughout the simulation. Depicted are the average (solid lines) and standard deviation (shaded regions) for n = 5 networks. (Color version online.)
Fig. 7
Changes in network behavior due to reduced network connectivity. (a) Lower connectivity reduced network stiffness and ultimate failure stress and increased the corresponding failure stretches. (b) The percentage of fibers in each loading region was impacted by network connectivity, including the percentage of unloaded fibers (blue). Compared to highly connected networks (solid lines), low connectivity networks (dashed lines) experienced a slower rate of fiber recruitment into the elastic region due to the large number of unloaded fibers that were retained throughout the simulation. Depicted are the average (solid lines) and standard deviation (shaded regions) for n = 5 networks. (Color version online.)
Representative network kinematics in response to a reduction in connectivity with greater nonenzymatic crosslinking. Representative network simulations for networks with high, moderate, and low connectivity cases demonstrated fiber realignment into the direction of loading and fiber failure after network stretches (λnetwork) exceeded 1.30. In comparison, low connectivity networks simulating fragmentation with high nonenzymatic crosslinking experienced less fiber recruitment throughout the simulation. At λnetwork = 1.60, a large percentage of fibers remained unrecruited or much less so compared to high and moderate connectivity cases due to fewer stress bearing pathways within the network. Videos for each case are included in supplementary movies 7–9 of the Supplemental Materials on the ASME Digital Collection.
Fig. 8
Representative network kinematics in response to a reduction in connectivity with greater nonenzymatic crosslinking. Representative network simulations for networks with high, moderate, and low connectivity cases demonstrated fiber realignment into the direction of loading and fiber failure after network stretches (λnetwork) exceeded 1.30. In comparison, low connectivity networks simulating fragmentation with high nonenzymatic crosslinking experienced less fiber recruitment throughout the simulation. At λnetwork = 1.60, a large percentage of fibers remained unrecruited or much less so compared to high and moderate connectivity cases due to fewer stress bearing pathways within the network. Videos for each case are included in supplementary movies 7–9 of the Supplemental Materials on the ASME Digital Collection.

Similar articles

Cited by

References

    1. Kanitakis, J. , 2002, “ Anatomy, Histology and Immunohistochemistry of Normal Human Skin,” Eur. J. Dermatol., 12(4), pp. 390–400.https://pubmed.ncbi.nlm.nih.gov/12095893/ - PubMed
    1. Blair, M. J. , Jones, J. D. , Woessner, A. E. , and Quinn, K. P. , 2020, “ Skin Structure-Function Relationships and the Wound Healing Response to Intrinsic Aging,” Adv. Wound Care, 9(3), pp. 127–143. 10.1089/wound.2019.1021 - DOI - PMC - PubMed
    1. Sen, C. K. , Gordillo, G. M. , Roy, S. , Kirsner, R. , Lambert, L. , Hunt, T. K. , Gottrup, F. , Gurtner, G. C. , and Longaker, M. T. , 2009, “ Human Skin Wounds: A Major and Snowballing Threat to Public Health and the Economy,” Wound Repair Regener., 17(6), pp. 763–771. 10.1111/j.1524-475X.2009.00543.x - DOI - PMC - PubMed
    1. Krieg, T. , and Aumailley, M. , 2011, “ The Extracellular Matrix of the Dermis: Flexible Structures With Dynamic Functions,” Exp. Dermatol., 20(8), pp. 689–695. 10.1111/j.1600-0625.2011.01313.x - DOI - PubMed
    1. Albanna, M. Z. , and Holmes, J. H. , 2016, Skin Tissue Engineering and Regenerative Medicine, Elsevier/AP, Academic Press is an Imprint of Elsevier, London; San Diego, CA, p. 443.

Publication types