. 2024 Mar;20(3):2000-2015.
doi: 10.1002/alz.13676. Epub 2024 Jan 6.

A blood-based multi-pathway biomarker assay for early detection and staging of Alzheimer's disease across ethnic groups

Affiliations

A blood-based multi-pathway biomarker assay for early detection and staging of Alzheimer's disease across ethnic groups

Yuanbing Jiang et al. Alzheimers Dement. 2024 Mar.

Abstract

Introduction: Existing blood-based biomarkers for Alzheimer's disease (AD) mainly focus on its pathological features. However, studies on blood-based biomarkers associated with other biological processes for a comprehensive evaluation of AD status are limited.

Methods: We developed a blood-based, multiplex biomarker assay for AD that measures the levels of 21 proteins involved in multiple biological pathways. We evaluated the assay's performance for classifying AD and indicating AD-related endophenotypes in three independent cohorts from Chinese or European-descent populations.

Results: The 21-protein assay accurately classified AD (area under the receiver operating characteristic curve [AUC] = 0.9407 to 0.9867) and mild cognitive impairment (MCI; AUC = 0.8434 to 0.8945) while also indicating brain amyloid pathology. Moreover, the assay simultaneously evaluated the changes of five biological processes in individuals and revealed the ethnic-specific dysregulations of biological processes upon AD progression.

Discussion: This study demonstrated the utility of a blood-based, multi-pathway biomarker assay for early screening and staging of AD, providing insights for patient stratification and precision medicine.

Highlights: The authors developed a blood-based biomarker assay for Alzheimer's disease. The 21-protein assay classifies AD/MCI and indicates brain amyloid pathology. The 21-protein assay can simultaneously assess activities of five biological processes. Ethnic-specific dysregulations of biological processes in AD were revealed.

Keywords: Alzheimer's disease; amyloid pathology; blood biomarkers; disease staging; early detection; patient stratification; precision medicine.


Conflict of interest statement

Yuanbing Jiang, Fanny C. Ip, Amy K. Y. Fu, and Nancy Y. Ip are inventors of the related technology licensed to Cognitact. Yuanbing Jiang and Fanny C. Ip are co‐founders, and Li Ouyang is a current staff member of Cognitact. John Hardy has served as a consultant for Eli Lilly and Eisai. Albert Puig‐Pijoan has served on advisory boards for Schwabe Farma Ibérica. Marc Suárez‐Calvet has served as a consultant and on advisory boards for Roche Diagnostics International Ltd. and has given lectures in symposia sponsored by Roche Diagnostics, S.L.U. and Roche Farma, S.A. Henrik Zetterberg has served on scientific advisory boards and/or as a consultant for AbbVie, Acumen, Alector, Alzinova, ALZPath, Annexon, Apellis, Artery Therapeutics, AZTherapies, CogRx, Denali, Eisai, NervGen, Novo Nordisk, Passage Bio, Pinteon Therapeutics, Prothena, Red Abbey Labs, reMYND, Roche, Samumed, Siemens Healthineers, Triplet Therapeutics, and Wave; has given lectures in symposia sponsored by Cellectricon, Fujirebio, AlzeCure, Biogen, and Roche; and is a co‐founder of Brain Biomarker Solutions in Gothenburg AB (BBS), which is a part of the GU Ventures Incubator Program (outside of the submitted work). All other authors declare no conflicts of interest. Author disclosures are available in the Supporting Information S2.

Figures

FIGURE 1
FIGURE 1
Associations between the levels of 21 plasma proteins and Alzheimer's disease (AD), mild cognitive impairment (MCI), and related endophenotypes. Heatmap showing the associations between the levels of 21 plasma proteins and AD, MCI, and related endophenotypes, including blood protein biomarker levels, cognitive performance, gray matter volume, and hippocampal volume (see Tables S2‐S4 for details). Color intensity is proportional to the normalized effect size (β). Red and blue indicate positive (β > 0) and negative (β < 0) associations, respectively. Aβ, amyloid beta; CN, cognitively normal individuals; FDR, false discovery rate; MoCA, Montreal Cognitive Assessment; NfL, neurofilament light polypeptide; p‐Tau, phosphorylated tau. *FDR < 0.05, ** FDR < 0.01, *** FDR < 0.001.
FIGURE 2
FIGURE 2
Development of the 21‐protein biomarker assay and scoring system for the classification of Alzheimer's disease (AD) and mild cognitive impairment (MCI). (A) Schematic showing the calculation of AD risk scores for individuals based on the 21‐protein biomarker assay. (B) Boxplot showing the individual AD risk scores in Hong Kong Chinese cohort_1 stratified by diagnosis (n = 317, 190, and 493 cognitively normal [CN] individuals, patients with MCI, and patients with AD, respectively; β = 36.72, 61.41, and 24.69 for MCI vs CN, AD vs CN, and AD vs MCI, respectively). (C,D) Receiver operating characteristic (ROC) curves showing the performance of the 21‐protein biomarker panel and existing AD‐associated blood biomarkers (ie, beta‐amyloid [Aβ]42/40 ratio, neurofilament light polypeptide [NfL], and phosphorylated tau [p‐Tau]181) for distinguishing patients with AD (C), or MCI (D), from CN individuals. Numbers in brackets indicate the area under the ROC (AUC), which indicate the model's performance in the corresponding classification. (E) Distribution of AD risk scores stratified by diagnosis. AD risk levels were categorized according to the distribution of AD risk scores: low risk, <32; moderate risk, 32 to 72; high risk, >72. (F) Individual cognitive performance indicated by Montreal Cognitive Assessment (MoCA) scores stratified by designated AD risk level (n = 337, 272, and 391 for low, moderate, and high risk, respectively; β = −5.715, −9.369, and −3.654 for moderate vs low risk, high vs low risk, and high vs moderate risk, respectively). (G) Individual hippocampal volumes stratified by designated AD risk level (n = 53, 14, and 36 for low, moderate, and high risk, respectively; β = −0.047, −0.080, and −0.033 for moderate vs low risk, high vs low risk, and high vs moderate risk, respectively). ICV, intracranial volume. Data in box‐and‐whisker plots include maximum, median, and minimum values as well as 25th and 75th percentiles; plus signs denote mean values. *p < 0.05, **p < 0.01, ***p < 0.001.
FIGURE 3
FIGURE 3
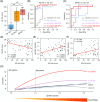
The 21‐protein biomarker assay accurately classifies Alzheimer's disease (AD) and amyloid pathology in an independent Hong Kong Chinese cohort. (A) Boxplot showing the individual AD risk scores in Hong Kong Chinese cohort_2 stratified by diagnosis (n = 9 beta‐amyloid [Aβ]− cognitively normal [CN] individuals, 13 Aβ+ patients with mild cognitive impairment [MCI], and 25 Aβ+ patients with AD; β = 47.18, 63.66, and 16.47 for Aβ+MCI vs Aβ−CN, Aβ+AD vs Aβ−CN, and Aβ+AD vs Aβ+MCI, respectively). Data in box‐and‐whisker plots include maximum, median, and minimum values as well as 25th and 75th percentiles; plus signs denote mean values. (B,C) Receiver operating characteristic (ROC) curves showing the performance of the 21‐protein biomarker panel and existing AD‐associated blood biomarkers (ie, plasma Aβ42/40 ratio, neurofilament light polypeptide [NfL], and phosphorylated tau [p‐Tau]181) for differentiating patients with Aβ+AD (B), and Aβ+MCI (C), from Aβ−CN individuals. (D–F) Correlations between individual AD risk scores and AD‐related endophenotypes, including cognitive performance indicated by Montreal Cognitive Assessment (MoCA) score (D), Aβ pathology in the brain indicated by amyloid‐PET in global cortical regions (E), and tau pathology in the brain indicated by tau‐positron emission tomography [PET] in global cortical regions (F). (G) Correlations between the progression of Aβ pathology in the brain and AD risk scores, AD‐associated blood biomarkers, and cognitive performance indicated by MoCA score. r2 , Pearson's correlation coefficient; SUVR, standardized uptake value ratio; |z‐scores|, absolute values of z‐scores. *p < 0.05, **p < 0.01, ***p < 0.001.
FIGURE 4
FIGURE 4
The 21‐protein biomarker assay accurately classifies Alzheimer's disease (AD) and amyloid pathology in a population of European descent. (A) Boxplot showing the AD risk scores of individuals in the Spanish BIODEGMAR cohort stratified by diagnosis (n = 20 beta‐amyloid [Aβ]− cognitively normal [CN] individuals, 68 Aβ+ patients with mild cognitive impairment [MCI], and 129 Aβ+ patients with AD; β = 40.25, 51.59, and 11.34 for Aβ+MCI vs Aβ−CN, Aβ+AD vs Aβ−CN, and Aβ+AD vs Aβ+MCI, respectively). Data in box‐and‐whisker plots include maximum, median, and minimum values as well as 25th and 75th percentiles; plus signs denote mean values. (B,C) Receiver operating characteristic (ROC) curves showing the performance of the 21‐protein biomarker panel for differentiating patients with Aβ+AD (B), and Aβ+MCI (C), from Aβ−CN individuals. (D–F) Correlations between AD risk scores and AD‐related endophenotypes of individuals, including cognitive performance indicated by Mini‐Mental State Examination (MMSE) score (D), Aβ pathology in the brain indicated by cerebrospinal fluid (CSF) Aβ42/40 ratio (E), and neurodegeneration in the brain indicated by CSF t‐Tau levels (F). (G) Correlations between the progression of Aβ pathology in the brain and AD risk score and cognitive performance indicated by MMSE score. r2 , Pearson's correlation coefficient; |z‐scores|, absolute values of z‐scores. *p < 0.05, **p < 0.01, ***p < 0.001.
FIGURE 5
FIGURE 5
Dysregulation of different biological processes in Alzheimer's disease and mild cognitive impairment between populations of Chinese and European descent. Average scores (A,C) and relative changes compared to cognitively normal (CN) individuals (B,D) of five biological processes (ie, neurodegeneration, inflammation, innate immunity, vascular functions, and metabolic activities) in beta‐amyloid (Aβ)‐negative CN individuals (Aβ−CN), Aβ‐positive patients with mild cognitive impairment (Aβ+MCI), and Aβ‐positive patients with Alzheimer's disease (Aβ+AD) in Hong Kong Chinese cohort_2 (A,B), as well as Aβ−CN, Aβ+MCI, and Aβ+AD individuals in the Spanish BIODEGMAR cohort (C,D). The biological processes that are significantly dysregulated in patients with Aβ+MCI or Aβ+AD compared to Aβ−CN individuals are indicated in red. Immunity, innate immunity; Metabolic, metabolic activities; Vascular, vascular functions.

References

    1. Van Dyck CH, Swanson CJ, Aisen P, et al. Lecanemab in early Alzheimer's disease. N Engl J Med. 2023;388:9‐21. - PubMed
    1. Mintun MA, Lo AC, Duggan Evans C, et al. Donanemab in early Alzheimer's disease. N Engl J Med. 2021;384:1691‐1704. - PubMed
    1. Mummery CJ, Börjesson‐Hanson A, Blackburn DJ, et al. Tau‐targeting antisense oligonucleotide MAPTRx in mild Alzheimer's disease: a phase 1b, randomized, placebo‐controlled trial. Nat Med. 2023;29:1437‐1447. - PMC - PubMed
    1. Sims JR, Zimmer JA, Evans CD, et al. Donanemab in early symptomatic Alzheimer disease: the TRAILBLAZER‐ALZ 2 randomized clinical trial. JAMA. 2023;330(6):512‐527. - PMC - PubMed
    1. Karikari TK, Pascoal TA, Ashton NJ, et al. Blood phosphorylated tau 181 as a biomarker for Alzheimer's disease: a diagnostic performance and prediction modelling study using data from four prospective cohorts. Lancet Neurol. 2020;19:422‐433. - PubMed

Publication types