

N-Nitrosodimethylamine investigations in Muta™Mouse define point-of-departure values and demonstrate less-than-additive somatic mutant frequency accumulations
- PMID: 38183622
- PMCID: PMC10928842
- DOI: 10.1093/mutage/geae001
N-Nitrosodimethylamine investigations in Muta™Mouse define point-of-departure values and demonstrate less-than-additive somatic mutant frequency accumulations
Abstract
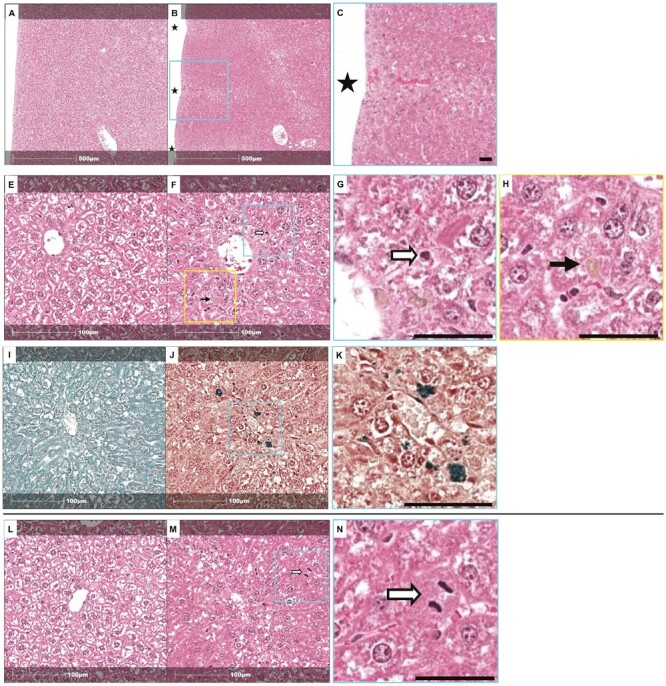
The N-nitrosamine, N-nitrosodimethylamine (NDMA), is an environmental mutagen and rodent carcinogen. Small levels of NDMA have been identified as an impurity in some commonly used drugs, resulting in several product recalls. In this study, NDMA was evaluated in an OECD TG-488 compliant Muta™Mouse gene mutation assay (28-day oral dosing across seven daily doses of 0.02-4 mg/kg/day) using an integrated design that assessed mutation at the transgenic lacZ locus in various tissues and at the endogenous Pig-a gene-locus, along with micronucleus frequencies in peripheral blood. Liver pathology was determined together with NDMA exposure in blood and liver. The additivity of mutation induction was assessed by including two acute single-dose treatment groups (i.e. 5 and 10 mg/kg dose on Day 1), which represented the same total dose as two of the repeat dose treatment groups. NDMA did not induce statistically significant increases in mean lacZ mutant frequency (MF) in bone marrow, spleen, bladder, or stomach, nor in peripheral blood (Pig-a mutation or micronucleus induction) when tested up to 4 mg/kg/day. There were dose-dependent increases in mean lacZ MF in the liver, lung, and kidney following 28-day repeat dosing or in the liver and kidney after a single dose (10 mg/kg). No observed genotoxic effect levels (NOGEL) were determined for the positive repeat dose-response relationships. Mutagenicity did not exhibit simple additivity in the liver since there was a reduction in MF following NDMA repeat dosing compared with acute dosing for the same total dose. Benchmark dose modelling was used to estimate point of departure doses for NDMA mutagenicity in Muta™Mouse and rank order target organ tissue sensitivity (liver > kidney or lung). The BMD50 value for liver was 0.32 mg/kg/day following repeat dosing (confidence interval 0.21-0.46 mg/kg/day). In addition, liver toxicity was observed at doses of ≥ 1.1 mg/kg/day NDMA and correlated with systemic and target organ exposure. The integration of these results and their implications for risk assessment are discussed.
Keywords: Benchmark dose modelling; Muta™Mouse gene mutation assay; N-Nitrosodimethylamine; N-nitrosamine; point of departure.
© The Author(s) 2024. Published by Oxford University Press on behalf of the UK Environmental Mutagen Society.
Conflict of interest statement
The authors are (or were at the time of study conduct) employees of GSK.
Figures


Similar articles
-
Quantitative dose-response analysis of ethyl methanesulfonate genotoxicity in adult gpt-delta transgenic mice.Environ Mol Mutagen. 2014 Jun;55(5):385-99. doi: 10.1002/em.21854. Epub 2014 Feb 17. Environ Mol Mutagen. 2014. PMID: 24535894
-
Simultaneous measurement of benzo[a]pyrene-induced Pig-a and lacZ mutations, micronuclei and DNA adducts in Muta™ Mouse.Environ Mol Mutagen. 2011 Dec;52(9):756-65. doi: 10.1002/em.20688. Epub 2011 Oct 4. Environ Mol Mutagen. 2011. PMID: 21976233 Free PMC article.
-
Comparing BMD-derived genotoxic potency estimations across variants of the transgenic rodent gene mutation assay.Environ Mol Mutagen. 2017 Dec;58(9):632-643. doi: 10.1002/em.22137. Epub 2017 Sep 25. Environ Mol Mutagen. 2017. PMID: 28945287 Free PMC article.
-
DNA adducts, mutant frequencies and mutation spectra in lambda lacZ transgenic mice treated with N-nitrosodimethylamine.Carcinogenesis. 1998 May;19(5):731-9. doi: 10.1093/carcin/19.5.731. Carcinogenesis. 1998. PMID: 9635857
-
Risk characterization of N-nitrosodimethylamine in pharmaceuticals.Food Chem Toxicol. 2024 Apr;186:114498. doi: 10.1016/j.fct.2024.114498. Epub 2024 Feb 9. Food Chem Toxicol. 2024. PMID: 38341171 Review.
Cited by
-
Quantitative genotoxicity assessment of N-nitrosodimethylamine in mice by error-corrected next-generation sequencing and DNA methylation quantification for toxicity threshold determination.Arch Toxicol. 2025 Aug 24. doi: 10.1007/s00204-025-04166-1. Online ahead of print. Arch Toxicol. 2025. PMID: 40849524
-
Transgenerational Reproductive and Developmental Toxicity Induced by N-Nitrosodimethylamine and Its Metabolite Formaldehyde in Drosophila melanogaster.J Appl Toxicol. 2025 May;45(5):841-857. doi: 10.1002/jat.4749. Epub 2025 Jan 7. J Appl Toxicol. 2025. PMID: 39775945 Free PMC article.
-
Optimizing the detection of N-nitrosamine mutagenicity in the Ames test.Regul Toxicol Pharmacol. 2024 Nov;153:105709. doi: 10.1016/j.yrtph.2024.105709. Epub 2024 Sep 28. Regul Toxicol Pharmacol. 2024. PMID: 39343352 Free PMC article.
-
Benchmark Response (BMR) Values for In Vivo Mutagenicity Endpoints.Environ Mol Mutagen. 2025 Apr;66(4):172-184. doi: 10.1002/em.70006. Epub 2025 Apr 4. Environ Mol Mutagen. 2025. PMID: 40186380 Free PMC article.
-
Alignment between Duplex Sequencing and transgenic rodent mutation assay data in the assessment of in vivo NDMA-induced mutagenesis.Arch Toxicol. 2025 Jul 17. doi: 10.1007/s00204-025-04121-0. Online ahead of print. Arch Toxicol. 2025. PMID: 40676325
References
-
- IARC. Overall evaluations of carcinogenicity: an updating of IARC Monographs volumes 1 to 42. IARC Monogr Eval Carcinog Risks Hum Suppl 1987;7:1–440. - PubMed
-
- WHO. World Health Organisation (WHO) Concise International Chemical Assessment Document (CICAD) 38 N-NIitrosodimethylamine. WHO Geneva. 2002
-
- NTP. N-Nitrosamines: 15 listings. In: Report on Carcinogens. 15th edn. National Toxicology Program (NTP), Research Triangle Park (NC), 2021.
-
- ATSDR. Toxicological profile for N-Nitrosodimethylamine (NDMA). In: Agency for Toxic Substances and Disease Registry (ATSDR) U.S. Department of Health and Human Services. Atlanta, GA. 2023. - PubMed
MeSH terms
Substances
LinkOut - more resources
Full Text Sources
Miscellaneous
