. 2024 Feb:69:103015.
doi: 10.1016/j.redox.2023.103015. Epub 2023 Dec 28.

Chloroplasts lacking class I glutaredoxins are functional but show a delayed recovery of protein cysteinyl redox state after oxidative challenge

Affiliations

Chloroplasts lacking class I glutaredoxins are functional but show a delayed recovery of protein cysteinyl redox state after oxidative challenge

Finja Bohle et al. Redox Biol. 2024 Feb.

Abstract

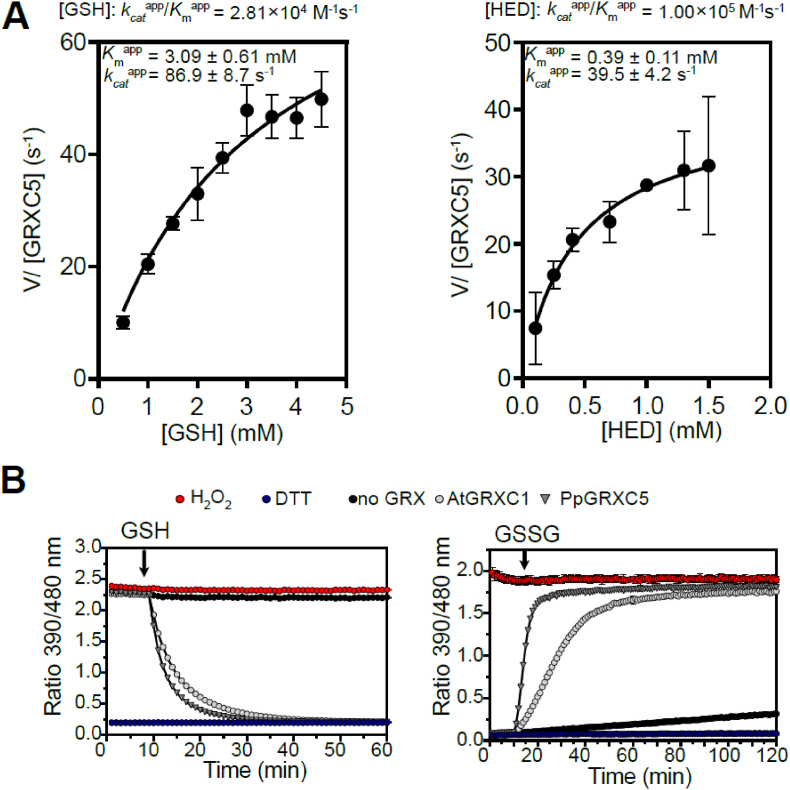
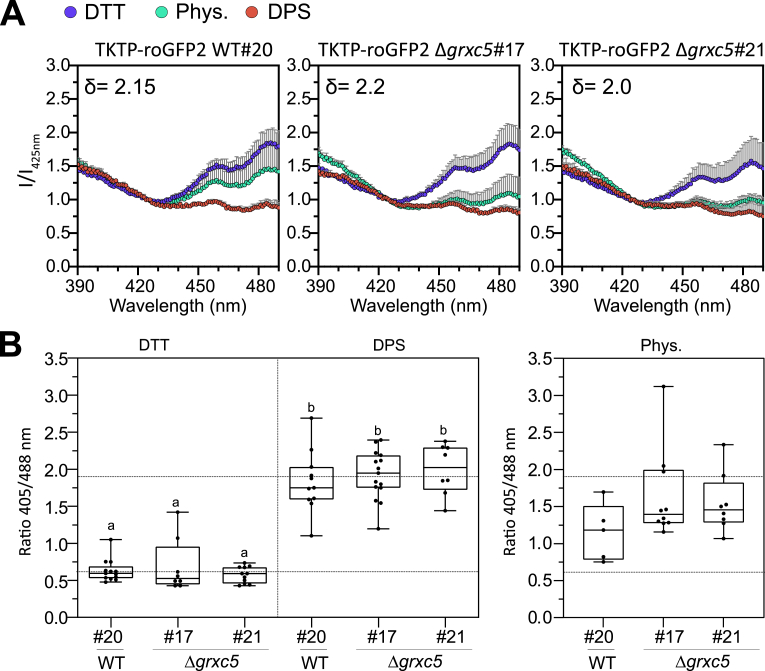
Redox status of protein cysteinyl residues is mediated via glutathione (GSH)/glutaredoxin (GRX) and thioredoxin (TRX)-dependent redox cascades. An oxidative challenge can induce post-translational protein modifications on thiols, such as protein S-glutathionylation. Class I GRX are small thiol-disulfide oxidoreductases that reversibly catalyse S-glutathionylation and protein disulfide formation. TRX and GSH/GRX redox systems can provide partial backup for each other in several subcellular compartments, but not in the plastid stroma where TRX/light-dependent redox regulation of primary metabolism takes place. While the stromal TRX system has been studied at detail, the role of class I GRX on plastid redox processes is still unknown. We generate knockout lines of GRXC5 as the only chloroplast class I GRX of the moss Physcomitrium patens. While we find that PpGRXC5 has high activities in GSH-dependent oxidoreductase assays using hydroxyethyl disulfide or redox-sensitive GFP2 as substrates in vitro, Δgrxc5 plants show no detectable growth defect or stress sensitivity, in contrast to mutants with a less negative stromal EGSH (Δgr1). Using stroma-targeted roGFP2, we show increased protein Cys steady state oxidation and decreased reduction rates after oxidative challenge in Δgrxc5 plants in vivo, indicating kinetic uncoupling of the protein Cys redox state from EGSH. Compared to wildtype, protein Cys disulfide formation rates and S-glutathionylation levels after H2O2 treatment remained unchanged. Lack of class I GRX function in the stroma did not result in impaired carbon fixation. Our observations suggest specific roles for GRXC5 in the efficient transfer of electrons from GSH to target protein Cys as well as negligible cross-talk with metabolic regulation via the TRX system. We propose a model for stromal class I GRX function in efficient catalysis of protein dithiol/disulfide equilibria upon redox steady state alterations affecting stromal EGSH and highlight the importance of identifying in vivo target proteins of GRXC5.

Keywords: E(GSH); GRXC5; Genetically encoded biosensor; Glutaredoxin; Glutathione; Photosynthesis; Plastid; Redox-sensitive GFP; S-glutathionylation.


Conflict of interest statement

Declaration of competing interest The authors declare that they have no known competing financial interests or personal relationships that could have appeared to influence the work reported in this paper.

Figures

Image 1
Graphical abstract
Fig. 1
Fig. 1
Scheme of class I GRX and glutathione reductase function. Class I glutaredoxins (GRX) can reversibly modify cysteinyl residues (thiol group SH, thiolate S) in proteins by forming a mixed disulfide with the tripeptide glutathione (GSH). If a second cysteine is present in a suitable distance, this S-glutathionylation can be released by intramolecular disulfide formation, as observed for the genetically encoded redox sensor roGFP2. Glutathione reductase (GR) uses NADPH to reduce glutathione disulfide (GSSG) yielding two molecules of reduced glutathione (GSH). The resulting low steady-state glutathione redox potential EGSH is then used by GRX to maintain a high steady-state thiol:disulfide ratio for most cysteinyl residues. Grey squares represent GRX substrate proteins, black rounded shapes enzymes.
Fig. 2
Fig. 2
Catalytic activity of PpGRXC5 in vitro(A) HED assays: PpGRXC5 [30 nM] was added to a cuvette containing GSH [0.5–4 mM], HED [0.3–1.5 mM], NADPH [200 μM], GR [6 μg/ml] in 100 mM Tris-HCl, 1 mM EDTA, pH 7.9. The decrease in absorbance at 340 nm was followed for 1 min (shown are means± SDs, n = 4). Varying concentration of GSH [0.5–4 mM] and a constant HED concentration of 0.7 mM was used to determine GSH-dependent kinetics (left panel). Varying concentrations of HED [0.3–1.5 mM] and a concentration of 1 mM GSH was used to determine HED-dependent kinetics (right panel). Apparent Km (Kmapp) is depicted in mM, apparent kcat (kcatapp) in s−1 and the rate constant (kcatapp/Kmapp) in M−1s−1. Non-linear regression was fitted using Prism 9 (GraphPad). (B) roGFP2 reduction assay (left panel): 1 μM of PpGRXC5 or 1 μM AtGRXC1 were incubated with 1 μM of oxidized roGFP2 in 100 mM KPE, pH 7.4. Arrow indicates the time point of addition of 2 mM GSH; n = 3 ± SDs. roGFP2 oxidation assay (right panel): 1 μM of PpGRXC5 or 1 μM AtGRXC1 were incubated with 1 μM of pre-reduced roGFP2. Arrows indicate the time point of addition of 40 μM GSSG. As oxidation and reduction controls (calibration), 1 μM of roGFP2 was treated with 10 mM of DTT or 10 mM H2O2; n = 3 ± SDs.
Fig. 3
Fig. 3
Phenotype of Δgrxc5, Δgr1 and Δgr1/Δgrxc5 plants (A) Schematic overview of the PpGRXC5 gene structure and knock-out construct; exons = boxes; UTRs (untranslated regions) light grey, coding sequence black; HR, homologous regions; nptII, neomycin phosphotransferase resistance cassette. (B)P. patens grown on KNOP-ME pH 5.8 agar plates in 100 μmol photons m−2s−1 (16 h light, 8 h dark) for four weeks, scale bar = 1 mm. Row represents colonies grown on the same plate. (C) Protonema culture spotting assay on KNOP-ME plates after incubating with 10 mM of H2O2 for 15 min as oxidative challenge. A 20 μl aliquot of protonema culture was placed on a KNOP-ME agar plate and grown under 60 μmol photons m−2s−1 (16 h light, 8 h dark) for 7 days. Control cultures were treated equally except for addition of H2O2. Images were taken after 7 days of recovery. Scale bar: 1 mm. (D) Three-day-old protonema culture was further grown in presence of 0.8 mM DPS (2,2′-dipyridyl disulfide) for 4 d (100 μmol photons m−2s−1 (16 h light, 8 h dark), shaking).
Fig. 4
Fig. 4
Redox state of stroma-targeted roGFP2 in WT and Δgrxc5(A)In vivo excitation spectra: protonema cultures of P. patens were not treated (Phys.) or treated for 30 min with 10 mM DTT or 5 mM DPS. Fluorescence was excited from 390 to 490 nm while emission was collected at 535-16 nm in a plate reader-based setup. Intensities were normalized to the intensity of the isosbestic point of roGFP2 (425 nm); n = 3, mean + SD. Delta depicts the dynamic range (405/488 nm) for each line. (B) Left panel: Image-based sensor calibration of TKTP-roGFP2 in P. patens with 10 mM DTT or 5 mM DPS incubated for at least 20 min before imaging with the CLSM (ex. 405, 488 nm; em. 508–535 nm); n > 7, box blots: line = median and whiskers = min/max values; two-way ANOVA and Tukey's multiple comparison test was conducted (p < 0.0001), different lowercase letters indicate significant difference, dynamic range c. 3.2. Right panel: image-based analysis of steady state sensor ratio (405/488 nm) under physiological conditions: P. patens protonema/gametophore culture was pre-incubated in the dark for 30 min before imaging with the CLSM (ex. 405, 488 nm; em. 508–535 nm); n = 5–10 pictures, box blots: line = median and whiskers = min/max values, one-way ANOVA and Tukey's HSD test (ratiõ genetic background, p = 0,08); horizontal lines: 0 % and 100 % oxidation based on mean DTT and mean DPS values, according to sensor calibration, see left panel.
Fig. 5
Fig. 5
In vivo kinetics of stromal roGFP2 in response to oxidative challenge (A) Protonema culture expressing TKTP-roGFP2 was treated with 10 mM H2O2 for 30 min and H2O2 subsequently removed and exchanged with imaging buffer to monitor recovery from oxidative challenge (red flask). 405/488 nm ratio of n = 6 biological replicates was normalized to t0, graph depicts mean + SD. A two-way ANOVA with Tukey's multiple comparison test was conducted for each time point revealing significant differences in roGFP2 kinetics between WT and both Δgrxc5#17 and Δgrxc5#21 starting from 11 min after peroxide removal (p < 0.001, n = 6). (B)In vivo oxidation rates after injection of H2O2 (final concentration = 2 mM) and monitoring of 405/488 nm ratio every 1.55 s. Protonema culture expressing TKTP-roGFP2 was pre-reduced using 10 mM DTT (blue flask). Shown are the mean + SD, n = 10, normalized to t0. Slope (inset, ΔR/Δt) was calculated for the first 10 s after injection (eight data points). Box plot whiskers depict min and max values with the horizontal line indicating the median. One-way ANOVA with Tukey's multiple comparison test was conducted to test for significant difference (p < 0.027).
Fig. 6
Fig. 6
Total protein-bound glutathione after oxidative challenge (A) Schematic overview of the experimental set-up and sampling. (B) Immunoblot using α-GSH (ThermoFisher). Total protein extracts from P. patens WT and Δgrxc5#54 gametophore tissue either non-treated (‘C’) or treated with 10 mM H2O2 for 30 min (‘H2O2’) (see panel A); cysteine oxidation was blocked with 20 mM NEM (N-ethyl maleimide) in the lysis buffer. As loading control, 10 μg total protein was loaded onto a 4–20 % gradient non-reducing SDS-PAGE (lower panel). As control for antibody specificity, purified roGFP2C204S (10 μM) was treated with 10 mM H2O2 in the presence of 2 mM of GSH for 30 min (positive control, glutathionylated roGFP2C204S) or treated with 10 mM DTT (negative control, no glutathionylated roGFP2C204S), and 12 μl loaded per lane.
Fig. 7
Fig. 7
Light-dependent roGFP2 dynamics and CO2 assimilation during dark-light-dark transitions in protonema culture of Δgrxc5 and WT (A) Reduction/oxidation dynamics in dark/light/dark transitions. In a 96-well plate with 200 μl of protonema culture from P. patens, initial fluorescence was measured after 30 min dark incubation using a plate reader-based setup. Subsequently, the plate was illuminated for 30 min to an intensity of ∼200 μmol photons m−2s−1 using external LED illumination. After dark/light/dark transition, each well was calibrated by first replacing the buffer with 10 mM DTT and then10 mM H2O2. OxD = degree of oxidation, shown are the mean (+SD) of n = 3. (B) Image-based analysis of oxidation/reduction dynamics of TKTP-roGFP2 in P. patens gametophores and protonema tissue grown in liquid culture. CLSM time series of dark-adapted samples: 1 min in the dark, illumination by external light source for 5 min (100 μmol photons m−2s−1), followed by dark incubation. Images were taken every 30 s for 20 min; shown is the mean + SD of n = 7–8. (C) Left panel: changes in CO2 partial pressure during dark/light/dark transitions in protonema culture of Δgrxc5 lines and WT using a 7.5 min light and 7.5 min dark cycle (98 % humidity, 500 ppm CO2, 22 °C, and 75 μmol photons m−2s−1). The absolute changes in CO2 levels were measured after zero-point (ZP) subtraction (nylon membrane filter wetted with KNOP-ME as ZP). Right panel: Changes in CO2 partial pressure after reaching plateau values during the light and dark phases, respectively (indicated by arrows in left panel). One-way ANOVA and Tukey's multiple comparison to assess significant differences between Δgrxc5 lines and WT at the end of the light cycle (1350 s) and the end of the dark cycle (1800 s): p = 0.99. Boxes display the 25–75 percentiles, with the minimum and maximum values indicated by the whiskers, and the median marked by the horizontal line (n = 5).
Fig. 8
Fig. 8
Schematic overview: Model of observed dynamic redox states as a consequence of changing oxidation and reduction rates. Simplified scheme of steady states of the GSH/GSSG redox couple and resulting EGSH, as well as the protein thiol/disulfide and thiol/glutathionylated redox couples before, during and after an oxidative challenge, as investigated in this work using roGFP2. Redox potentials are given for pH 8 (midpoint potential of roGFP2 at pH 8 is −310 mV). Colour scales exemplify relative changes between reduced and oxidized forms. Bars indicate approximate durations of transitions. Arrow thickness indicates sum of oxidation rates (i.e. all direct oxidation (slow) and enzymatically catalysed oxidation (fast)) and sum of reduction rates that would result in the observed profile of redox dynamics. Lack of GRXC5 leads to more oxidized steady state for target cysteines, as well as slow recovery rates. Enzymes are depicted as black ovals. Rmax = maximal reachable reduction rate with current enzyme copy number.

Similar articles

Cited by

References

    1. Schreiber M., Rensing S.A., Gould S.B. The greening ashore. Trends Plant Sci. 2022;27:847–857. - PubMed
    1. Roach T., Krieger-Liszkay A. Regulation of photosynthetic electron transport and photoinhibition. Curr. Protein Pept. Sci. 2014;15:351–362. - PMC - PubMed
    1. Schöttler M.A., Toth S.Z. Photosynthetic complex stoichiometry dynamics in higher plants: environmental acclimation and photosynthetic flux control. Front. Plant Sci. 2014;5:188. - PMC - PubMed
    1. Alboresi A., Storti M., Morosinotto T. Balancing protection and efficiency in the regulation of photosynthetic electron transport across plant evolution. New Phytol. 2019;221:105–109. - PubMed
    1. Morales A., Kaiser E. Photosynthetic acclimation to fluctuating irradiance in plants. Front. Plant Sci. 2020;11:268. - PMC - PubMed

LinkOut - more resources