. 2024 Feb 1;31(2):244-259.e10.
doi: 10.1016/j.stem.2023.12.001. Epub 2024 Jan 5.

A time- and single-cell-resolved model of murine bone marrow hematopoiesis

Affiliations

A time- and single-cell-resolved model of murine bone marrow hematopoiesis

Iwo Kucinski et al. Cell Stem Cell. .

Abstract

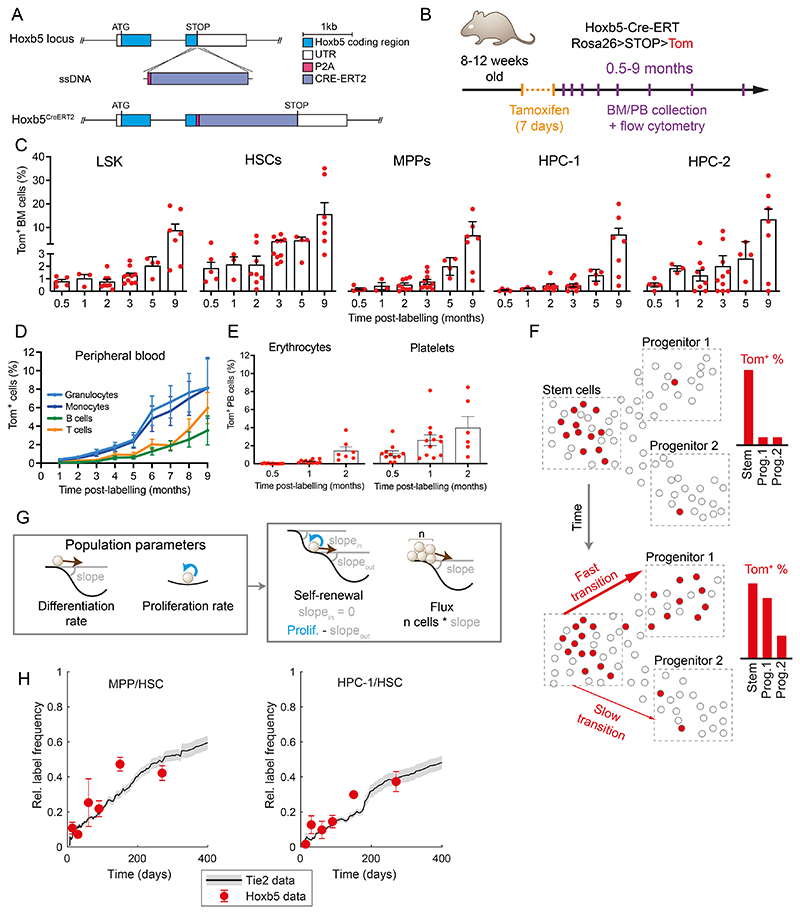
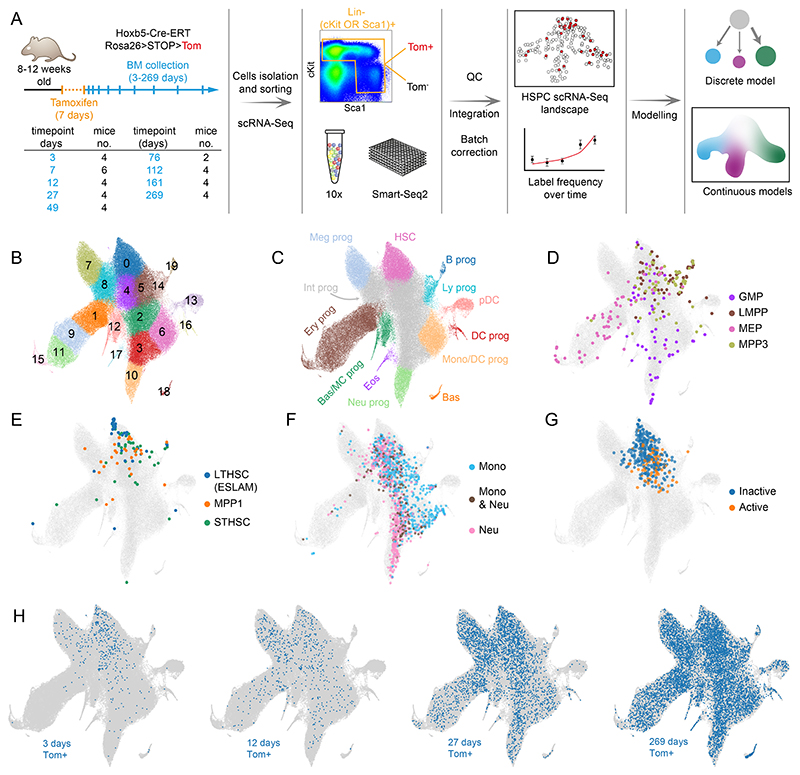
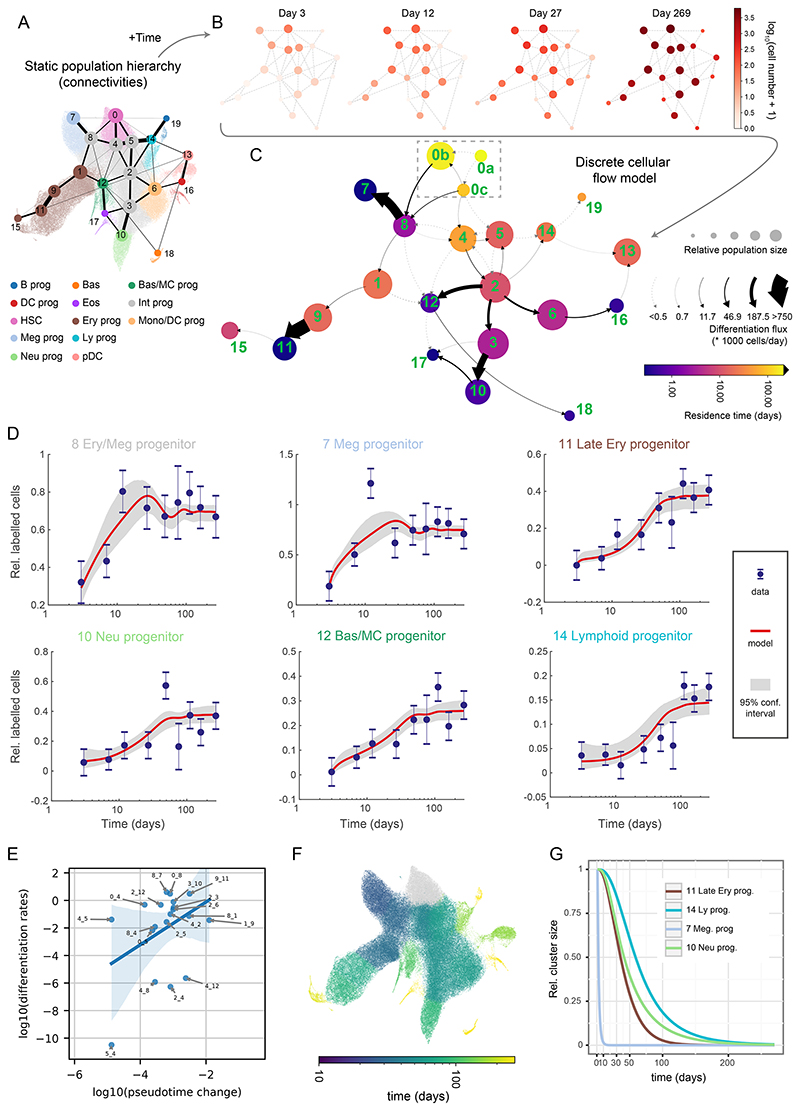
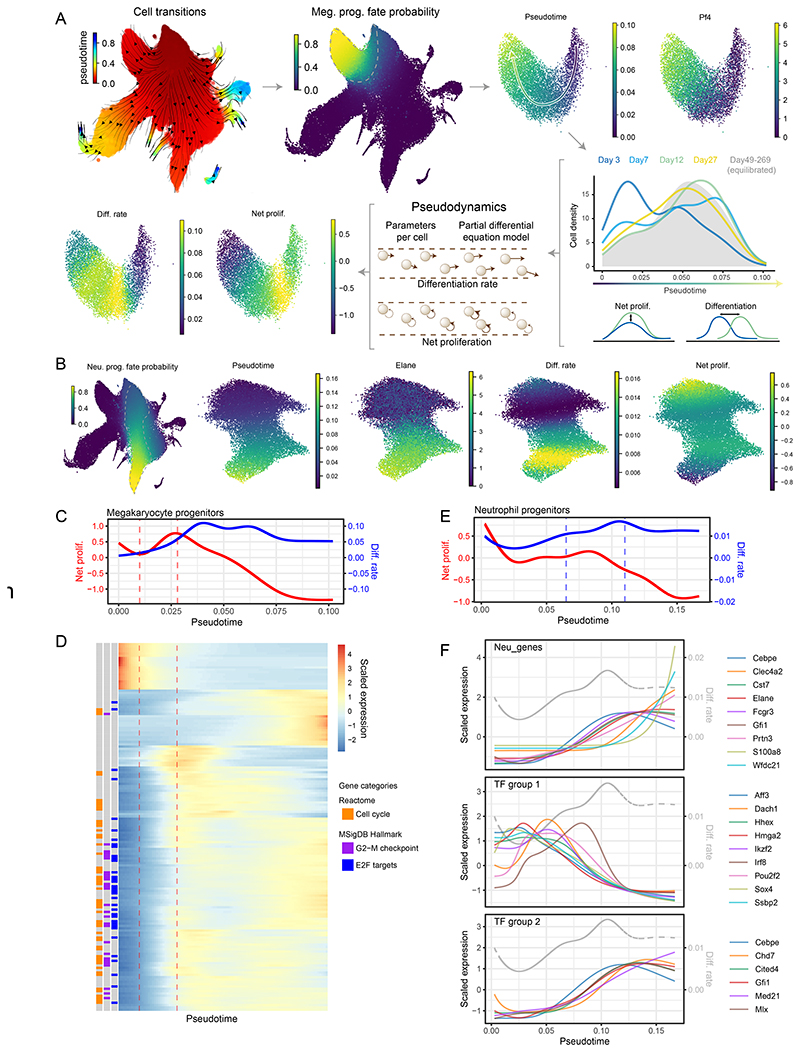
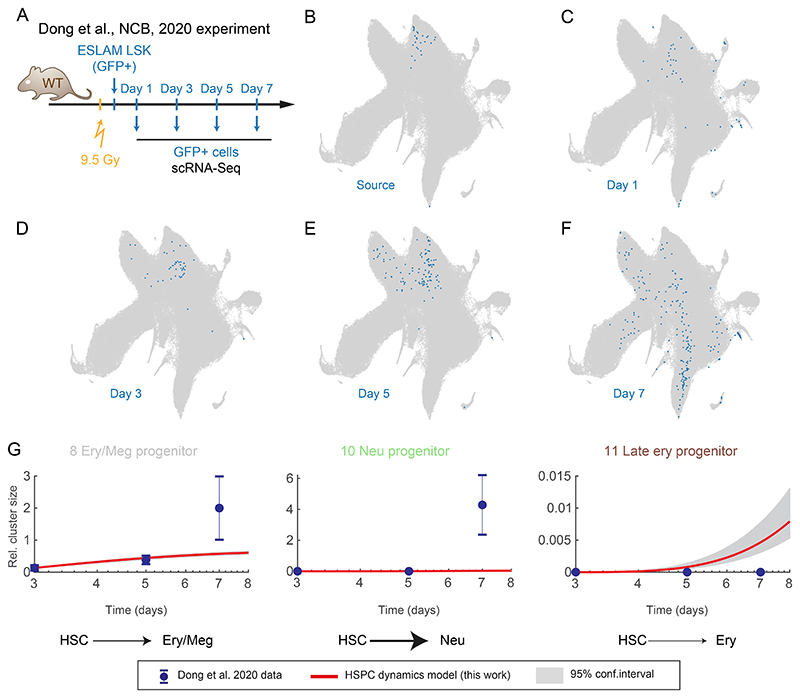
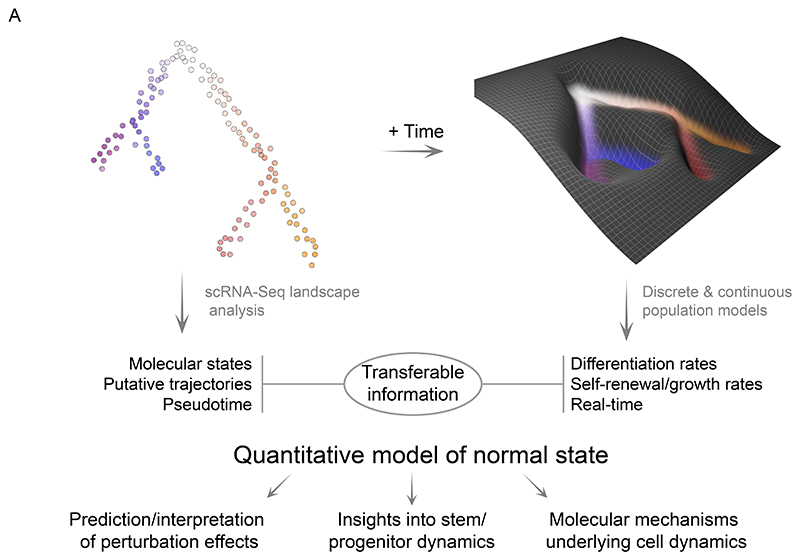
The paradigmatic hematopoietic tree model is increasingly recognized to be limited, as it is based on heterogeneous populations largely defined by non-homeostatic assays testing cell fate potentials. Here, we combine persistent labeling with time-series single-cell RNA sequencing to build a real-time, quantitative model of in vivo tissue dynamics for murine bone marrow hematopoiesis. We couple cascading single-cell expression patterns with dynamic changes in differentiation and growth speeds. The resulting explicit linkage between molecular states and cellular behavior reveals widely varying self-renewal and differentiation properties across distinct lineages. Transplanted stem cells show strong acceleration of differentiation at specific stages of erythroid and neutrophil production, illustrating how the model can quantify the impact of perturbations. Our reconstruction of dynamic behavior from snapshot measurements is akin to how a kinetoscope allows sequential images to merge into a movie. We posit that this approach is generally applicable to understanding tissue-scale dynamics at high resolution.

Keywords: Hoxb5; differentiation rate; dynamics; hematopoiesis; modeling; progenitors; scRNA-seq; self-renewal; stem cells.


Conflict of interest statement

Declaration of interests N.B. is now an employee of AstraZeneca. I.K. is now an employee of Xap Therapeutics.

Figures

Figure 1
Figure 1. Hoxb5-Tom persistent labelling system enables time-resolved tracking of stem cells and their progeny
(A) Diagram of the genetic construct used to introduce the inducible and persistent Hoxb5-Tom label in the respective mouse line. (B) Schematic of the time-course experiment analyzing Hoxb5-Tom label frequency in the indicated populations of mouse bone marrow (BM) and peripheral blood (PB). Upon tamoxifen administration, Hoxb5-expressing cells are labelled with heritable Tom expression. (C) Fractions of Tom+ cells in the HSPC subpopulations within the BM at indicated time-points after label induction. Mice were analyzed at 0.5 (n=5), 1 (n=3), 2 (n=8), 3 (n=10), 5 (n=4) and 9 (n=7) months after label induction. Dots represent individual mice and bars indicate mean ± SEM. (D, E) Fractions of Tom+ cells in peripheral blood of lymphoid/myeloid cells (D) and erythrocytes/platelets (E) analyzed at the indicated time-points after label induction. Shown as mean with error bars denoting SEM of 4-32 animals. (F) Diagram portraying the concept of inferring population dynamics from heritable label propagation. The rate of label accumulation in the downstream compartments is proportional to the differentiation rate between the compartments. (G) Diagrams providing analogy between the shape of the Waddington landscape and the key population parameters estimated in this work: differentiation rate is akin to the slope of the landscape; self-renewal (and related residence time or half-life) depend on the input, output and proliferation; flux the number of cells multiplied by the slope. (H) Comparison of Tie2-YFP and Hoxb5-Tom label progression displayed as relative labelling frequency between MPP or HPC-1 and HSC compartments. Red dots - Hoxb5-Tom data points (see Figure 2), grey line - rolling average for matching Tie2-YFP data, as published previously. LSK – Lin-, Sca1+, cKit+; HSCs – LSK, CD150+, CD48-; MPP – LSK, CD150-, CD48-; HPC-1 – LSK, CD150-, CD48+; HPC-2 – LSK, CD150+, CD48+ cells.
Figure 2
Figure 2. Time-resolved reference HSPC landscape at single-cell level
(A) Experimental design for HSPC dynamics analysis with flow cytometry and scRNA-Seq. Table indicates specific time-point and the number of mice (replicates) used for Tom+ scRNA-Seq analysis, 2 mice in each time-point were used for the Tom- fraction estimation. (B) UMAP projection of the integrated HSPC scRNA-Seq landscape (all Tom+ and Tom- cells combined) with color-coded clusters. Outlier or aberrant clusters were removed for clarity (see Figure S2F,G). (C) Manual annotation of the landscape in B. Most differentiated clusters with clearly defined lineage markers are color-coded, intermediate undifferentiated states are shown in grey (Int prog), cluster containing HSCs is shown in pink. (D,E) Projection from B in grey, with embedded and color-coded immunophenotypic sub-populations from Nestorowa et al. data. Up to randomly selected 60 cells in each category are plotted. All cells are plotted in Figure S3A. (F) Projection from B in grey, with embedded and color-coded cKit+ progenitors, based on their output in lineage tracing in vitro cultures. Color-coded points correspond to cells harvested at day 2 with sufficient clonal information available at day 4 and day 6 of culture. Data from Weinreb et al.. (G) Projection from B in grey, with embedded and color-coded HSCs with no detected cellular output (inactive - childless) or contributing to haematopoiesis (active - parent) following 5-FU challenge in mice (data from Bowling et al.). (H) Projection from B in grey, with Hoxb5-Tom+ cells harvested at indicated time-points shown in blue. Nestorowa et al. population definitions: LT-HSC – Lin-, cKit+, Sca1+, CD34-, Flt3-, MPP1 – Lin-, cKit+, Sca1+, Flt3-, CD34+, CD150+, CD48-, ST-HSC – Lin-, cKit+, Sca1+, Flt3-, CD34+, CD150-, CD48-, GMP Lin-, cKit+, Sca1+, CD16/32+, CD34+, LMPP – Lin-, cKit+, Sca1+, Flt3+, CD34+, MEP – Lin-, cKit+, Sca1+, CD16/32-, CD34-, MPP3 – Lin-, cKit+, Flt3-, CD34+, CD150-, CD48+, CMP – Lin-, cKit+, Sca1+, CD16/32-, CD34+. Abbreviations: B prog - B cell progenitor, Bas - basophils, Bas/MC prog - Basophil and Mast Cell progenitors, DC prog - dendritic cell progenitors, Eos - eosinophils, Ery prog - erythroid progenitors, HSC - hematopoietic stem cells, Int prog - intermediate progenitors, Ly prog - lymphoid progenitors, Meg prog - megakaryocyte progenitors, Mono/DC prog - monocyte and dendritic cells progenitors, Neu prog - neutrophil progenitors, pDC - plasmacytoid dendritic cells
Figure 3
Figure 3. Quantitative discrete model of the HSPCs highlights progenitor-specific self-renewal and differentiation properties
(A) Annotated UMAP projection overlaid with PAGA graph abstraction view of the HSPC landscape. The graph shows putative transitions between clusters (related to Figure 2B). (B) The absolute number of labelled cells observed in each cluster over time displayed as a graph view from A. 4 out of 9 time-points are shown for clarity. (C) Graph abstraction view of the discrete cellular flow model. Size of the nodes is proportional to square roots of relative cluster size, node color is proportional to the residence time (log-scale), arrows indicate differentiation directions, arrow stem thickness is proportional to cell flux. Note: cluster 0a is fully self-renewing and thus exhibits infinite residence time. (D) Best discrete model fit (with 95% confidence intervals) for Tom+ cell number in chosen clusters relative to cluster 0. Error bars indicate pooled standard error of the mean. (E) Scatter plot showing relation of pseudotime distance to differentiation rates, each point corresponding to a transition between clusters. Only transitions among clusters 0-12 and differentiation rates greater than 10-12 are shown. Please note that in the case of the transitions between clusters 4 and 8 two differentiation rates are plotted (each direction). Blue line indicates linear model fit with shaded 95% confidence interval. (F) UMAP projection of the HSPC landscape, with cells color-coded by simulated time required for 1 cell to accumulate in the corresponding cluster starting from cluster 0. Please mind that the color is logarithm-scaled. (G) Simulated relative cluster size of chosen clusters following complete ablation of cluster 0.
Figure 4
Figure 4. Continuous models capture single cell growth and differentiation rates alongside their molecular state
(A) Diagrammatic representation of megakaryocyte trajectory analysis with pseudodynamics. Following the arrows: putative cell transitions (pseudotime kernel) were used to estimate megakaryocyte cell fate, from which megakaryocyte trajectory was isolated (dashed line). Along the pseudotime cell densities were computed for each time-point (color-coded density profiles) and analyzed using the pseudodynamics framework providing differentiation and net proliferation rate estimates for each cell. (B) (left) UMAP projection of the HSPC landscape color-coded by cell fate probability of neutrophil lineage (estimated with pseudotime kernel, see A). Panels on the right show UMAP projections of isolated neutrophil trajectory color-coded by indicated parameters or gene expression. (C) Pseudodynamics fitted net proliferation parameter (red) and differentiation rate parameters (blue) along pseudotime for megakaryocyte trajectory. Vertical lines indicate the region of interest with increasing proliferation. (D) Heatmap of genes differentially expressed around the region of interest shown in C. Left columns indicate genes belonging to enriched gene categories - E2F target (FDR <10-38), G2-M checkpoint (FDR <10-24) and cell cycle (FDR <10-38). (E) Pseudodynamics fitted net proliferation (red) and differentiation rate (blue) parameters along pseudotime for neutrophil trajectory. Vertical lines indicate the region of interest with increasing differentiation. (F) Fitted gene expression values along pseudotime for neutrophil markers and two TF groups shown in (full analysis in Figure E10). Grey, dashed line indicated differentiation rates shown in E. Gene expression was scaled around the mean.
Figure 5
Figure 5. Growth and differentiation rates of HSPCs adapt to cellular stress conditions
(A) Diagram of the experiment performed by Dong et al., with HSC transplanted into an irradiated animal and followed over time with scRNA-Seq. (B-F) UMAP projections of the HSPC landscape (grey) with embedded cells from Dong et al. in blue. (G) Relative cluster size, points indicates observed data from Dong et al.. Red line indicates our discrete model prediction (shaded area – with 95% confidence interval) starting from the day 3 time-point. Error bars indicate propagated standard error of the mean.
Figure 6
Figure 6. The quantitative model of HSPC dynamics in the mouse bone marrow
Diagram highlighting the transferable information and the model utility.

References

    1. Seita J, Weissman IL. Hematopoietic Stem Cell: Self-renewal versus Differentiation. Wiley Interdiscip Rev Syst Biol Med. 2010;2:640–653. doi: 10.1002/wsbm.86. - DOI - PMC - PubMed
    1. Reya T, Morrison SJ, Clarke MF, Weissman IL. Stem cells, cancer, and cancer stem cells. Nature. 2001;414:105–111. doi: 10.1038/35102167. - DOI - PubMed
    1. Busch K, Klapproth K, Barile M, Flossdorf M, Holland-Letz T, Schlenner SM, Reth M, Höfer T, Rodewald H-R. Fundamental Properties of Unperturbed Haematopoiesis From Stem Cells in Vivo. Nature. 2015;518:542–546. doi: 10.1038/nature14242. - DOI - PubMed
    1. Paul F, Arkin Y, Giladi A, Jaitin DA, Kenigsberg E, Keren-Shaul H, Winter D, Lara-Astiaso D, Gury M, Weiner A, et al. Transcriptional Heterogeneity and Lineage Commitment in Myeloid Progenitors. Cell. 2015;163:1663–1677. doi: 10.1016/j.cell.2015.11.013. - DOI - PubMed
    1. Perié L, Duffy KR, Kok L, de Boer RJ, Schumacher TN. The Branching Point in Erythro-Myeloid Differentiation. Cell. 2015;163:1655–1662. doi: 10.1016/j.cell.2015.11.059. - DOI - PubMed

Publication types