

RORα inhibits gastric cancer proliferation through attenuating G6PD and PFKFB3 induced glycolytic activity
- PMID: 38184549
- PMCID: PMC10770990
- DOI: 10.1186/s12935-023-03201-4
RORα inhibits gastric cancer proliferation through attenuating G6PD and PFKFB3 induced glycolytic activity
Abstract
Background: Glycolysis is critical for harvesting abundant energy to maintain the tumor microenvironment in malignant tumors. Retinoic acid-related orphan receptor α (RORα) has been identified as a circadian gene. However, the association of glycolysis with RORα in regulating gastric cancer (GC) proliferation remains poorly understood.
Methods: Bioinformatic analysis and retrospective study were utilized to explore the role of RORα in cell cycle and glycolysis in GC. The mechanisms were performed in vitro and in vivo including colony formation, Cell Counting Kit-8 (CCK-8), Epithelial- mesenchymal transition (EMT) and subcutaneous tumors of mice model assays. The key drives between RORα and glycolysis were verified through western blot and chip assays. Moreover, we constructed models of high proliferation and high glucose environments to verify a negative feedback and chemoresistance through a series of functional experiments in vitro and in vivo.
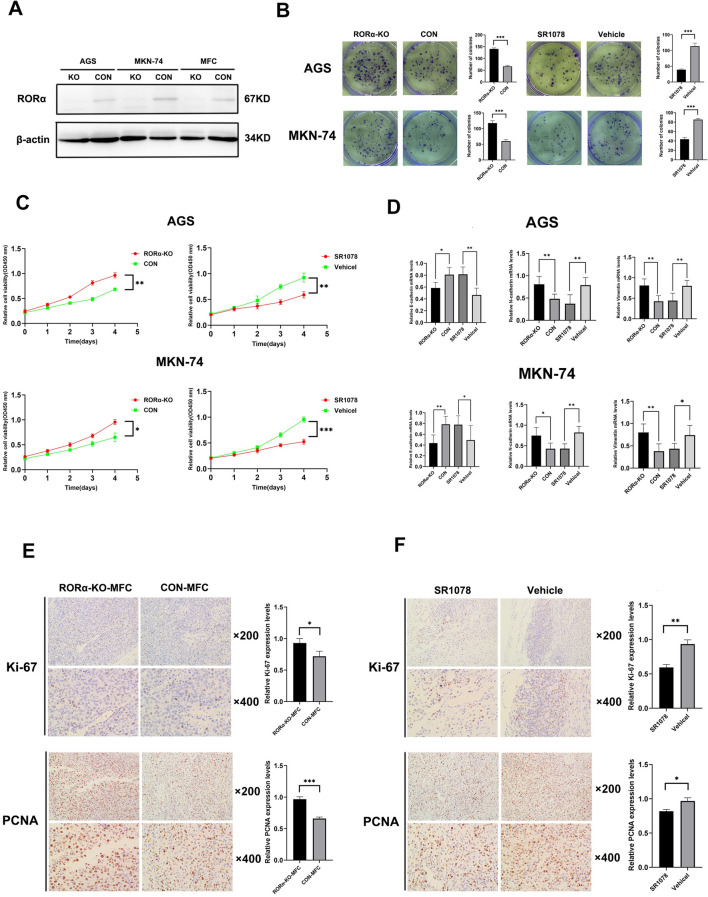
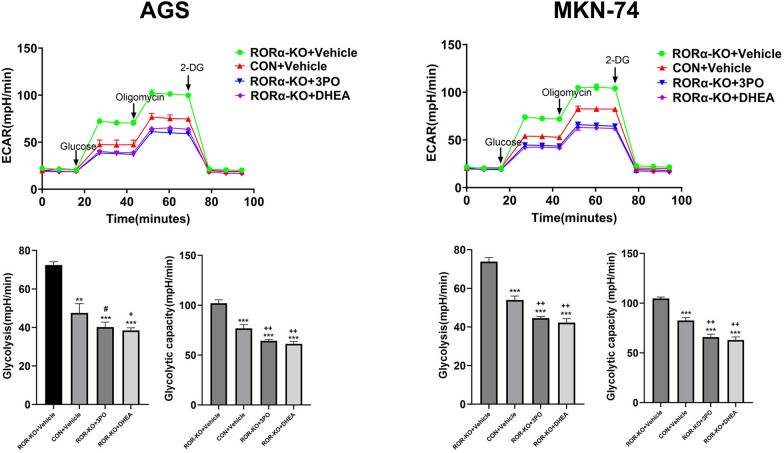
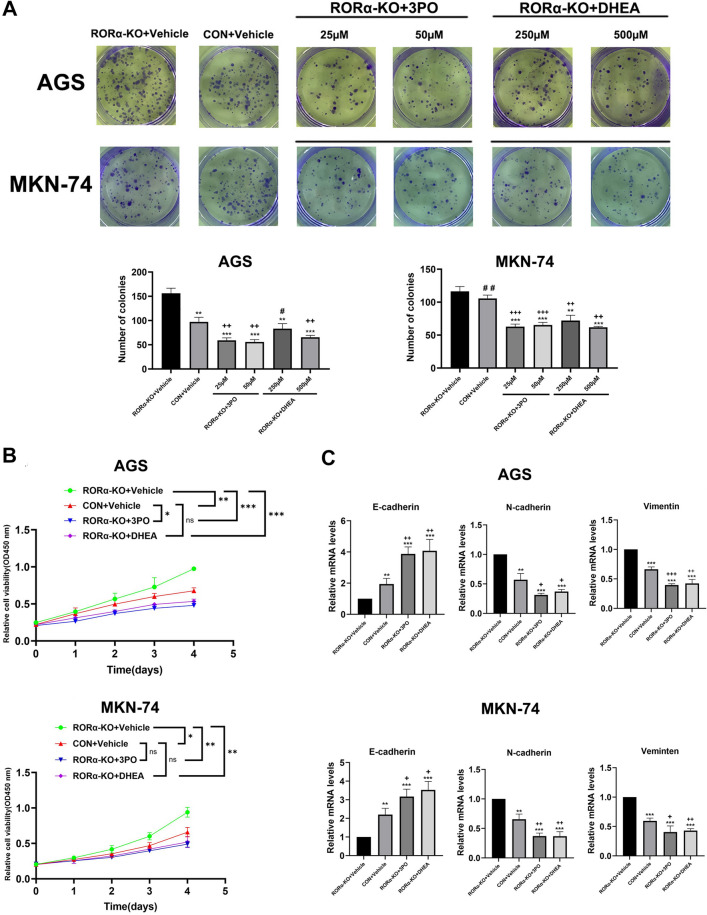
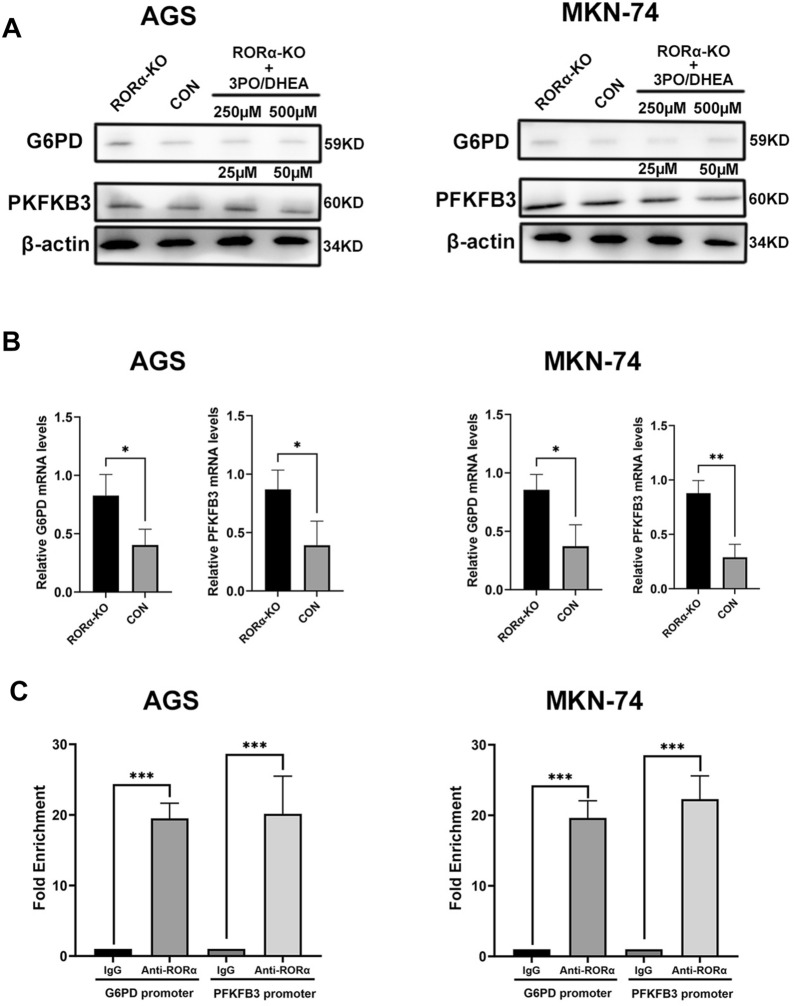
Results: RORα was found to be involved in the cell cycle and glycolysis through a gene set enrichment analysis (GSEA) algorithm. GC patients with low RORα expression were not only associated with high circulating tumor cells (CTC) and high vascular endothelial growth factor (VEGF) levels. However, it also presented a positive correlation with the standard uptake value (SUV) level. Moreover, the SUVmax levels showed a positive linear relation with CTC and VEGF levels. In addition, RORα expression levels were associated with glucose 6 phosphate dehydrogenase (G6PD) and phosphofructokinase-2/fructose-2,6-bisphosphatase (PFKFB3) expression levels, and GC patients with low RORα and high G6PD or low RORα and high PFKFB3 expression patterns had poorest disease-free survival (DFS). Functionally, RORα deletion promoted GC proliferation and drove glycolysis in vitro and in vivo. These phenomena were reversed by the RORα activator SR1078. Moreover, RORα deletion promoted GC proliferation through attenuating G6PD and PFKFB3 induced glycolytic activity in vitro and in vivo. Mechanistically, RORα was recruited to the G6PD and PFKFB3 promoters to modulate their transcription. Next, high proliferation and high glucose inhibited RORα expression, which indicated that negative feedback exists in GC. Moreover, RORα deletion improved fluorouracil chemoresistance through inhibition of glucose uptake.
Conclusion: RORα might be a novel biomarker and therapeutic target for GC through attenuating glycolysis.
Keywords: G6PD; Gastric cancer; Glycolysis; PFKFB3; Proliferation; RORα.
© 2024. The Author(s).
Conflict of interest statement
The authors declares that there no conflicts of interest.
Figures


Similar articles
-
RORα inhibits proliferation and chemoresistance through AKR1A1-induced glucose and lipid reprogramming in gastric cancer.Cell Signal. 2025 Jul;131:111741. doi: 10.1016/j.cellsig.2025.111741. Epub 2025 Mar 15. Cell Signal. 2025. PMID: 40096932
-
Hyperglycemia induces miR-26-5p down-regulation to overexpress PFKFB3 and accelerate epithelial-mesenchymal transition in gastric cancer.Bioengineered. 2022 Feb;13(2):2902-2917. doi: 10.1080/21655979.2022.2026730. Bioengineered. 2022. PMID: 35094634 Free PMC article.
-
Overexpression of PFKFB3 promotes cell glycolysis and proliferation in renal cell carcinoma.BMC Cancer. 2022 Jan 20;22(1):83. doi: 10.1186/s12885-022-09183-2. BMC Cancer. 2022. PMID: 35057732 Free PMC article.
-
Treatment against glucose-dependent cancers through metabolic PFKFB3 targeting of glycolytic flux.Cancer Metastasis Rev. 2022 Jun;41(2):447-458. doi: 10.1007/s10555-022-10027-5. Epub 2022 Apr 14. Cancer Metastasis Rev. 2022. PMID: 35419769 Review.
-
The role of PFKFB3 in maintaining colorectal cancer cell proliferation and stemness.Mol Biol Rep. 2022 Oct;49(10):9877-9891. doi: 10.1007/s11033-022-07513-y. Epub 2022 May 12. Mol Biol Rep. 2022. PMID: 35553342 Review.
Cited by
-
Metabolic fingerprinting enables rapid, label-free histopathology in gastric cancer diagnosis and prognostic prediction.Cell Rep Med. 2025 Jul 15;6(7):102238. doi: 10.1016/j.xcrm.2025.102238. Cell Rep Med. 2025. PMID: 40669450 Free PMC article.
-
UBR5 metabolically reprograms nasopharyngeal carcinoma cells to promote glycolysis and M2 polarization via SPLUNC1 signaling.NPJ Precis Oncol. 2024 Nov 5;8(1):252. doi: 10.1038/s41698-024-00747-y. NPJ Precis Oncol. 2024. PMID: 39501021 Free PMC article.
-
Circadian genes and non-coding RNAs: interactions and implications in cancer.Anim Cells Syst (Seoul). 2025 Feb 11;29(1):135-148. doi: 10.1080/19768354.2025.2459622. eCollection 2025. Anim Cells Syst (Seoul). 2025. PMID: 39944901 Free PMC article. Review.
-
Syndecan-4 promotes gastric cancer progression through activating TGF-β1 induced lipid reprogramming and contributes positive loop circuits.Discov Oncol. 2025 Jun 14;16(1):1104. doi: 10.1007/s12672-025-02975-5. Discov Oncol. 2025. PMID: 40516011 Free PMC article.
References
Grants and funding
LinkOut - more resources
Full Text Sources
Miscellaneous
