. 2024 Jan 6;15(1):16.
doi: 10.1038/s41419-023-06400-z.

Varicella zoster virus glycoprotein E facilitates PINK1/Parkin-mediated mitophagy to evade STING and MAVS-mediated antiviral innate immunity

Affiliations

Varicella zoster virus glycoprotein E facilitates PINK1/Parkin-mediated mitophagy to evade STING and MAVS-mediated antiviral innate immunity

Soo-Jin Oh et al. Cell Death Dis. .

Abstract

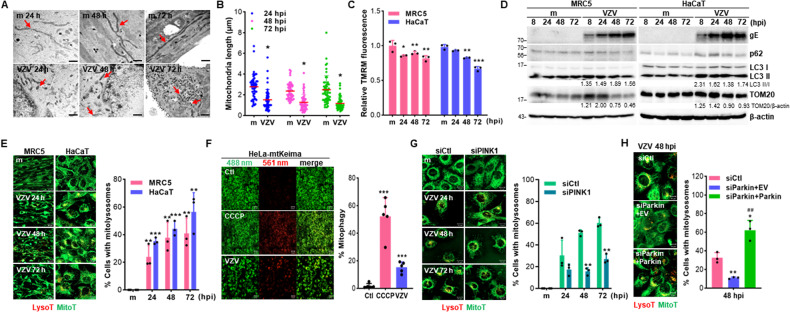
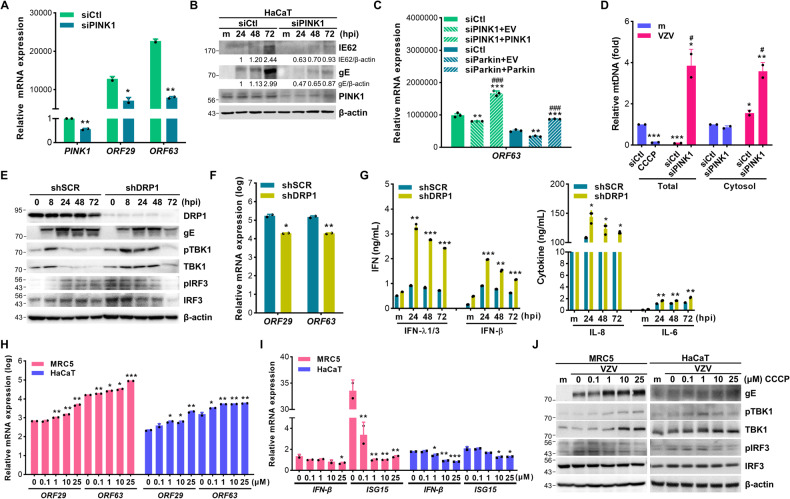
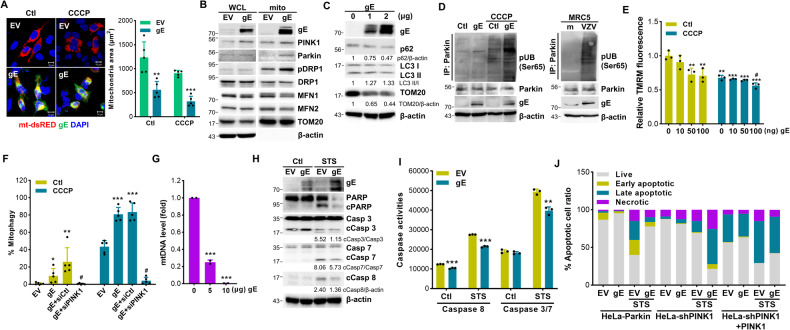
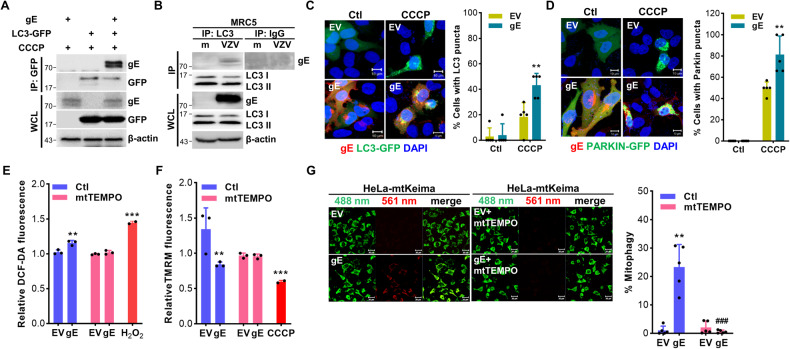
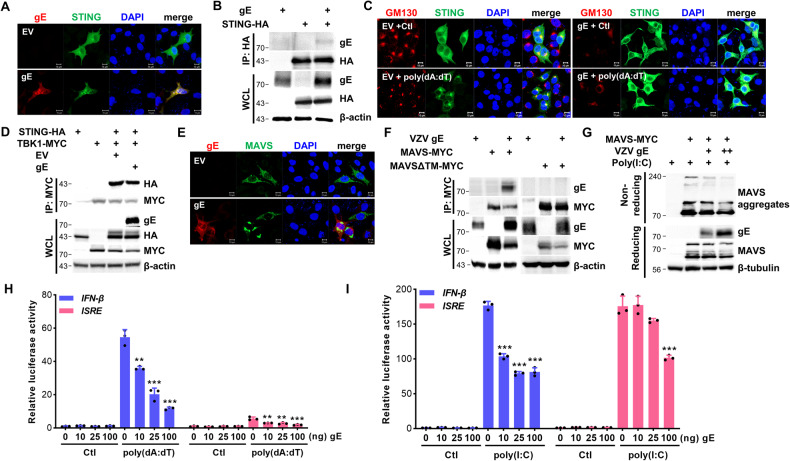
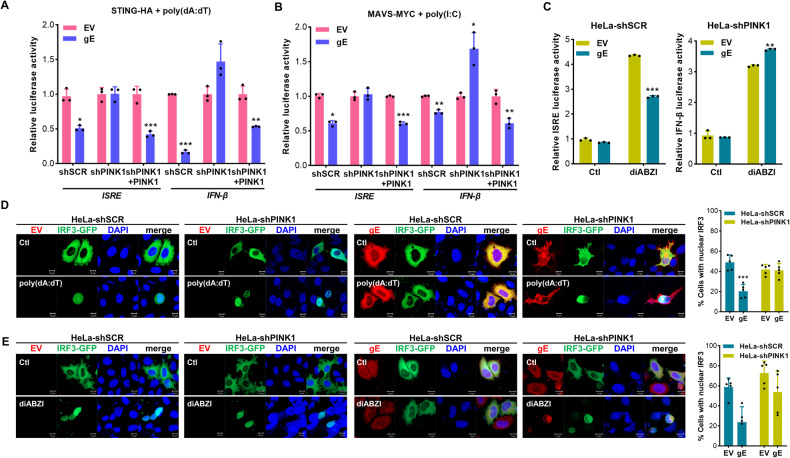
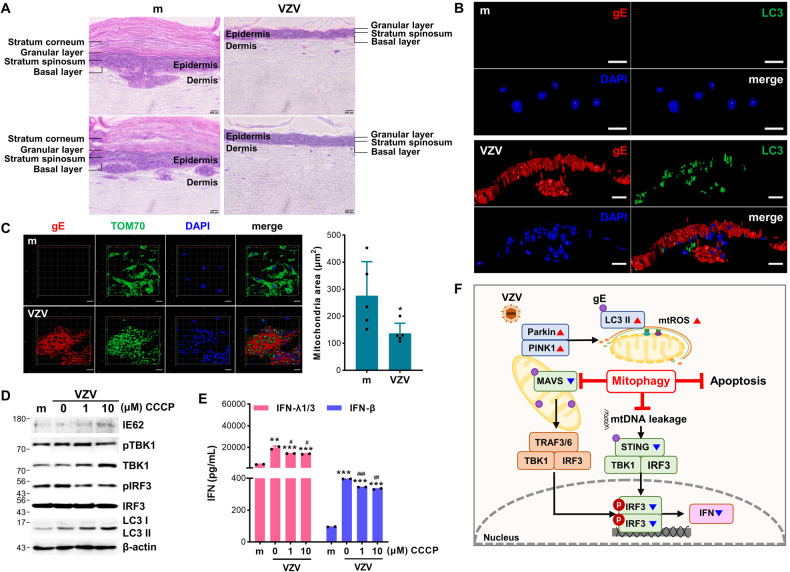
Viruses have evolved to control mitochondrial quality and content to facilitate viral replication. Mitophagy is a selective autophagy, in which the damaged or unnecessary mitochondria are removed, and thus considered an essential mechanism for mitochondrial quality control. Although mitophagy manipulation by several RNA viruses has recently been reported, the effect of mitophagy regulation by varicella zoster virus (VZV) remains to be fully determined. In this study, we showed that dynamin-related protein-1 (DRP1)-mediated mitochondrial fission and subsequent PINK1/Parkin-dependent mitophagy were triggered during VZV infection, facilitating VZV replication. In addition, VZV glycoprotein E (gE) promoted PINK1/Parkin-mediated mitophagy by interacting with LC3 and upregulating mitochondrial reactive oxygen species. Importantly, VZV gE inhibited MAVS oligomerization and STING translocation to disrupt MAVS- and STING-mediated interferon (IFN) responses, and PINK1/Parkin-mediated mitophagy was required for VZV gE-mediated inhibition of IFN production. Similarly, carbonyl cyanide m-chlorophenyl hydrazone (CCCP)-mediated mitophagy induction led to increased VZV replication but attenuated IFN production in a three-dimensional human skin organ culture model. Our results provide new insights into the immune evasion mechanism of VZV gE via PINK1/Parkin-dependent mitophagy.


Conflict of interest statement

The authors declare that this study was conducted in the absence of any commercial or financial relationships that could be construed as potential conflicts of interest.

Figures

Fig. 1
Fig. 1. VZV infection results in mitochondrial fission and activates PINK1/Parkin-dependent mitophagy.
A MRC5 cells were infected with mock (m) or VZV YC01 (MOI 0.001). Representative transmission electron microscope images of mock or VZV-infected cells. The red arrow indicates mitochondria. Scale bar = 1 μm. B Quantitative analysis of mitochondria lengths in mock (m) vs. VZV-infected MRC5 cells. The length of ten mitochondria per cell present in more than five cells in each group was measured. Statistical analysis, *p < 0.05 vs. mock-infected cells. C MRC5 and HaCaT cells were infected with mock (m) or VZV (MOI 0.001) for indicated times. Relative tetramethylrhodamine methyl ester (TMRM) intensity was measured (mean ± SD; n = 3). *p < 0.05; **p < 0.01; ***p < 0.001 vs. mock-infected cells. D Immunoblot analysis of VZV gE, p62, LC3, and TOM20 expression in VZV (MOI 0.001)-infected cells at the indicated time points. β-actin was used as a protein loading control. Numbers below the blot represent quantified band intensity by densitometric analysis. E MRC5 and HaCaT cells were infected with mock (m) or VZV (MOI 0.001) and subsequently stained with MitoTracker (green) and LysoTracker (red). % cells with LysoTracker and MitoTracker colocalization were calculated and are presented in the graph. **p < 0.01; ***p < 0.001 vs. mock-infected cells. F Representative confocal analysis of VZV-infected HeLa-Parkin cells expressing mtKeima. Cells were treated with 25 μM CCCP for 2 h or infected with VZV for 48 h. Representative mtKeima fluorescence images are shown and the graph on the right demonstrates mitophagy index. ***p < 0.001 vs. mock-infected control cells (Ctl). G Representative confocal images of HaCaT cells transfected with siCtl or siPINK1, followed by VZV infection (MOI 0.001). The graph shows the percentage of cells displaying mitolysosomes by assessing LysoTracker and MitoTracker colocalization. A minimum of one hundred cells per condition were counted in three independent experiments. **p < 0.01 vs. siCtl-expressing mock-infected cells. H HaCaT cells were transfected with control (siCtl) or Parkin siRNA (siParkin), followed by empty vector (EV) or Parkin-MYC plasmids (siParkin+Parkin) transfection. After transfection, cells were infected with VZV (MOI 0.001) and stained with LysoTracker and MitoTracker to examine the formation of mitolysosomes at 48 hpi. *p < 0.05; **p < 0.01 vs. siCtl-expressing cells, ##p < 0.01 vs. siParkin-expressing EV-transfected cells.
Fig. 2
Fig. 2. Mitochondrial fission and PINK1-mediated mitophagy facilitate VZV replication.
A HaCaT cells expressing control (siCtl) or PINK1 siRNA (siPINK1) were infected with VZV (MOI 0.001) for 48 h. VZV ORF29 and ORF63 gene expression was examined and analyzed by RT-qPCR (mean ± SD; n = 3). *p < 0.05; **p < 0.01 vs. siCtl-expressing cells. B Knockdown efficiency of PINK1 was confirmed and VZV IE62 and gE expression were measured by immunoblot analysis. C HaCaT cells were transfected with PINK1-(siPINK1) or Parkin-specific siRNA (siParkin) followed by EV, PINK1-V5 (siPINK1 + PINK1), or Parkin-MYC (siParkin+Parkin) plasmids transfection. After infection with VZV (MOI 0.001) for 48 h, the gene expression level of VZV ORF63 was determined by RT-qPCR (mean ± SD; n = 3). **p < 0.01; ***p < 0.001 vs. siCtl-expressing cells. ###p < 0.001 vs. siPINK1 or siParkin-expressing cells. D To quantify the mitochondrial DNA (mtDNA) content, genomic DNA was extracted from cell lysate (Total) or cytosol (Cytosol) solution in 25 μM CCCP treated or VZV (MOI 0.001)-infected HaCaT cells for 48 h. Relative mtDNA level was analyzed by RT-qPCR (mean ± SD; n = 3). *p < 0.05; **p < 0.01; ***p < 0.001 vs. mock-infected DMSO-treated cells. #p < 0.05 vs. siCtl-expressing VZV-infected cells. E Scrambled control shRNA (shSCR) and DRP1-specific shRNA-expressing (shDRP1) THP-1 cells were infected with VZV (MOI 0.001) for the indicated times. Protein levels of DRP1, VZV gE, phospho-TBK1, TBK1, phospho-IRF3, and IRF3 were measured, and a representative blot was shown. F ShSCR and shDRP1 THP-1 cells were infected with VZV (MOI 0.001) for 48 h. VZV ORF29 and ORF63 gene expression levels were quantitated, normalized, and analyzed by RT-qPCR (mean ± SD; n = 3). *p < 0.05, **p < 0.01 vs. VZV-infected shSCR cells. G IFN-β, IFN-λ1/3, IL-8, and IL-6 secretion levels were measured by ELISA. *p < 0.05, **p < 0.01, ***p < 0.001 vs. mock- or VZV-infected shSCR cells at the indicated time points. H, I Cells were pre-treated with either DMSO or different doses of CCCP for 2 h and infected with VZV (MOI 0.001) for 48 h. Host and viral gene expression was quantitated, normalized, and analyzed by RT-qPCR (mean ± SD; n = 3). *p < 0.05; **p < 0.01; ***p < 0.001 vs. DMSO-treated cells. J Expression of VZV gE, phospho-TBK1, TBK1, phospho-IRF3, and IRF3 were measured by immunoblot analysis.
Fig. 3
Fig. 3. VZV gE modulates mitochondria dynamics and regulated PINK1/Parkin-dependent mitophagy.
A HeLa-Parkin cells were transiently transfected with EV or VZV gE (green) along with mt-dsRED encoding plasmid (red) for 24 h and then treated with CCCP for 2 h. Quantification of the mitochondrial area is shown in the graph. **p < 0.01, ***p < 0.001 vs. EV-transfected cells. B HeLa-Parkin cells expressing either EV or VZV gE were subjected to immunoblot analysis. Whole-cell lysates (WCL) and mitochondrial fractions (mito) were isolated and VZV gE, PINK1, Parkin, phospho-DRP1(Ser616), DRP1, MFN1, MFN2, and TOM20 expression was measured. A representative of three independent experiments is shown. β-actin was used as a protein loading control. C p62, LC3, and TOM20 protein levels were examined in VZV gE transfection in HeLa-Parkin cells by immunoblot analysis. D HEK293T cells (Ctl) or HEK293T stably expressing VZV gE (gE) were treated with DMSO (Ctl) or CCCP for 2 h (left). MRC5 cells were infected with VZV (MOI 0.001) for 48 h (right). The ubiquitination of Parkin was measured by immunoblot assay using anti-phospho-ubiquitin (Ser65), Parkin, and VZV gE-specific antibodies. E Cells were transiently transfected with the indicated amount of VZV gE plasmid for 24 h and then treated with Ctl or CCCP for 2 h. Relative tetramethylrhodamine methyl ester (TMRM) intensities were measured. **p < 0.01; ***p < 0.001 vs. EV-transfected Ctl-treated cells. #p < 0.05 vs. VZV gE-transfected Ctl-treated cells. F HeLa-Parkin cells expressing mtKeima were transfected with EV or VZV gE plasmids along with siRNA control (siCtl) or siPINK1 (siPINK1) for 24 h. After CCCP treatment for 2 h, mitophagy levels were determined by confocal microscopy. *p < 0.05; **p < 0.01; ***p < 0.001 vs. EV-transfected cells. #p < 0.05 vs. gE-transfected siCtl-expressing cells. G Mitochondrial DNA (mtDNA) content of VZV gE-expressing HeLa-Parkin cells was analyzed by RT-qPCR (mean ± SD; n = 3). ***p < 0.001 vs. EV-transfected cells. H HeLa-Parkin cells were transiently transfected with EV or VZV gE plasmid; 24 h later, the cells were either stimulated with DMSO (Ctl) or 3 μM staurosporine (STS) for 2 h. Cleavage of PARP, caspase 3, 7, and 8 is shown by immunoblot analysis. β-actin was used as a protein loading control. Images are representatives of three independent experiments. I Activities of caspases 3/7 or caspase 8 in EV or VZV gE-expressing cells treated with STS was determined using caspase luminescence assays. Data represented as mean ± SD. **p < 0.01; ***p < 0.001 vs. EV-transfected cells in each group. J Flow cytometry analysis by Annexin V-FITC/PI staining showed % cells undergoing apoptosis in HeLa-Parkin, HeLa-shPINK1, and PINK1-V5-transfected HeLa-shPINK1 (HeLa-shPINK1 + PINK1) cells.
Fig. 4
Fig. 4. VZV gE regulates PINK1/Parkin-mediated mitophagy by interacting with LC3 and promoting mitochondrial reactive oxygen species production.
A HeLa-Parkin cells were transfected with VZV gE and LC3-GFP-encoding plasmids in the presence of CCCP. B MRC5 cells were infected with VZV (MOI 0.001) for 48 h. Cells were lysed and precipitated using anti-GFP, or anti-LC3 antibodies. The whole-cell lysates (WCL) and immunoprecipitated proteins were analyzed using anti-VZV gE, anti-GFP, anti-LC3 antibodies. Anti-Rabbit immunoglobulin G (IgG) antibodies were used as a negative control at the endogenous level. β-actin was used as a protein loading control. C, D HeLa-Parkin cells were transfected with LC3-GFP (green) (C) or Parkin-GFP (green) (D) and VZV gE plasmids (red) and treated with control (Ctl) or CCCP for 2 h. The percentage (%) of cells with Parkin or LC3 puncta associated with gE is quantified and represented as a graph on the right. **p < 0.01 vs. EV-transfected CCCP-treated cells. E HeLa-Parkin cells were transfected with EV or VZV gE following treatment with or without 1 μM mitoTEMPO (mtTEMPO). After 24 h, DCF-DA fluorescence dye was added to the cells and fluorescence intensity was measured. 20 μM H2O2 was treated in cells for 2 h as a positive control. **p < 0.01; ***p < 0.001 vs. EV-transfected cells in Ctl groups. F Relative tetramethylrhodamine methyl ester (TMRM) intensities were measured. 20 μM CCCP treated in cells was used as a positive control. **p < 0.01; ***p < 0.001 vs. EV-transfected Ctl groups. G HeLa-Parkin cells expressing mtKeima were transfected with EV or VZV gE following treatment with or without 1 μM mtTEMPO for 24 h. Mitophagy levels were quantified. The bar graph shows mean ± SD from three experiments.
Fig. 5
Fig. 5. VZV gE antagonizes STING- and MAVS-mediated signaling pathways.
A HeLa cells were transfected with EV or VZV gE (red) plasmid along with STING-HA (green). B HEK293T cells were transfected with VZV gE along with STING-HA-encoding plasmids. After 24 h, the whole-cell lysates (WCL) and immunoprecipitates were analyzed using anti-gE and anti-HA antibodies. β-actin was used as a protein loading control. C Confocal analysis of HeLa-Parkin cells transfected with either EV or gE plasmids followed by 0.5 μg/mL poly(dA:dT) treatment for 4 h. GM130 (red) staining for Golgi apparatus and STING (green) translocation is shown. D STING-HA and TBK1-MYC plasmid were transfected with EV or VZV gE in HEK293T cells. After 24 h of transfection, the cells were lysed and subjected to immunoprecipitation and immunoblot analysis against VZV gE, anti-HA, and anti-MYC tagging antibodies. β-actin was used as a protein loading control. E HeLa cells were transfected with EV or VZV gE (red) plasmid along with MAVS-MYC (green) plasmid. F HEK293T cells were transfected with VZV gE along with MAVS-MYC- or MAVSΔTM-MYC-encoding plasmids. After 24 h, the cells were lysed and precipitated using anti-MYC tag antibody. Whole-cell lysates (WCL) and immunoprecipitates were analyzed using anti-gE and anti-MYC antibodies. β-actin was used as a protein loading control. G HEK293T cells were transfected with VZV gE and MAVS-MYC-encoding plasmids for 24 h. Transfected cells were treated with DMSO or 20 μg/mL poly(I:C) for 2 h and the cell lysates were analyzed by non-reducing SDS-PAGE, to detect MAVS aggregates, and reducing SDS-PAGE to confirm the transfection efficiency. β-tubulin was used as a protein loading control. H, I Indicated amount of VZV gE with STING-HA (H) or MAVS-MYC (I) plasmid was transiently co-transfected with IFN-β or ISRE luciferase reporter plasmids. After 24 h of transfection, DMSO (Ctl) or 0.5 μg/mL poly(dA:dT) or 20 μg/mL poly(I:C) was added to the cells for 6 h. Relative luciferase activity is shown (mean ± SD; n = 3). **p < 0.01; ***p < 0.001 vs. EV-transfected cells.
Fig. 6
Fig. 6. Mitophagy is required for gE-mediated inhibition of IFN production.
A, B HeLa-shSCR (shSCR), HeLa-shPINK1 (shPINK1), PINK1-V5 transfected HeLa-shPINK1 cells (shPINK1 + PINK1) were transfected with EV, VZV gE, along with IFN-β or ISRE luciferase reporter plasmids. Cells were also co-transfected with STING-HA (A), MAVS-MYC (B) for 24 h. As indicated, the cells were treated with 0.5 μg/mL poly(dA:dT) or 20 μg/mL poly(I:C) for 6 h. Relative luciferase activity is shown (mean ± SD; n = 3). *p < 0.05; **p < 0.01; ***p < 0.001 vs. EV-transfected cells. C HeLa-shSCR and HeLa-shPINK1 cells were co-transfected with EV or VZV gE, STING-HA, IFN-β or ISRE luciferase reporter plasmids for 24 h; 10 μM diABZI was added to activate STING-mediated IFN-β or ISRE promotor. **p < 0.01; ***p < 0.001 vs. EV-transfected cells. D, E HeLa-shSCR or HeLa-shPINK1 cells were transfected with EV or VZV gE (red), along with IRF3-GFP plasmid (green). After 0.5 μg/mL poly(dA:dT) or 10 μM diABZI treatment, IRF3 nuclear translocation from cytoplasm was observed. For quantification of IRF3 nuclear localization, a minimum of one hundred cells per condition were counted in three independent experiments. Data represent the mean ± SD of three independent experiments. ***p < 0.001 vs. EV-transfected cells.
Fig. 7
Fig. 7. VZV infection triggers mitochondrial fission and CCCP suppresses STING-mediated IFN production in human skin organ culture (SOC).
A The human epidermal layer of SOC was exposed to 105 PFU cell-free VZV (MG1111) for 7 days and subjected to hematoxylin and eosin staining. B, C Mock (m) or VZV-infected SOC was subjected to immunofluorescence staining against VZV gE (red) and LC3 (green) or TOM70 (green). Quantification of the mitochondrial area is shown in the graph. D Human epidermal layer of SOC was treated with the indicated concentration of CCCP and infected with VZV. At 7 days post-infection, proteins from SOC were harvested and VZV IE62, phospho-TBK1, TBK1, phospho-IRF3, IRF3, and LC3 protein expression levels were measured by immunoblot analysis. β-actin was used as a protein loading control. E Conditioned media were collected and secretion of type I (IFN-β) and III (IFN-λ1/3) IFN levels was measured by ELISA. **p < 0.01; ***p < 0.001 vs. mock-infected groups. #p < 0.05; ##p < 0.01; ###p < 0.001 vs. VZV-infected group without CCCP treatment. F A graphical illustration of VZV gE-mediated regulation of mitophagy is shown.

References

    1. Chen Y, Zhou Z, Min W. Mitochondria, oxidative stress and innate immunity. Front Physiol. 2018;9:1487. doi: 10.3389/fphys.2018.01487. - DOI - PMC - PubMed
    1. Riley JS, Tait SW. Mitochondrial DNA in inflammation and immunity. EMBO Rep. 2020;21:e49799. doi: 10.15252/embr.201949799. - DOI - PMC - PubMed
    1. Bock FJ, Tait SWG. Mitochondria as multifaceted regulators of cell death. Nat Rev Mol Cell Biol. 2020;21:85–100. doi: 10.1038/s41580-019-0173-8. - DOI - PubMed
    1. Onishi M, Yamano K, Sato M, Matsuda N, Okamoto K. Molecular mechanisms and physiological functions of mitophagy. EMBO J. 2021;40:e104705. doi: 10.15252/embj.2020104705. - DOI - PMC - PubMed
    1. Zhang L, Qin Y, Chen M. Viral strategies for triggering and manipulating mitophagy. Autophagy. 2018;14:1665–73. doi: 10.1080/15548627.2018.1466014. - DOI - PMC - PubMed

Publication types

Substances