

The association between triglyceride-glucose index and its combination with obesity indicators and cardiovascular disease: NHANES 2003-2018
- PMID: 38184598
- PMCID: PMC10771672
- DOI: 10.1186/s12933-023-02115-9
The association between triglyceride-glucose index and its combination with obesity indicators and cardiovascular disease: NHANES 2003-2018
Abstract
Background: In the American population, the relationship between the triglyceride-glucose (TyG) index and TYG combined with indicators of obesity and cardiovascular disease (CVD) and its mortality has been less well studied.
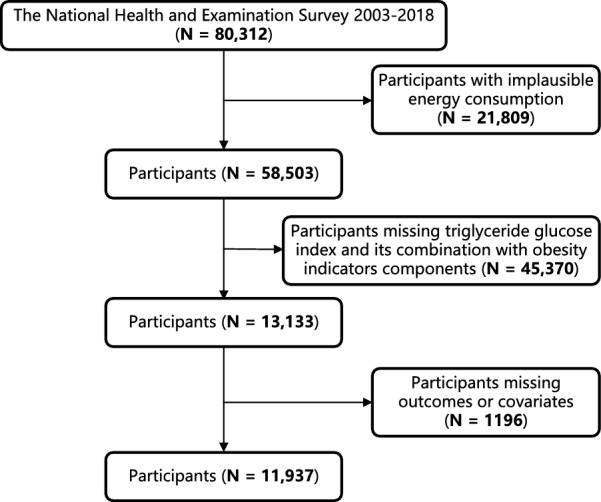
Methods: This cross-sectional study included 11,937 adults from the National Health and Nutrition Examination Survey (NHANES) 2003-2018. Cox proportional hazards model, binary logistic regression analyses, restricted cubic spline (RCS), and receiver operating characteristic (ROC) were used to analyze the relationship between TyG and its combined obesity-related indicators and CVD and its mortality. Mediation analysis explored the mediating role of glycated hemoglobin and insulin in the above relationships.
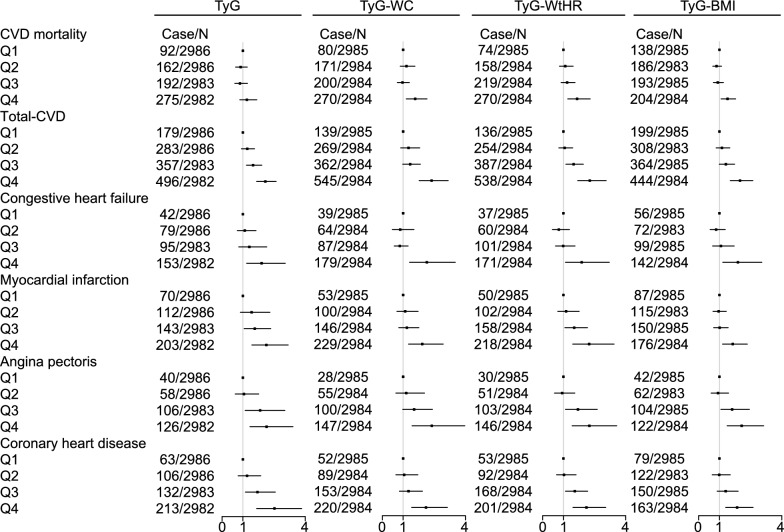
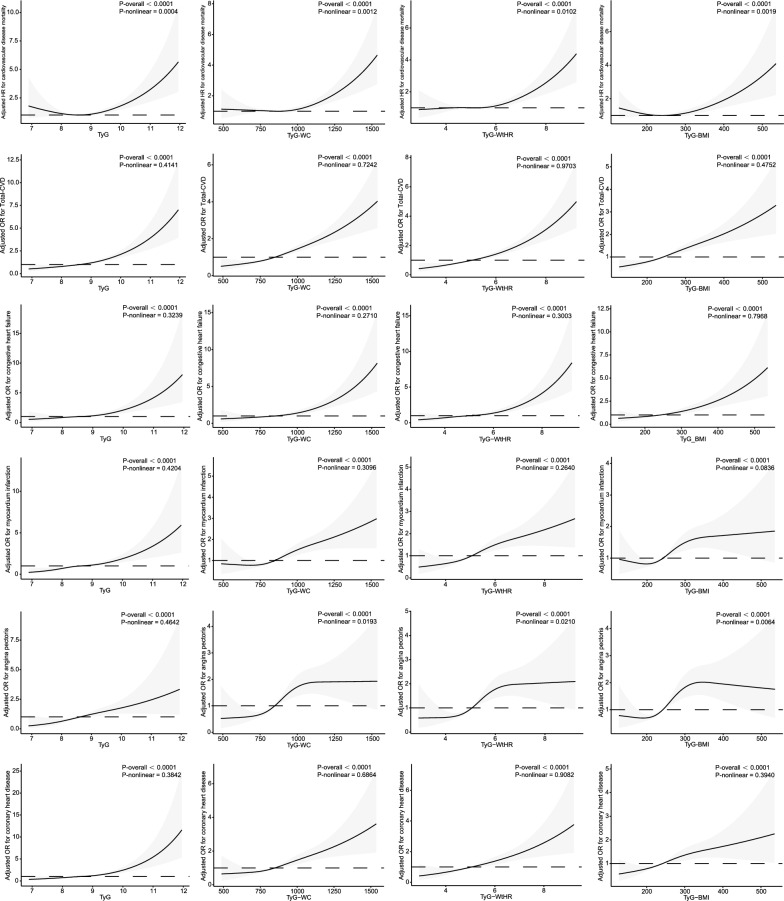
Results: In this study, except for no significant association between TyG and CVD mortality, TyG, TyG-WC, TyG-WHtR, and TyG-BMI were significantly and positively associated with CVD and CVD mortality. TyG-WHtR is the strongest predictor of CVD mortality (HR 1.66, 95% CI 1.21-2.29). The TyG index correlated better with the risk of coronary heart disease (OR 2.52, 95% CI 1.66-3.83). TyG-WC correlated best with total CVD (OR 2.37, 95% CI 1.77-3.17), congestive heart failure (OR 2.14, 95% CI 1.31-3.51), and angina pectoris (OR 2.38, 95% CI 1.43-3.97). TyG-WHtR correlated best with myocardial infarction (OR 2.24, 95% CI 1.45-3.44). RCS analyses showed that most of the above relationships were linear (P-overall < 0.0001, P-nonlinear > 0.05). Otherwise, ROC curves showed that TyG-WHtR and TyG-WC had more robust diagnostic efficacy than TyG. In mediation analyses, glycated hemoglobin mediated in all the above relationships and insulin-mediated in partial relationships.
Conclusions: TyG-WC and TyG-WtHR enhance CVD mortality prediction, diagnostic efficacy of CVD and its mortality, and correlation with some CVD over and above the current hottest TyG. TyG-WC and TyG-WtHR are expected to become more effective metrics for identifying populations at early risk of cardiovascular disease and improve risk stratification.
Keywords: Cardiovascular disease; Cardiovascular disease (CVD) mortality; National Health and Nutrition Examination Survey (NHANES); Triglyceride glucose (TyG); Triglyceride glucose-body mass index (TyG-BMI); Triglyceride glucose-waist circumference (TyG-WC); Triglyceride glucose-waist height ratio (TyG-WHtR).
© 2024. The Author(s).
Conflict of interest statement
The authors declared that they had no competing interests.
Figures
Similar articles
-
Association of triglyceride glucose-related parameters with all-cause mortality and cardiovascular disease in NAFLD patients: NHANES 1999-2018.Cardiovasc Diabetol. 2024 Jul 18;23(1):262. doi: 10.1186/s12933-024-02354-4. Cardiovasc Diabetol. 2024. PMID: 39026233 Free PMC article.
-
The association between triglyceride-glucose index combined with obesity indicators and stroke risk: A longitudinal study based on CHARLS data.BMC Endocr Disord. 2024 Nov 1;24(1):234. doi: 10.1186/s12902-024-01729-8. BMC Endocr Disord. 2024. PMID: 39487484 Free PMC article.
-
The association of triglyceride-glucose index and combined obesity indicators with chest pain and risk of cardiovascular disease in American population with pre-diabetes or diabetes.Front Endocrinol (Lausanne). 2024 Sep 6;15:1471535. doi: 10.3389/fendo.2024.1471535. eCollection 2024. Front Endocrinol (Lausanne). 2024. PMID: 39309107 Free PMC article.
-
Association of body roundness index with cardiovascular disease in patients with cardiometabolic syndrome: a cross-sectional study based on NHANES 2009-2018.Front Endocrinol (Lausanne). 2025 Feb 3;16:1524352. doi: 10.3389/fendo.2025.1524352. eCollection 2025. Front Endocrinol (Lausanne). 2025. PMID: 39963283 Free PMC article. Review.
-
Triglyceride glucose-waist circumference as a predictor of mortality and subtypes of cardiovascular disease: a systematic review and meta-analysis.Diabetol Metab Syndr. 2025 Feb 15;17(1):59. doi: 10.1186/s13098-025-01616-9. Diabetol Metab Syndr. 2025. PMID: 39955571 Free PMC article. Review.
Cited by
-
Association between triglyceride glucose index-related indices with gallstone disease among US adults.Lipids Health Dis. 2024 Jun 27;23(1):203. doi: 10.1186/s12944-024-02194-x. Lipids Health Dis. 2024. PMID: 38937793 Free PMC article.
-
Association of non-insulin-dependent insulin resistance indices with lower limb artery restenosis after drug-coated balloon angioplasty.Lipids Health Dis. 2024 Dec 18;23(1):403. doi: 10.1186/s12944-024-02394-5. Lipids Health Dis. 2024. PMID: 39696298 Free PMC article.
-
A comparison between lipid-based vs. glycemic-based insulin sensitivity indices for the association with abnormal ECG findings and 20-year mortality among older adults.Cardiovasc Diabetol. 2024 Dec 18;23(1):438. doi: 10.1186/s12933-024-02533-3. Cardiovasc Diabetol. 2024. PMID: 39696234 Free PMC article.
-
Association between triglyceride-glucose index and the risk of stroke among moyamoya patients: a single-center retrospective study.Front Neurol. 2025 Mar 14;16:1547627. doi: 10.3389/fneur.2025.1547627. eCollection 2025. Front Neurol. 2025. PMID: 40162010 Free PMC article.
-
Evaluating the Prognostic Value of the Triglyceride-Glucose Index in Different Populations: A Critical Analysis.Nutrients. 2025 Mar 24;17(7):1124. doi: 10.3390/nu17071124. Nutrients. 2025. PMID: 40218882 Free PMC article.
References
-
- Faerch K, Vaag A, Holst J, Hansen T, Jørgensen T, Borch-Johnsen K. Natural history of insulin sensitivity and insulin secretion in the progression from normal glucose tolerance to impaired fasting glycemia and impaired glucose tolerance: the Inter99 study. Diabetes Care. 2009;32(3):439–444. doi: 10.2337/dc08-1195. - DOI - PMC - PubMed
Publication types
MeSH terms
Substances
Grants and funding
LinkOut - more resources
Full Text Sources
