. 2024 Jan 6;15(1):330.
doi: 10.1038/s41467-023-44683-0.

Blood DNA methylation profiling identifies cathepsin Z dysregulation in pulmonary arterial hypertension

Affiliations

Blood DNA methylation profiling identifies cathepsin Z dysregulation in pulmonary arterial hypertension

Anna Ulrich et al. Nat Commun. .

Abstract

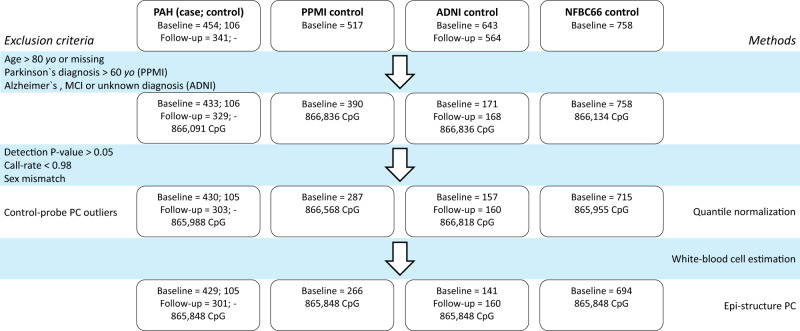
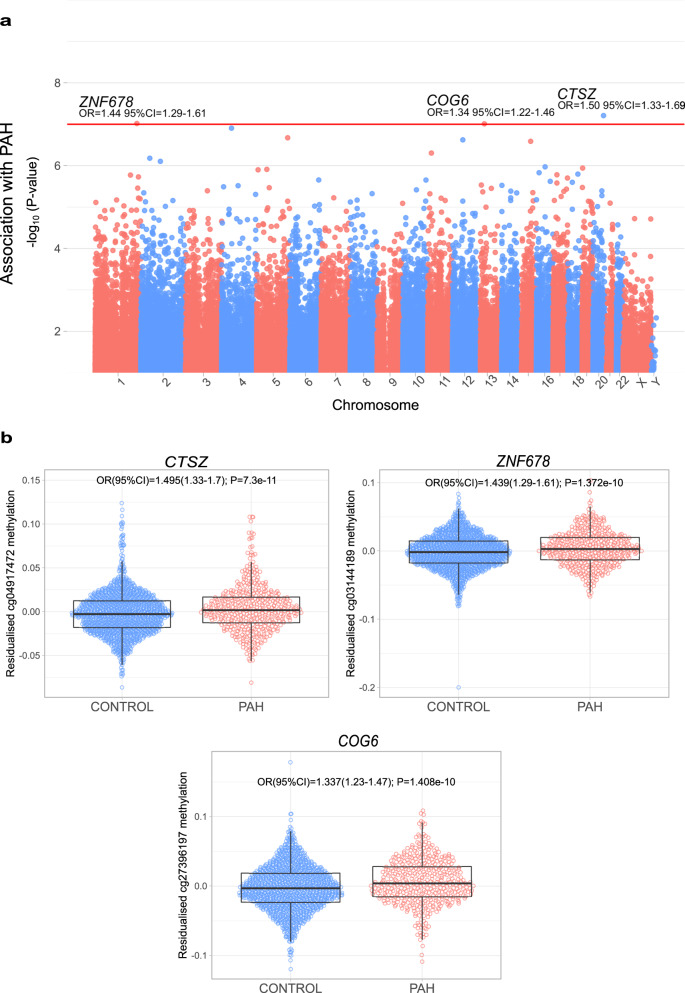
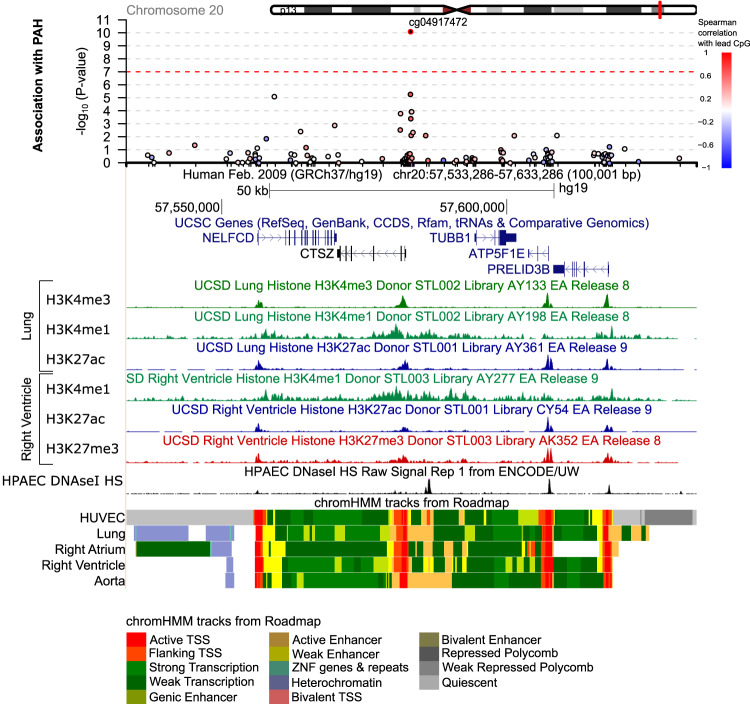
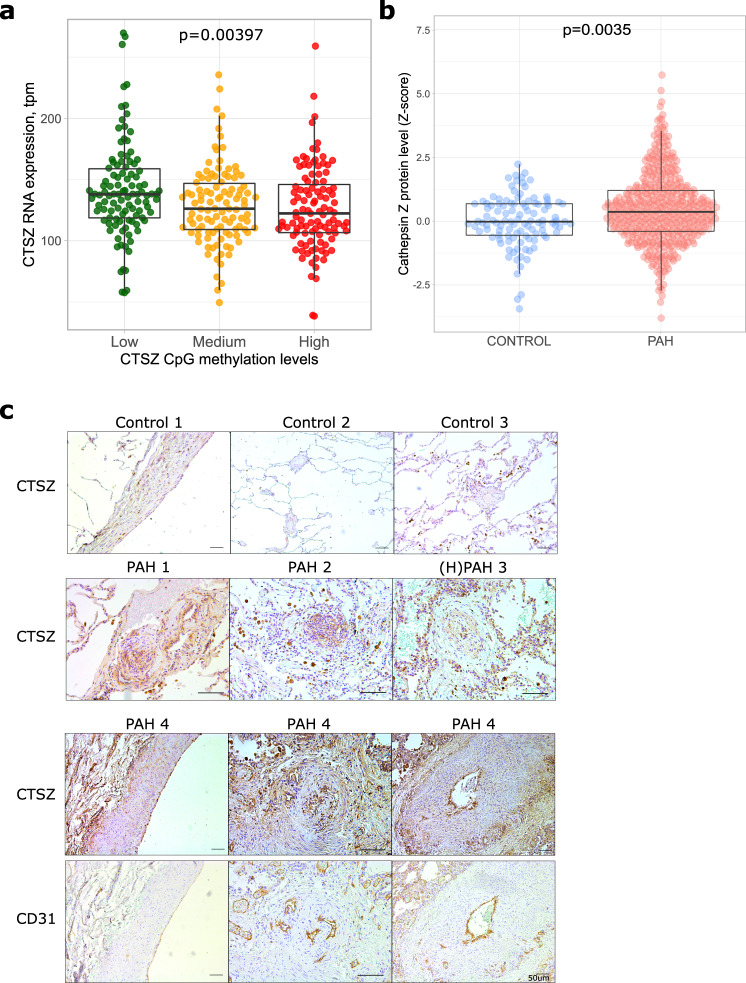
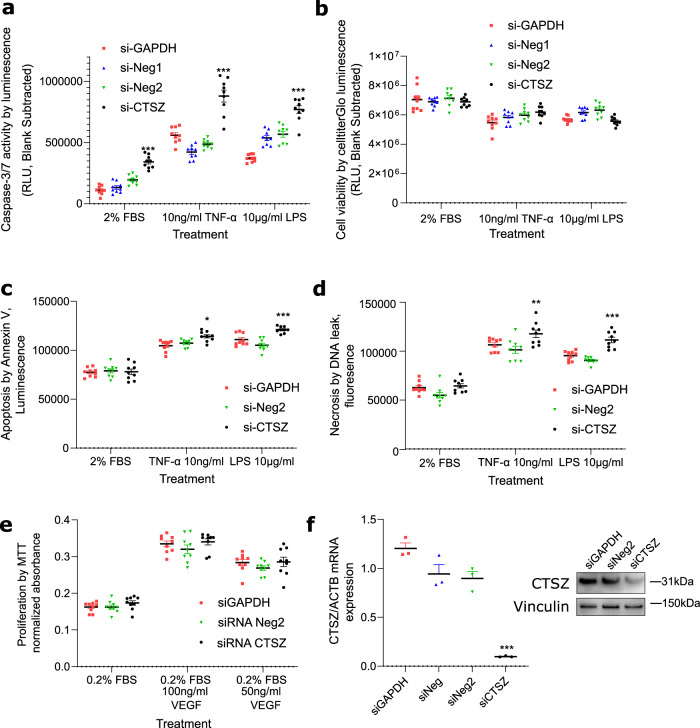
Pulmonary arterial hypertension (PAH) is characterised by pulmonary vascular remodelling causing premature death from right heart failure. Established DNA variants influence PAH risk, but susceptibility from epigenetic changes is unknown. We addressed this through epigenome-wide association study (EWAS), testing 865,848 CpG sites for association with PAH in 429 individuals with PAH and 1226 controls. Three loci, at Cathepsin Z (CTSZ, cg04917472), Conserved oligomeric Golgi complex 6 (COG6, cg27396197), and Zinc Finger Protein 678 (ZNF678, cg03144189), reached epigenome-wide significance (p < 10-7) and are hypermethylated in PAH, including in individuals with PAH at 1-year follow-up. Of 16 established PAH genes, only cg10976975 in BMP10 shows hypermethylation in PAH. Hypermethylation at CTSZ is associated with decreased blood cathepsin Z mRNA levels. Knockdown of CTSZ expression in human pulmonary artery endothelial cells increases caspase-3/7 activity (p < 10-4). DNA methylation profiles are altered in PAH, exemplified by the pulmonary endothelial function modifier CTSZ, encoding protease cathepsin Z.


Conflict of interest statement

The authors declare no competing interests.

Figures

Fig. 1
Fig. 1. DNA methylation data quality control. Raw DNAme data from the PAH Cohort Study and three external datasets were processed following the published CPACOR pipeline.
ADNI Alzheimer’s Disease Neuroimaging Initiative, NFBC1966 Northern Finland Birth Cohort 1966, PPMI Parkinson’s Progression Markers Initiative, MCI mild cognitive impairment, PC principal component.
Fig. 2
Fig. 2. Epigenome-wide association study (EWAS) of PAH.
a Manhattan plot of EWAS of PAH. DNAme markers are ordered according to their genomic positions along the x-axis. Inflation-adjusted P-values for the CpG marker effect are plotted along the y-axis on the -log10 scale. The red horizontal line corresponds to the epigenome-wide significance threshold of P < 10−7 with annotated markers reaching this threshold. b Methylation levels of the three PAH-associated DNAme markers in 429 individuals with PAH and 1226 controls. Residuals of CpG methylation levels after adjusting for covariates in the EWAS are plotted along the y-axis. Boxplots show the median, interquartile range (IQR) and whiskers extend to 1.5 times the IQR. PAH odds ratio (OR) and 95% confidence intervals from multivariable regression analyses are shown, with unadjusted p-values in b.
Fig. 3
Fig. 3. Genomic region containing the significant DNAme marker near CTSZ identified by the epigenome-wide association study (EWAS).
A 50-kilobase region on either side of the top DNAme marker (cg04917472) are shown. Each circle represents a DNAme marker coloured by its correlation value with the top DNAme marker (only markers with significant [P < 0.05] Spearman’s rank correlation coefficients are coloured; red-positive, blue-negative). Epigenomic data in endothelial cells including pulmonary artery endothelial cells (HPAEC) and human umbilical vein-derived endothelial cells (HUVEC), lung and the right heart indicate areas likely to contain active regulatory regions and promoters. Markers include histone H3 lysine 4 monomethylation (H3K4Me1; often found in enhancers) and trimethylation (H3K4Me3; strongly observed in promoters) and H3 lysine 27 acetylation (H3K27Ac; often found in active regulatory regions). Auxiliary hidden Markov models, which summarise epigenomic data to predict the functional status of genomic regions in different tissues or cells, are shown (chromHMM). Red marks signal active transcription start sites. Annotation data were extracted from the UCSC website,. The UCSC Session URL is available in the Supplementary Materials section.
Fig. 4
Fig. 4. Cathepsin Z in PAH patients.
a Blood RNA CTSZ levels in PAH patients divided by CTSZ CpG methylation status n = 276 patients were divided into tertiles of CpG methylation levels for comparison with mRNA levels by Kruskal–Wallis one way ANOVA. b Plasma levels of cathepsin Z in PAH versus controls, Logistic regression models used to test the effect of cathepsin Z on PAH were adjusted for age, sex, first two principal components and coagulation factor X. n = 463 PAH cases and 108 disease-free controls. Boxplots depict median, first and third quartiles (Q1/Q3 = IQR), and whiskers indicate Q1/Q3 +/− 1.5 * IQR. c Immunohistochemistry of CTSZ in PAH lung tissue. CD31 is shown as a marker for endothelium. N = 3 vs 4 control and PAH patient tissue sections. Scale bar represents 50um.
Fig. 5
Fig. 5. CTSZ effect on hPAEC function by siRNA manipulation.
a Apoptosis activation measured by caspase-3/7 activity in hPAEC following siRNA plus vehicle or indicated pro-inflammatory treatments. b Cell viability measured by CellTiterGlo assay in hPAEC 48 h following siRNA treatment and 24 h in 2%FBS-ECM plus vehicle or indicated treatments to match caspase assay. c Apoptosis and d necrosis measured by Annexin V cell surface binding and DNA leak. *P < 0.05, **P < 0.01, ***P < 0.001 versus both control siRNAs. e Proliferation estimated by metabolically active cells in MTT assay following siRNA treatment. n = 9 independent cultures from 3 independent experiments for ae. f CTSZ expression (compared to loading controls vinculin and beta-actin) following siRNA knockdown in hPAEC by immunoblot and qPCR. siNeg negative control scrambled siRNAs, siGAPDH control siRNA targeting GAPDH. n = 3 cell cultures from 3 independent experiments. Bars indicate mean and SEM. One way ANOVA with Dunnett’s posthoc tests corrected for multiple comparisons in all figures. ***p < 0.0001 vs. other siRNAs within treatment group.

References

    1. Hoeper MM, et al. A global view of pulmonary hypertension. Lancet Respir. Med. 2016;4:306–322. doi: 10.1016/S2213-2600(15)00543-3. - DOI - PubMed
    1. Hassoun PM. Pulmonary Arterial Hypertension. N. Engl. J. Med. 2021;385:2361–2376. doi: 10.1056/NEJMra2000348. - DOI - PubMed
    1. Lau EMT, Giannoulatou E, Celermajer DS, Humbert M. Epidemiology and treatment of pulmonary arterial hypertension. Nat. Rev. Cardiol. 2017;14:603–614. doi: 10.1038/nrcardio.2017.84. - DOI - PubMed
    1. Larkin EK, et al. Longitudinal Analysis Casts Doubt on the Presence of Genetic Anticipation in Heritable Pulmonary Arterial Hypertension. Am. J. Respir. Crit. Care Med. 2012;186:892–896. doi: 10.1164/rccm.201205-0886OC. - DOI - PMC - PubMed
    1. Liu D, et al. Hypermethylation of BMPR2 Promoter Occurs in Patients with Heritable Pulmonary Arterial Hypertension and Inhibits BMPR2 Expression. Am. J. Respir. Crit. Care Med. 2017;196:925–928. doi: 10.1164/rccm.201611-2273LE. - DOI - PubMed

Publication types