. 2024 Jan 6;9(1):8.
doi: 10.1038/s41541-023-00793-w.

Absolute quantitation of binding antibodies from clinical samples

Affiliations

Absolute quantitation of binding antibodies from clinical samples

Chan Tang et al. NPJ Vaccines. .

Abstract

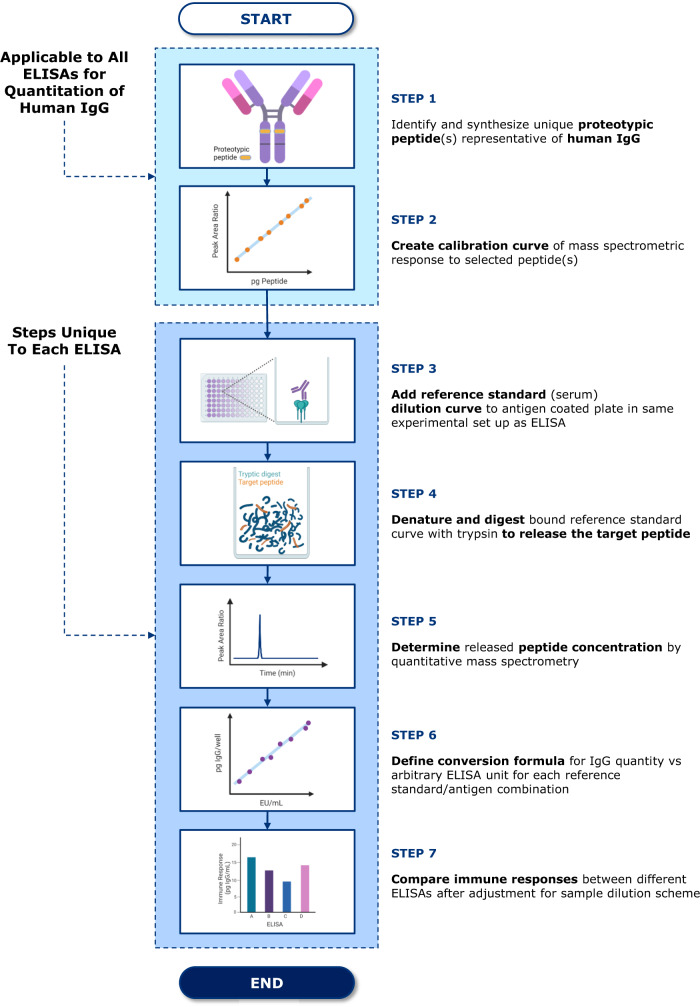
The quantitation of antibody responses is a critical requirement for the successful development of vaccines and therapeutics that often relies on the use of standardized reference materials to determine relative quantities within biological samples. The validity of comparing responses across assays using arbitrarily defined reference values is therefore limited. We developed a generalizable method known as MASCALE (Mass Spectrometry Enabled Conversion to Absolute Levels of ELISA Antibodies) for absolute quantitation of antibodies by calibrating ELISA reference sera using mass spectrometry. Levels of proteotypic peptides served as a proxy for human IgG, allowing the conversion of responses from arbitrary values to absolute amounts. Applications include comparison of binding assays at two separate laboratories and evaluation of cross-clade magnitude-breadth responses induced by an investigational HIV-1 vaccine regimen. MASCALE addresses current challenges in the interpretation of immune responses in clinical trials and expands current options available to make suitable comparisons across different settings.


Conflict of interest statement

All authors are/were employees of Janssen when this work was performed and may hold Johnson & Johnson stock or stock options. J.S., A.V., D.J.S., E.S.-V., and T.vdK. are named inventors on a pending patent application for the methodology described (WO2022180212A).

Figures

Fig. 1
Fig. 1. Mass spectrometry enabled conversion to absolute levels of ELISA antibodies—MASCALE—method outline.
Step 1: Identification and synthesis of proteotypic peptide(s) representative of human IgG. Peptides selected are unique to human IgG, have favorable mass spectrometry characteristics and are detectable from tryptic digests. Step 2: Construction of calibration curve(s) by mass spectrometry for peptide(s) selected in Step 1. Peptide calibration curves establish the linear relationship between peptide quantity and mass spectrometric signal expressed as peak area ratio. Steps 1 and 2 apply to all ELISAs where human IgG is to be quantified via the MASCALE method. Step 3: Binding of ELISA reference standard samples to coated antigen. The binding of the reference standard dilution curve to coated antigen is performed using the same experimental procedure and format as done for sample analysis, followed by a wash step to remove unbound antibodies and other serum components. Step 4: Sample denaturation and tryptic digestion. Antigen-antibody complexes are denatured and digested releasing target peptide(s). Step 5: Quantitation of target peptide(s) by mass spectrometry. Tryptic digests are subjected to targeted quantitative mass spectrometry and peptide quantity in the sample is determined using the peptide calibration curve generated in Step 2. Step 6: Generation of MASCALE conversion formula. The linear relationship between total log10 IgG (peptide) quantity per ELISA well and assigned log10 arbitrary unit is established. Step 7: Comparison of immune responses. Reportable values generated from samples assessed in the ELISA are converted from concentrations in arbitrary units to absolute units after applying the corresponding conversion formula from Step 6 and adjusting for sample dilution scheme of the respective ELISA.
Fig. 2
Fig. 2. MASCALE method implementation for cross-laboratory assay transfer and cross-antigen comparisons.
a Unique peptide representative of human IgG1, IgG3, and IgG4 highlighted in the CH2 domain (orange) on the structure of human IgG1 (PDB ID: 1HZH). Peptides unique to human IgG1, IgG3, and IgG4 (VVSVLTVLHQDWLNGK) and human IgG2 (VVSVLTVVHQDWLNGK) are used to quantify total bound IgG in the reference standard samples. b Peptide calibration by mass spectrometry. Target peptide calibration curve for peptide VVSVLTVLHQDWLNGK (pink) representative of human IgG1, IgG3, and IgG4 and peptide VVSVLTVVHQDWLNGK representative of human IgG2 (gray) are generated for downstream quantitation of antigen-specific binding antibodies in ELISA performed in Laboratory 1 demonstrating relationship between peptide quantity and mass spectrometric readout in peak area ratio (light/heavy isotope). c Relationship between total antigen-specific IgG concentration in ELISA reference standard samples and assigned arbitrary values in EU/mL. Conversion formulas are generated for ELISAs performed at Laboratory 1 (green) and Laboratory 2 (orange) by linear regression to obtain slope and intercept values. d Cross-laboratory comparison of clade C (C97ZA)-specific ELISA responses in arbitrary (EU/mL; left) and absolute (pg IgG/mL; right) units following conversion of data using the MASCALE method. Results from 4 clinical studies (APPROACH: light blue, ASCENT: dark blue, IMBOKODO: light pink, TRAVERSE: purple) can be appropriately compared across laboratories once immune responses are converted into absolute values. Bars represent geometric mean and 95% confidence interval. Dotted lines represent the lower limit of quantification (LLOQ) or upper limit of quantification (ULOQ) for the respective assay. e Cross-laboratory correlation of ELISA responses from 4 clinical studies (A004: light blue, ASCENT: dark blue, IMBOKODO: light pink, TRAVERSE: purple) in absolute units (log10 pg IgG/mL). Dotted lines represent the lower limit of quantification (LLOQ) or upper limit of quantification (ULOQ) for the respective assay. Solid line represents the unit line. f Low (LQC: blue), Medium (MQC: brown) and High (HQC: green) Quality Control sample responses quantified in absolute units (pg IgG/mL, left axis) for RSV subtype A (A2) and B (B17) prefusion F ELISAs. The corresponding arbitrary response in EU/L is shown on the right axis. The mean result from >60 replicates across multiple runs is shown. Bars represent the assay acceptance criteria, calculated as the 95% β-expectation tolerance intervals for the QC sample.
Fig. 3
Fig. 3. Selection and characterization of representative acute HIV-1 Env antigen panel selected for sequence diversity in clade B and C.
a Selection of clade B strains shown on phylogenetic tree of acute clade B sequences available in the Los Alamos National Laboratory (LANL) database (top). Amino acid coverage of the selected clade B strains modeled on the crystal structure of HIV-1 Env relative to the consensus clade B sequence (bottom). Circles represent parts of the hypervariable loop visible in the crystal structure. b Selection of clade C strains shown on phylogenetic tree of all clade C sequences available in the LANL database (top). Strains were selected from a panel of acute clade C viruses in Southern Africa (Rademeyer panel; red) and included in addition reference strains with acceptable expression profiles. Amino acid coverage of the selected clade C strains modeled on the crystal structure of HIV-1 Env is compared to the consensus clade C sequence (bottom). Circles represent parts of the hypervariable loop visible in the crystal structure. Scale bar corresponds to 0.200 proportion amino acid difference. c Structure-based stabilizing mutations highlighted on the crystal structure of the HIV-1 Env protein. SOSIP mutations are highlighted in blue. Stabilizations used in combination with consensus repair methodology (RNS) are shown in pink. Scale bar corresponds to 0.200 proportion amino acid difference. d Size-exclusion chromatography profiles for HIV-1 Env clade B and clade C antigen panel. Purified proteins show largely uniform trimeric content, with occasional hexamer contributions for some clade B strains. e Heatmap showing polyclonal serum binding responses to HIV-1 Env antigen panel assessed by ELISA. Antigens were characterized using a panel of commercially sourced sera from HIV-1-infected individuals. Average log10 endpoint titers were plotted. f Heatmap showing monoclonal antibody binding responses to HIV-1 Env antigen panel assessed by ELISA. Antigens were characterized using a panel of HIV-1 Env-specific monoclonal antibodies. Average log10 endpoint titers were plotted.
Fig. 4
Fig. 4. Application of MASCALE method for determination of magnitude-breadth responses from ASCENT to a panel of representative clade B and clade C HIV-1 Env antigens.
a Magnitude-breadth plot for clade B and clade C arbitrary EU/mL responses for participants from the ASCENT HIV-1 vaccine clinical study assessed at peak immunogenicity (week 52). Individual and population-level (bold) clade B and clade C responses based on the average magnitude-breadth across all participants evaluated are shown (clade B: blue; clade C: green). A Wilcoxon log-rank test was applied to the area under the curve (AUC) for clade B and clade C and the resultant P value is shown. b Conversion formulas showing relationship between EU/mL arbitrary values and pg IgG/well absolute values for the reference standard of each ELISA in the HIV-1 Env antigen panel. Formulas were derived by linear regression showing slope, intercept and R2 values. c Magnitude-breadth plot for clade B and clade C absolute pg IgG/mL responses for participants from the ASCENT HIV-1 vaccine clinical study assessed at peak immunogenicity (week 52). Individual and population-level (bold) clade B and clade C responses based on the average magnitude breadth across all participants evaluated are shown (clade B: blue; clade C: green). A Wilcoxon log-rank test was applied to the area under the curve (AUC) for clade B and clade C and the resultant P value is shown. d Correlation between clade B and clade C magnitude-breadth responses per participant assessed with the HIV-1 Env ELISA panel. The associated Pearson correlation coefficient is shown.

References

    1. Kabat, E. A. & Mayer, M. M. Experimental Immunochemistry, 2d edn (Thomas, 1961).
    1. Heidelberger M, Kendall FE. A quantitative theory of the precipitin reaction: Ii. a study of an azoprotein-antibody system. J. Exp. Med. 1935;62:467–483. doi: 10.1084/jem.62.4.467. - DOI - PMC - PubMed
    1. Bailey, G. S. In The Protein Protocols Handbook (ed. Walker, J. M.) 753–755 (Humana Press, 1996).
    1. Gaytan-Alcocer M. [Laser nephelometry. A better methodology?] Arch. Investig. Med. 1990;21:79–86. - PubMed
    1. Tichy M. A comparison of methods of monoclonal immunoglobulin quantitation. Neoplasma. 1985;32:31–36. - PubMed