. 2024 Feb;43(9):650-667.
doi: 10.1038/s41388-023-02933-x. Epub 2024 Jan 6.

DMT1-dependent endosome-mitochondria interactions regulate mitochondrial iron translocation and metastatic outgrowth

Affiliations

DMT1-dependent endosome-mitochondria interactions regulate mitochondrial iron translocation and metastatic outgrowth

Jonathan Barra et al. Oncogene. 2024 Feb.

Abstract

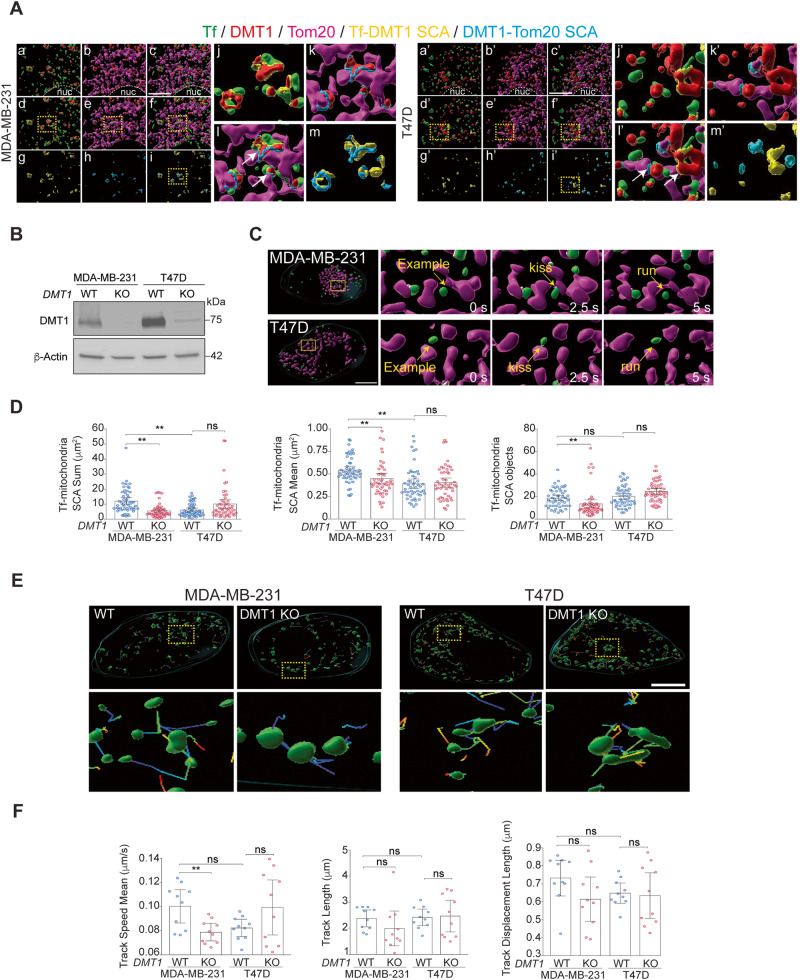
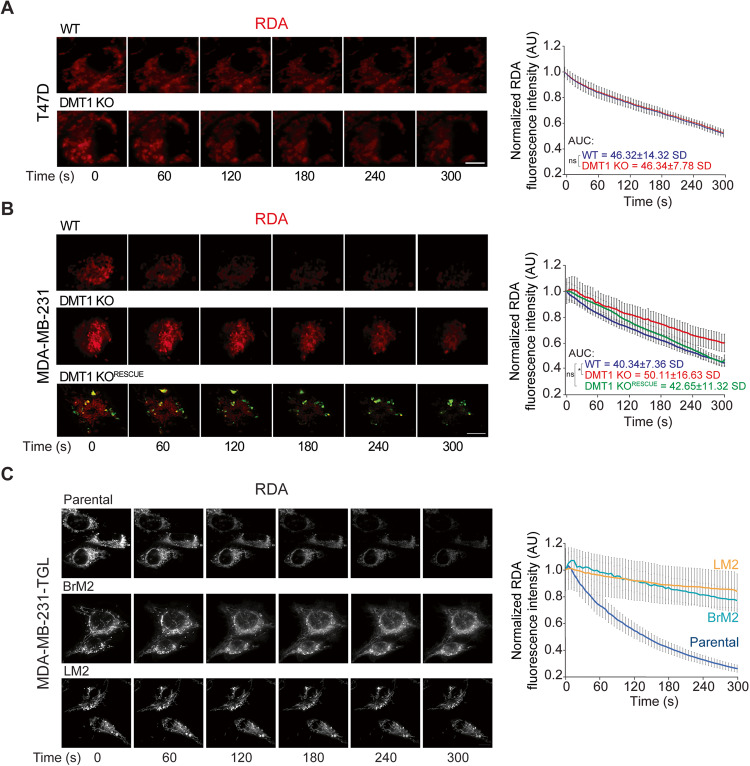
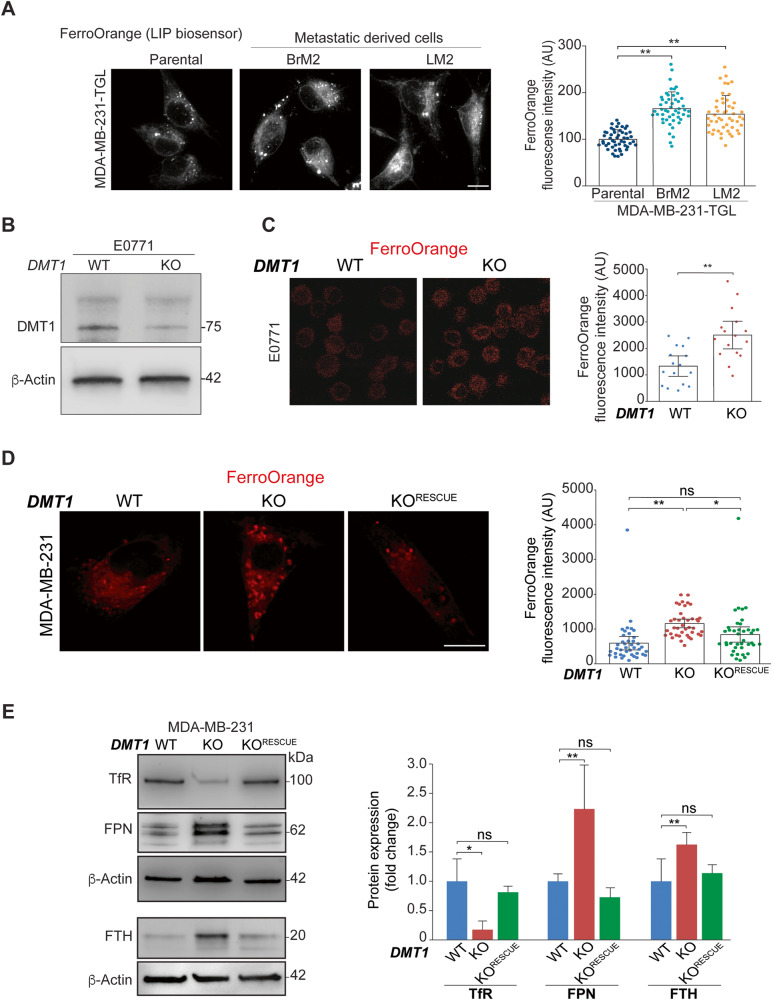
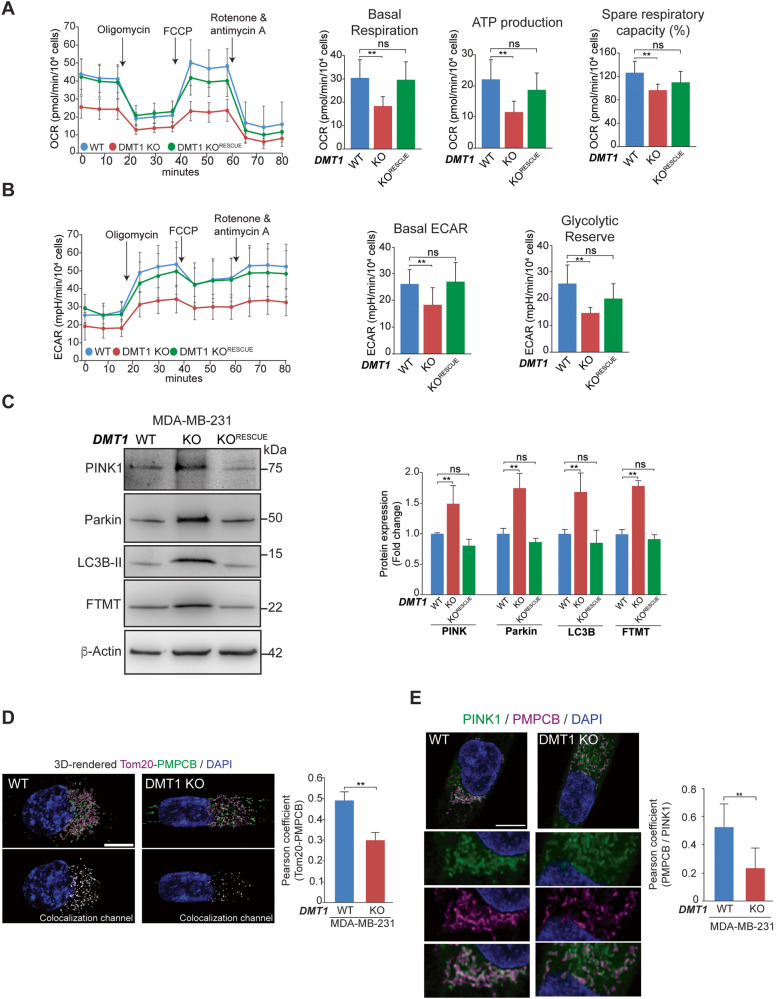
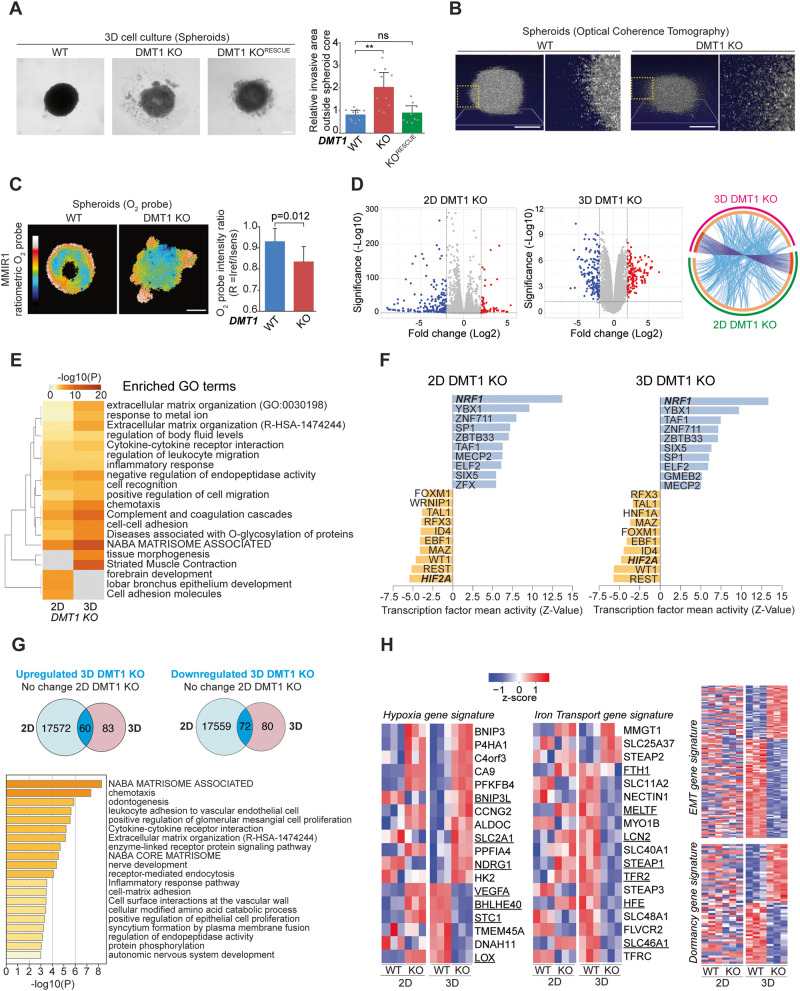
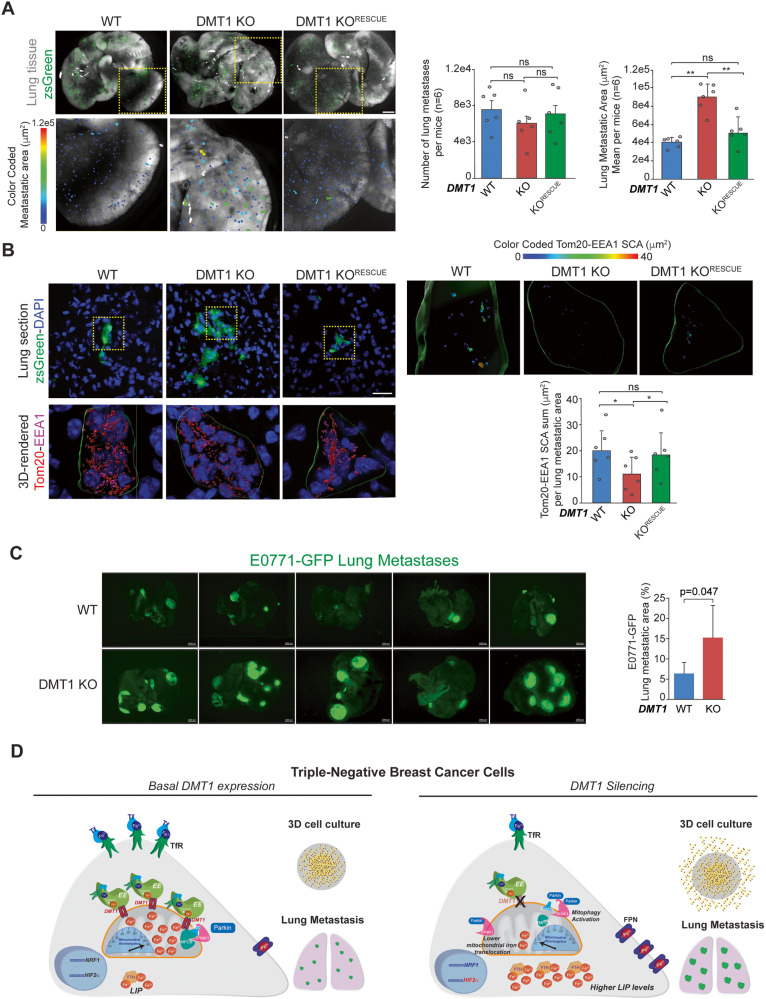
Transient early endosome (EE)-mitochondria interactions can mediate mitochondrial iron translocation, but the associated mechanisms are still elusive. We showed that Divalent Metal Transporter 1 (DMT1) sustains mitochondrial iron translocation via EE-mitochondria interactions in triple-negative MDA-MB-231, but not in luminal A T47D breast cancer cells. DMT1 silencing increases labile iron pool (LIP) levels and activates PINK1/Parkin-dependent mitophagy in MDA-MB-231 cells. Mitochondrial bioenergetics and the iron-associated protein profile were altered by DMT1 silencing and rescued by DMT1 re-expression. Transcriptomic profiles upon DMT1 silencing are strikingly different between 2D and 3D culture conditions, suggesting that the environment context is crucial for the DMT1 knockout phenotype observed in MDA-MB-231 cells. Lastly, in vivo lung metastasis assay revealed that DMT1 silencing promoted the outgrowth of lung metastatic nodules in both human and murine models of triple-negative breast cancer cells. These findings reveal a DMT1-dependent pathway connecting EE-mitochondria interactions to mitochondrial iron translocation and metastatic fitness of breast cancer cells.


Conflict of interest statement

The authors declare no competing interests.

Figures

Fig. 1
Fig. 1. DMT1 bridges EE and mitochondria and regulates their inter-organelle contacts in MDA-MB-231 but not in T47D breast cancer cells.
A MDA-MB-231 (a–m) and T47D (a’–m’) cells were subjected to fluorescently labeled-Tf uptake (green) via a short pulse-chase protocol to load the early endosomes followed by immunofluorescence analysis of DMT1 (red), and Tom20 (magenta). Fluorescent z-stacks images were deconvoluted using the integrated small volume computational clearing (SVCC) algorithm in the Leica Thunder microscope and then 3D rendered using Imaris software 9.6 (Bitplane). Inter-organelle contacts between Tf-containing EE-DMT1 (yellow) and DMT1-Tom20 (light blue) were calculated using the “Surface Contact Area” (SCA) Imaris XTension integrated plugin. Representative images are shown for Tf and DMT1 (a, a’); DMT1 and Tom20 (b, b’); Tf, DMT1, and Tom20 (c, c’); Tf, DMT1 and Tf-DMT1 SCA (d, d’); DMT1, Tom20 and DMT1-Tom20 SCA (e, e’); Tf, DMT1, Tom20, Tf-DMT1 SCA and DMT1-Tom20 SCA (f, f’); Tf-DMT1 SCA (g, g’); DMT1-Tom20 SCA (h, h’); Tf-DMT1 SCA and DMT1-Tom20 SCA (i, i’). Regions-of-interest indicated by dotted squares shown in (d–f & i; d’–f’ & i’) are shown upon magnification in (j–m and j’–m’), respectively. A lower association between EE-DMT1 and Tom20-DMT1 SCAs in T47D vs. MDA-MB-231 is observed. Nuc = nucleus; Scale bar = 10 μm. B Immunoblot shows CRISPR/Cas9 mediated DMT1 silencing in indicated cell lines. β-actin immunoblot is shown as a loading control. C MDA-MB-231 (top) and T47D (bottom) cells were subjected to fluorescently labeled-Tf uptake (green) via a short pulse-chase protocol to load the early endosomes followed by time-lapse live cell imaging using Thunder microscopy with SVCC deconvolution algorithm. Examples of 3D reconstructions of fluorescently labeled Tf-containing EE (green), Mitotracker-labeled mitochondria (magenta), and Tf-containing EE-mitochondria SCA (white) from time-lapse live-cell imaging experiments (interval 2.5–3 s, 4 frames per second, total time 45 s) show examples of “kiss-and-run” EE-mitochondria interactions (arrows) in MDA-MB-231 and T47D cells. Images were analyzed using Imaris 9.6 software. Scale bar = 10 μm. D Tf-containing EE-mitochondria SCA sum (left panel), mean (middle panel), and the number of objects (right panel) in MDA-MB-231 and T47D WT and DMT1 KO are shown. A significant decrease in the total amount of EE-mitochondria SCA sum and mean per cell is observed upon DMT1 silencing in MDA-MB-231 but not in T47D. Parameters were calculated using data from 10 individual cells in 5 consecutive time intervals per condition and analyzed separately (n = 50). One-way ANOVA with Bonferroni post-hoc test. **p < 0.01. ns: non-significant (p > 0.05). E Top row shows representative images displaying Tf-containing EE and their respective endosomal tracks obtained from live cell imaging experiments described above. Yellow dotted squares indicate the corresponding magnified regions shown in the bottom row. F Fluorescent z-stack images were 3D rendered and analyzed using IMARIS 9.6 software to quantify endosomal track speed mean, track length, and track displacement length per cell (n = 10 cells). One-way ANOVA with Bonferroni post-hoc test. **p < 0.01. ns: non-significant (p > 0.05). Scale bar = 10 μm.
Fig. 2
Fig. 2. DMT1 regulates mitochondrial iron translocation in MDA-MB-231 cells.
A T47D and B MDA-MB-231 cells were incubated with RDA (a biosensor that localizes to mitochondria and undergoes rapid quenching upon mitochondrial iron translocation) for 15 min and then subjected to live cell imaging. Fluorescence images (left) and normalized fluorescence quantification graphs (right) show RDA dequenching levels from 0 to 300 s (s). RDA fluorescence intensity decay was analyzed using ImageJ in 20 cells per condition. Unpaired t-test and ANOVA with Bonferroni post-hoc test were used for statistical analysis of the area under the curve (AUC) in each condition (*p < 0.05). In MDA-MB-231, but not in T47D, DMT1 ablation induces a significant delay in RDA dequenching indicating lower mitochondrial iron translocation. DMT1-GFP re-expression in DMT1 KO cells (DMT1 KORESCUE) significantly rescued the decrease in mitochondrial iron translocation in DMT1 KO cells. Scale bar = 10 μm. C Parental MDA-MB-231-TGL cells and its metastatic derived clones (Brain, BrM2 and Lung, LM2) were incubated with RDA for 15 min and then subjected to time-lapse live cell imaging using Thunder microscopy with integrated SVCC algorithm. Fluorescent images (left) and normalized fluorescence quantification graph (right) show RDA dequenching levels from 0 to 300 s. Metastatic-derived cell lines MDA-MB-231-TGL BrM2 and LM2 RDA-fluorescence intensity decay was analyzed using ImageJ software in 20 cells per condition. Scale bar = 10 μm.
Fig. 3
Fig. 3. DMT1 regulates LIP and the expression levels of iron transport-related proteins in triple-negative breast cancer cells.
A Fluorescent images (left) and normalized fluorescence quantification graphs (right) of LIP biosensor FerroOrange dye in metastatic derived cells (Brain, BrM2 and Lung, LM2) and parental MDA-MB-231-TGL cells. The graph shows the quantification of fluorescence intensity in arbitrary units (AU). Metastatic-derived cell lines MDA-MB-231-TGL BrM2 and LM2 show significant increases in LIP levels compared to parental cells. FerroOrange fluorescence intensity was analyzed using ImageJ software in 40 cells per condition. One-way ANOVA with Bonferroni post-hoc test. **p < 0.01. ns: non-significant. Scale bar = 10 μm. B Immunoblot showing DMT1 silencing in mouse triple-negative breast cancer cell line E0771-GFP. β-Actin was used as a loading control. C Fluorescent images (left) and normalized fluorescence quantification graph (right) of LIP biosensor FerroOrange dye in E0771-GFP cells. The graph shows the quantification of fluorescence intensity in arbitrary units (AU). FerroOrange fluorescence intensity was analyzed using ImageJ software in 15 cells per condition. Unpaired t-test; **p < 0.01. Scale bar = 10 μm. D Fluorescent images (left) and normalized fluorescence quantification graphs (right) of LIP biosensor FerroOrange dye in MDA-MB-231 cells. The graph shows the quantification of fluorescence intensity in arbitrary units (AU). DMT1-GFP re-expression in DMT1 KO cells rescued the LIP increase induced by DMT1 silencing. FerroOrange fluorescence intensity was analyzed using ImageJ software in 40 cells per condition. One-way ANOVA with Bonferroni post-hoc test. *p < 0.05; **p < 0.01. ns: non-significant. Scale bar = 10 μm. E Immunoblot (left) and normalized densitometry quantification graphs (right) (n = 3) showed expression levels of TfR, FPN, and FTH in MDA-MB-231 WT, DMT1 KO, and DMT1 KORESCUE cells. β-Actin was used as a loading control. One-way ANOVA with Bonferroni post-hoc test. *p < 0.05; **p < 0.01. ns: non-significant.
Fig. 4
Fig. 4. DMT1 silencing impairs oxidative/glycolytic mitochondrial metabolism and activates PINK1/Parkin-dependent mitophagy in MDA-MB-231 cells.
A, B Oxygen consumption rate (OCR) and extracellular acidification rate (ECAR) in response to sequential treatment with oligomycin, FCCP, and Rotenone & Antimycin A of MDA-MB-231 WT, DMT1 KO, and DMT1 KORESCUE cells are shown. Data were normalized for the number of cells (40,000 cells/well) that were stained using Hoechst at the end of the assay (n = 3, 6–10 replicates per condition). Basal respiration, ATP production, and spare respiratory capacity were calculated using OCR data. Basal ECAR and glycolytic reserve were calculated using ECAR data. Bar charts: one-way ANOVA with Bonferroni post-hoc test. *p < 0.05; **p < 0.01. ns: non-significant. Scale bar = 100 μm. C Representative immunoblots (left) and normalized densitometry quantification graph (right) of PINK1, Parkin, LC3B-II, and mitochondrial ferritin (FTMT) in MDA-MB-231 WT, DMT1 KO, and DMT1 KORESCUE cells. β-Actin was used as a loading control. Bar charts: one-way ANOVA with Bonferroni post-hoc test (n = 3). *p < 0.05; **p < 0.01. ns: non-significant. D Immunofluorescence of Tom20 and PMPCB shows a decrease in colocalization between both proteins upon DMT1 silencing in MDA-MB-231. Pearson colocalization coefficient was analyzed using IMARIS 9.6 software in 25 cells per condition. Unpaired t-test. **p < 0.01. Scale bar = 10 μm. E Immunofluorescence of PINK1 and PMPCB shows a decrease in colocalization between both proteins, and mitochondrial fragmentation upon DMT1 silencing in MDA-MB-231. Pearson colocalization coefficient was analyzed using IMARIS 9.6 software in 25 cells per condition. Unpaired t-test. **p < 0.01. Scale bar = 10 μm.
Fig. 5
Fig. 5. Functional and transcriptional effects of DMT1 silencing on 3D cell culture conditions.
A Phase contrast images of 3D cell culture spheroids of MDA-MB-231 cells. Relative cellularity outside the spheroid core was quantified in WT, DMT1 KO, and DMT1 KORESCUE cells. Bar chart: one-way ANOVA with Bonferroni post-hoc test (10 spheroids per condition). *p < 0.05; **p < 0.01. ns: non-significant. Scale bar = 200 μm. B Isometric Optical Coherence Tomography (OCT) showing representative images of MDA-MB-231 WT and DMT1 KO spheroids at day 4 in 3D cell culture. Yellow dotted squares indicate the corresponding magnified regions showing higher cell dispersion at the periphery of DMT1 KO spheroids. Scale bar = 200 μm. C Intensity ratio images of MMIR1 probe in WT and DMT1 KO spheroids. The coded color bar represents the image’s MMIR1 O2 probe intensity ratio (R = Iref / Isens) distribution. The bar graph shows the relative oxygenation levels in WT and DMT1 KO spheroids. Unpaired t-test (6 spheroids per condition). Scale bar = 200 μm. D Volcano Plot shows differentially regulated genes upon DMT1 silencing in 2D and 3D cell culture conditions obtained from total RNA sequencing (padj value < 0.05 and fold change log2 > 2). Circos plot showing the overlap by genes and GO terms from 2D DMT1 KO vs. 3D DMT1 KO-differentially regulated genes. Outside arcs indicate the identity of each differentially expressed gene list (green: 2D DMT1 KO; magenta: 3D DMT1 KO). Inside arcs indicate the complete differentially expressed gene list of each condition. The dark orange section indicates the genes that appear in both lists and the light orange section indicates genes that are not shared between gene lists. Purple lines link the same genes that are shared in both gene lists. Blue lines link the genes sharing the same GO term. E Gene set enrichment analysis (Biological Processes Gene Ontology) using significant upregulated and downregulated genes. Heatmap showing top positively and negatively enriched gene sets ranked by FDR q-values. F ISMARA analysis shows a specific increase (purple) and decrease (green) in transcription factor activity (Z-value). G Venn diagrams showing the overlap between upregulated and downregulated genes versus no-change in 2D genes upon DMT1 KO in 3D cell culture conditions. Gene Ontology analysis (Biological Processes) of upregulated and downregulated genes upon DMT1 KO in 3D culture conditions. H Heatmap of gene expression values for significantly downregulated and upregulated genes for either breast cancer hypoxia, iron transport, EMT, and dormancy gene signatures upon DMT1 silencing in 2D and 3D cell culture conditions.
Fig. 6
Fig. 6. DMT1 silencing increases the lung metastatic outgrowth of triple-negative breast cancer cells in vivo.
A Left, images of lungs harvested after three weeks from NSG mice tail vein injected with ZsGreen labeled MDA-MB-231 WT, DMT1 KO, and DMT1 KORESCUE cells. Right, bar graphs show the number and the area of lung metastatic lesions in each condition (n = 6 mice per condition). Scale bar = 2 mm. B Left, immunofluorescence of Tom20 (red) and EEA1 (magenta) in lung micrometastasis cryosections of mice evaluated in A. Right, the sum of SCA between both markers per lung metastasis in 6 lesions per condition was color-coded (top) and quantified (bottom). C Left, images of lungs harvested after three weeks from C57BL/6 mice tail vein injected with GFP-labeled E0771-GFP cells. Right, bar graph shows the area of lung metastatic lesions in each condition (n = 5 mice per condition). An unpaired t-test was used for comparison between the two conditions. Scale bar = 2000 μm. D Working model. DMT1 regulates LIP levels and metastatic outgrowth in triple-negative breast cancer cells. DMT1 downregulation alters iron metabolism by preventing adequate iron translocation into the mitochondria, inducing metabolism alterations, and mitophagy activation through its molecular partner PMPCB-related mechanism, ultimately leading to enhanced metastatic outgrowth in the lung in vivo. This mechanism provides a rationale for a targeted iron metabolism disruption/restoration that may be translated therapeutically.

References

    1. Andrews NC, Schmidt PJ. Iron homeostasis. Annu Rev Physiol. 2007;69:69–85. doi: 10.1146/annurev.physiol.69.031905.164337. - DOI - PubMed
    1. Salnikow K. Role of iron in cancer. Semin Cancer Biol. 2021;76:189–94. doi: 10.1016/j.semcancer.2021.04.001. - DOI - PubMed
    1. Dixon SJ, Stockwell BR. The role of iron and reactive oxygen species in cell death. Nat Chem Biol. 2014;10:9–17. doi: 10.1038/nchembio.1416. - DOI - PubMed
    1. Reczek CR, Chandel NS. The two faces of reactive oxygen species in cancer. Annu Rev Cancer Biol. 2017;1:79–98. doi: 10.1146/annurev-cancerbio-041916-065808. - DOI
    1. Fonseca-Nunes A, Jakszyn P, Agudo A. Iron and cancer risk–a systematic review and meta-analysis of the epidemiological evidence. Cancer Epidemiol Biomark Prev. 2014;23:12–31. doi: 10.1158/1055-9965.EPI-13-0733. - DOI - PubMed

Publication types