. 2024 Jan 6;14(1):708.
doi: 10.1038/s41598-024-51357-4.

Circulating microRNAs from plasma as preclinical biomarkers of epileptogenesis and epilepsy

Affiliations

Circulating microRNAs from plasma as preclinical biomarkers of epileptogenesis and epilepsy

Kinga Szydlowska et al. Sci Rep. .

Abstract

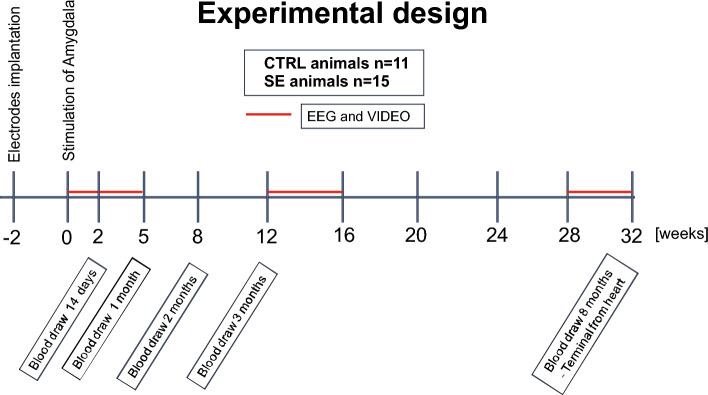
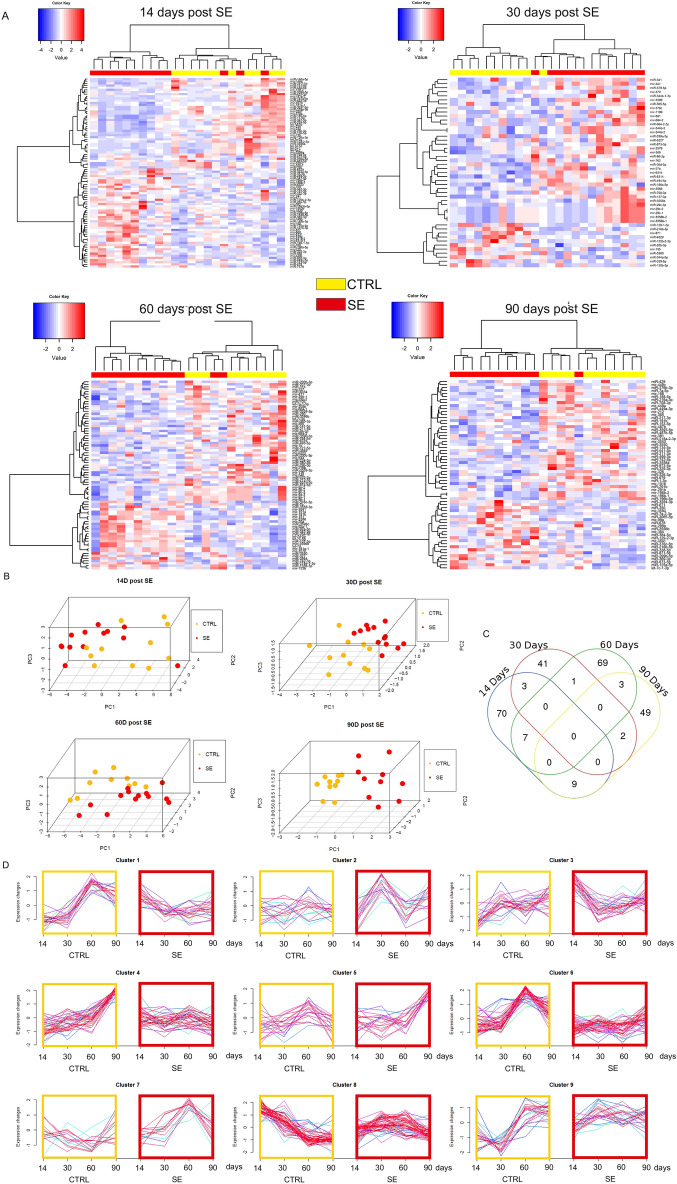
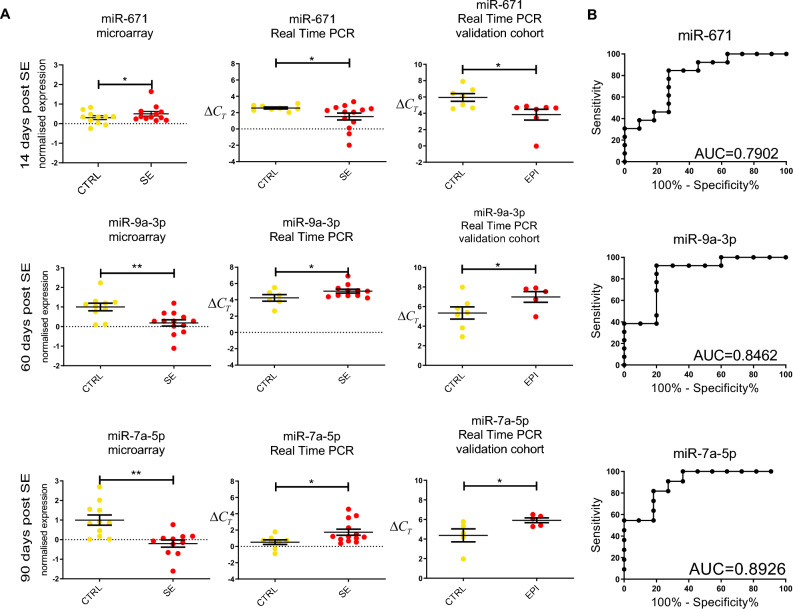
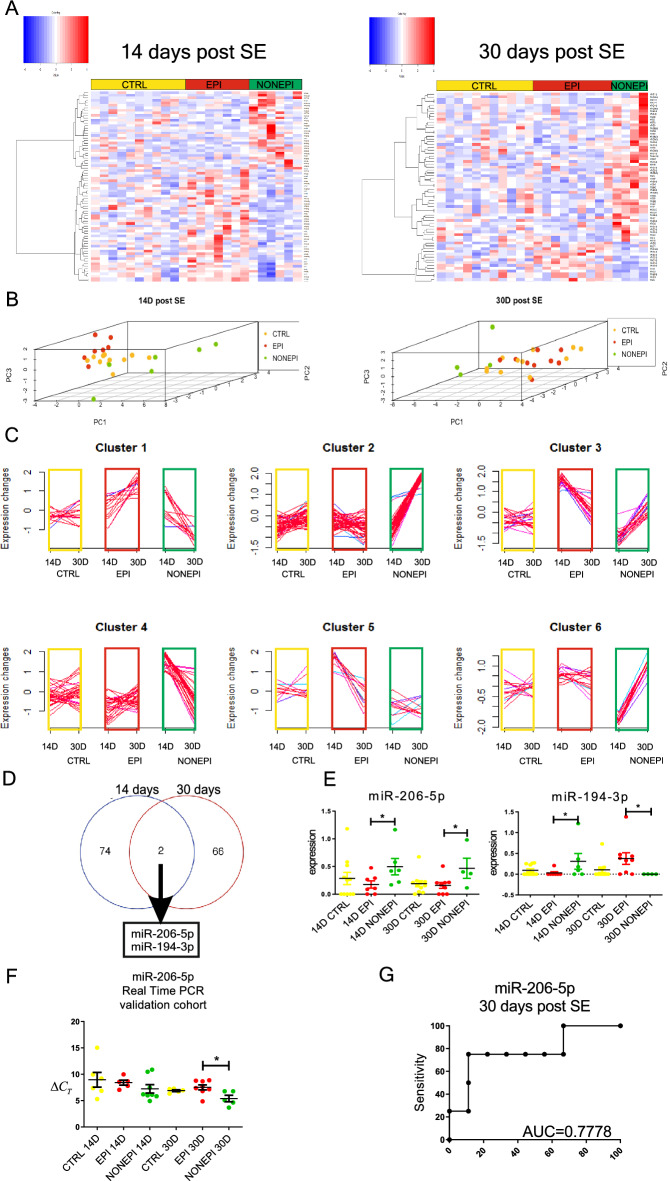
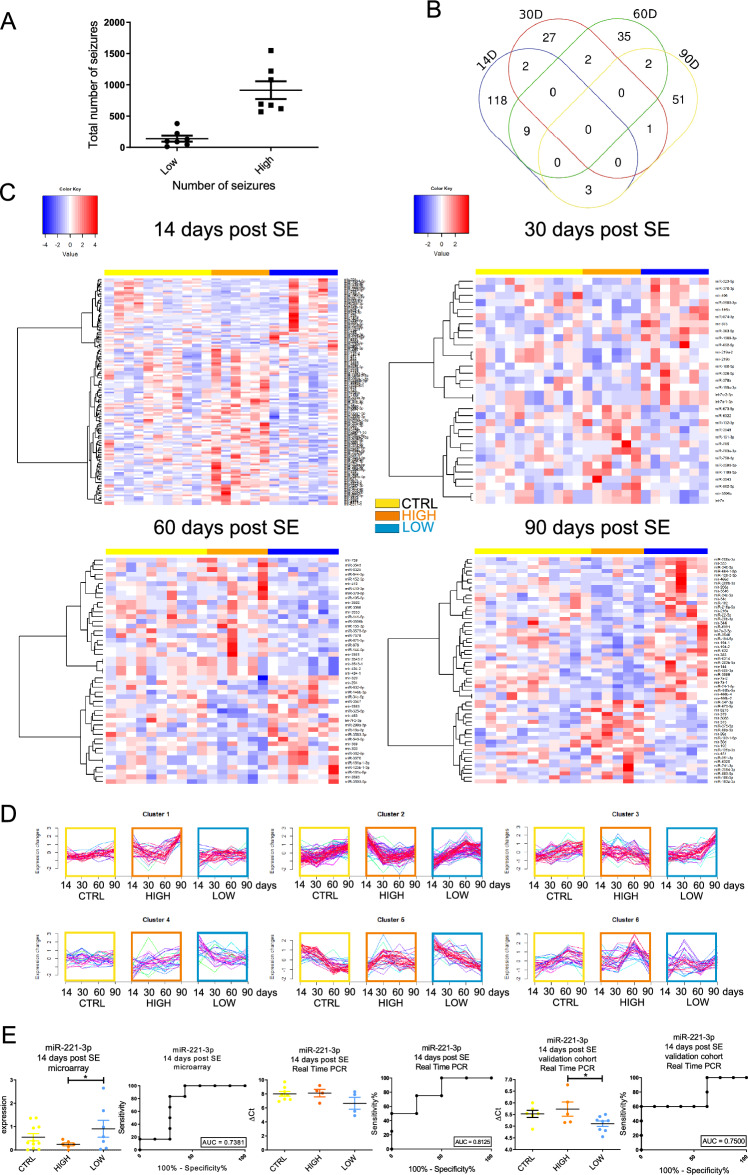
Epilepsy frequently develops as a result of brain insult; however, there are no tools allowing to predict which patients suffering from trauma will eventually develop epilepsy. microRNAs are interesting candidates for biomarkers, as several of them have been described to change their levels in the brains, and in the plasma of epileptic subjects. This study was conducted to evaluate the usefulness of plasma miRNAs as epileptogenesis/epilepsy biomarkers. In our studies, we used a rat model of temporal lobe epilepsy. An epileptogenic insult was status epilepticus evoked by stimulation of the left lateral nucleus of the amygdala. Next, animals were continuously video and EEG monitored for 3 months. Blood was collected at 14, 30, 60, and 90 days after stimulation. Blood plasma was separated and miRNA levels were analyzed. We compared miRNA levels between sham-operated and stimulated animals, and between animals with high and low numbers of seizures. We propose three miRNAs that could be biomarkers of epilepsy: miR-671, miR-9a-3p and miR-7a-5p. According to us, miR-206-5p is a potential biomarker of epileptogenesis, and miR-221-3p is a potential biomarker of epilepsy severity. We think that these five miRNAs can be considered in the future as potential treatment targets.


Conflict of interest statement

The authors declare no competing interests.

Figures

Figure 1
Figure 1
Experimental design. The whole experiment lasted for 224 days (8 months). Blood from the tail vein was drawn at 14 days, 30 days, 60 days and 90 days. VIDEO-EEG was monitored 3 times for 30 days during the whole course of the experiment.
Figure 2
Figure 2
miRNA expression profiles in the plasma of epileptic and control animals at different times after SE. (A) Heatmaps present miRNAs with altered expression at 4 tested time points: 14, 30, 60 and 90 days post-SE. Each column represents individual animals, and each row represents an individual miRNA. We identified statistically significant changes in the expression levels of several miRNAs at the p < 0.05 cutoff: at 14 days, there were 90 miRNAs; at 30 days, there were 47 miRNAs; at 60 days, there were 81 miRNAs; and at 90 days, there were 63 miRNAs. The red bar over the heatmap indicates SE animals, and the yellow color bar indicates CTRL animals. Colors on the heatmaps represent increased (red) or decreased (blue) expression of a given miRNA. The heatmap diagrams were generated with the gplots package version 3.1.3 (R version 3.3.2). The fuzzy c-means algorithm implemented in the Mfuzz package version 2.32.0 was used to perform clusterization on all probes. (B) Principal component analysis (PCA) graphs show spatial arrangements between CTRL (black) and SE (red) animals. Each mark represents an individual animal. Note that epileptic animals are separated from the controls. (C) Venn diagram presents an overlay of miRNA expression levels between the 4 tested time points. (D) Clusters represent groups of miRNAs displaying similar expression profiles over time induced by status epilepticus. The colors of lines within the clusters indicate the membership values of the expression profile to the current cluster. Red and violet are high membership values, and blue and green are low membership values.
Figure 3
Figure 3
Selected biomarkers of epileptogenesis. (A) Detailed analysis of microarray results and their validation with real-time PCR allowed us to choose 3 potential biomarkers of epilepsy: miR-671 at 14 days post-SE, miR-9a-3p at 60 days post-SE and miR-7a-5p at 90 days post-SE. Microarray results are presented as the normalized expression (a higher value means higher expression). Real-time PCR results are presented as ΔCt values (values higher than the control mean decreased levels of expression). (B) ROC analysis proved very good sensitivity and specificity of all selected miRNAs.
Figure 4
Figure 4
miRNA expression profiles in symptomatic and asymptomatic phases. Selection of epileptogenesis biomarkers. (A) Heatmaps present miRNAs with altered expression at 14 and 30 days post-SE, where we could select animals that did not suffer from seizures (NONEPI) and those that developed epilepsy (EPI). Each column represents individual animals, and each row represents an individual miRNA. We identified statistically significant changes in the expression levels of several miRNAs at the p < 0.05 cutoff. The red bar over the heatmap indicates EPI animals, the green bar indicates NONEPI animals, and the yellow color bar indicates CTRL animals. Colors on the heatmaps represent increased (red) or decreased (blue) expression of a given miRNA. The heatmap diagrams were generated with the gplots package version 3.1.3 (R version 3.3.2). The fuzzy c-means algorithm implemented in the Mfuzz package version 2.32.0 was used to perform clusterization on all probes. (B) Principal component analysis (PCA) graphs show spatial arrangements between CTRL (black), NONEPI (green), and EPI (red) animals. Each mark represents an individual animal. Note that epileptic animals are separated from nonepileptic animals. (C) Clusters represent groups of miRNAs displaying similar expression profiles over time induced by epileptogenesis (green box) or epilepsy (red box). The colors of lines within the clusters indicate the membership values of the expression profile to the current cluster. Red and violet are high membership values, and blue and green are low membership values. (D) Venn diagram presents an overlay of miRNA expression levels between the 2 tested time points. (E) Based on the Venn diagram, we selected 2 miRNAs, miR-206-5p and miR-194-3p, that differ nonepileptic from epileptic animals. (F) We also validated our discovery in plasma samples from 4 independent validation cohorts of animals. We confirmed the distinctive change in miR-206-5p at 30 days post-SE in animals that did not develop seizures. Real-time PCR results are presented as ΔCt values (values higher than the control indicate a decreased level of expression). (G) ROC analysis confirmed that the sensitivity and specificity of miR-206-5p is good, and it can be considered a biomarker of epileptogenesis.
Figure 5
Figure 5
miRNA expression profiles in the plasma of animals with high and low numbers of seizures. (A) The number of seizures in stimulated animals varied greatly. Within the stimulated group, we can distinguish two subgroups with low (median = 95.0 + / − 47.58; LOW) and high (median = 692.8 + / − 141.4; HIGH) numbers of seizures. (B) Venn diagram presents an overlay of significantly changing miRNAs between the 4 tested time points. (C) Heatmaps present miRNAs with altered expression at 4 tested time points: 14, 30, 60, and 90 days post-SE. Each column represents individual animals, and each row represents an individual miRNA. We identified statistically significant changes in the expression levels of several miRNAs at a p < 0.05 cutoff. The orange bar over the heatmap indicates animals with a high number of seizures, the blue color marks animals with a low number of seizures, and the yellow color bar indicates CTRL animals. Colors on the heatmaps represent increased (red) or decreased (blue) expression of a given miRNA. The heatmap diagrams were generated with the gplots package version 3.1.3 (R version 3.3.2). The fuzzy c-means algorithm implemented in the Mfuzz package version 2.32.0 was used to perform clusterization on all probes. (D) Clusters represent groups of miRNAs displaying similar expression profiles over time induced by status epilepticus. The colors of lines within the clusters indicate the membership values of the expression profile to the current cluster. Red and violet are high membership values, and blue and green are low membership values. Yellow boxes highlight control animals, orange boxes animals with a high number of seizures, and blue boxes animals with a low number of seizures. (E) Detailed analysis of microarray results and their validation with real-time PCR allowed us to choose a potential biomarker of epilepsy severity – miR-221-3p 14 days post-SE. Microarray results are presented as the normalized expression (a higher value means higher expression). Real-time PCR results are presented as ΔCt values (values higher than the control mean decreased levels of expression). ROC analysis proved very good sensitivity and specificity of all selected miRNAs.

References

    1. Banerjee PN, H. W. Incidence and prevalence. 2nd edn, (Wolters Kluwer Lippincott Williams & Wilkins, UK, 2008).
    1. Moshé SL, Perucca E, Ryvlin P, Tomson T. Epilepsy: New advances. Lancet. 2015;385:884–898. doi: 10.1016/S0140-6736(14)60456-6. - DOI - PubMed
    1. Engel J, et al. Epilepsy biomarkers. Epilepsia. 2013;54(Suppl 4):61–69. doi: 10.1111/epi.12299. - DOI - PMC - PubMed
    1. Hegde M, Lowenstein DH. The search for circulating epilepsy biomarkers. Biomark. Med. 2014;8:413–427. doi: 10.2217/bmm.13.142. - DOI - PubMed
    1. Pitkänen A, et al. Advances in the development of biomarkers for epilepsy. Lancet Neurol. 2016;15:843–856. doi: 10.1016/S1474-4422(16)00112-5. - DOI - PubMed