. 2024 Feb:126:1-13.
doi: 10.1016/j.matbio.2024.01.001. Epub 2024 Jan 6.

Dynamic changes in mitral valve extracellular matrix, tissue mechanics and function in a mouse model of Marfan syndrome

Affiliations

Dynamic changes in mitral valve extracellular matrix, tissue mechanics and function in a mouse model of Marfan syndrome

Brittany A Gonzalez et al. Matrix Biol. 2024 Feb.

Abstract

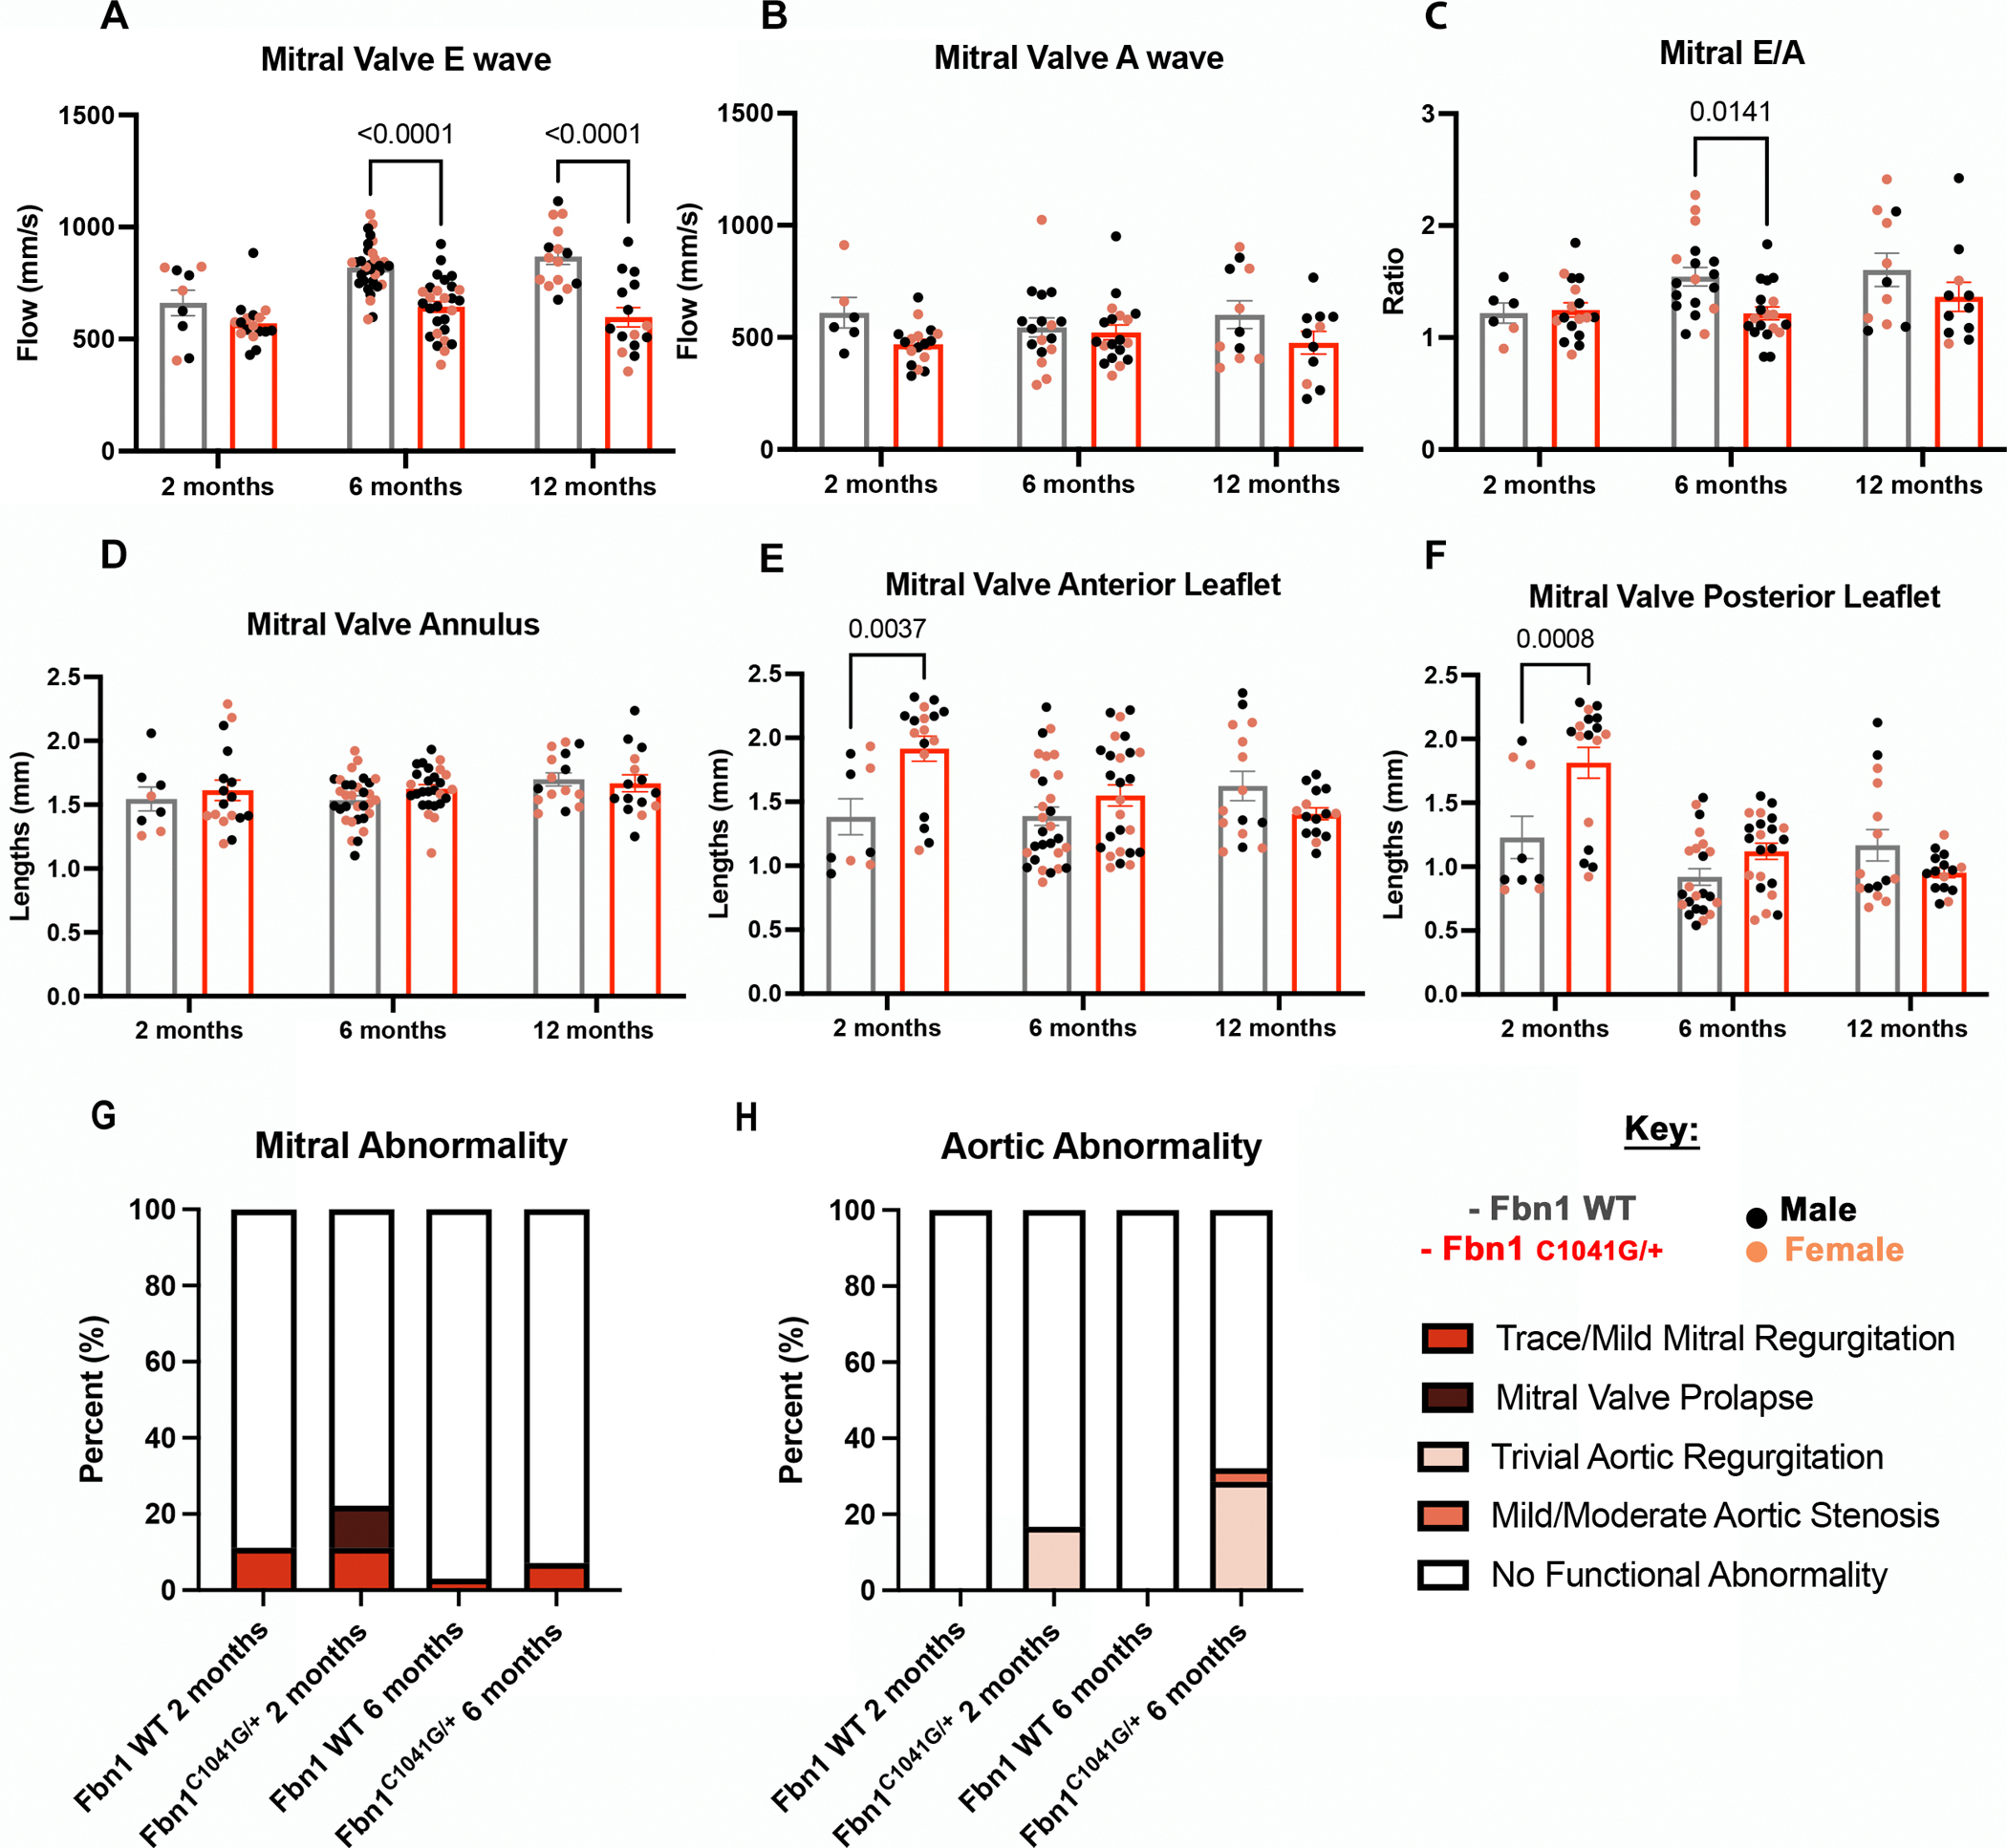
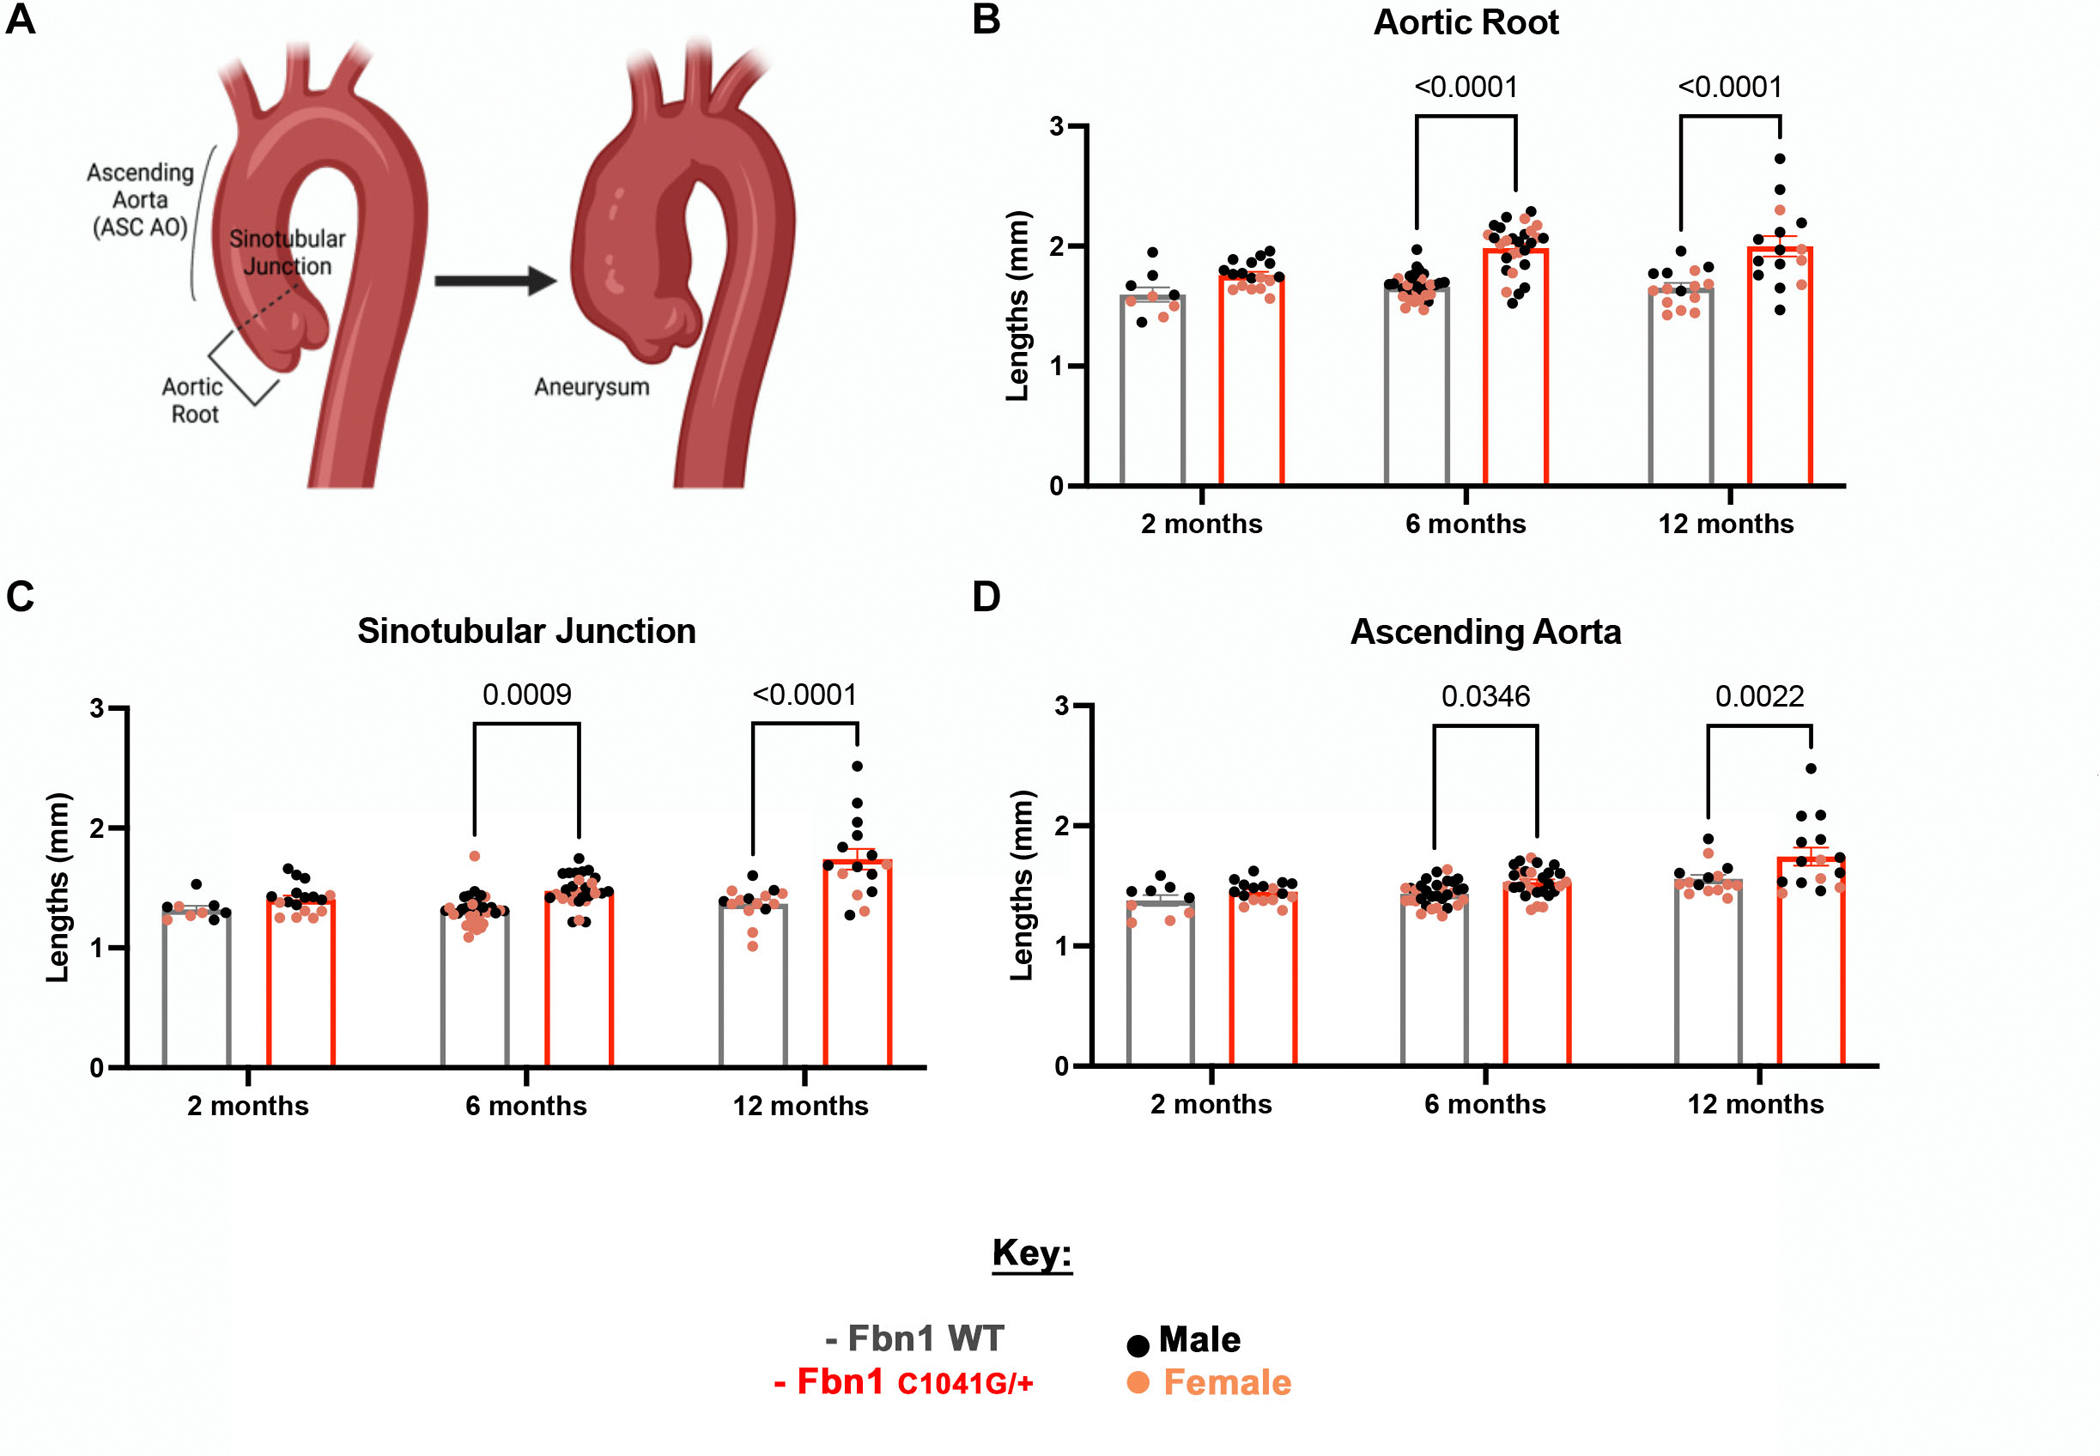
Objective: Mouse models of Marfan syndrome (MFS) with Fibrillin 1 (Fbn1) variant C1041G exhibit cardiovascular abnormalities, including myxomatous valve disease (MVD) and aortic aneurism, with structural extracellular matrix (ECM) dysregulation. In this study, we examine the structure-function-mechanics relations of the mitral valve related to specific transitions in ECM composition and organization in progressive MVD in MFS mice from Postnatal day (P)7 to 1 year-of-age.

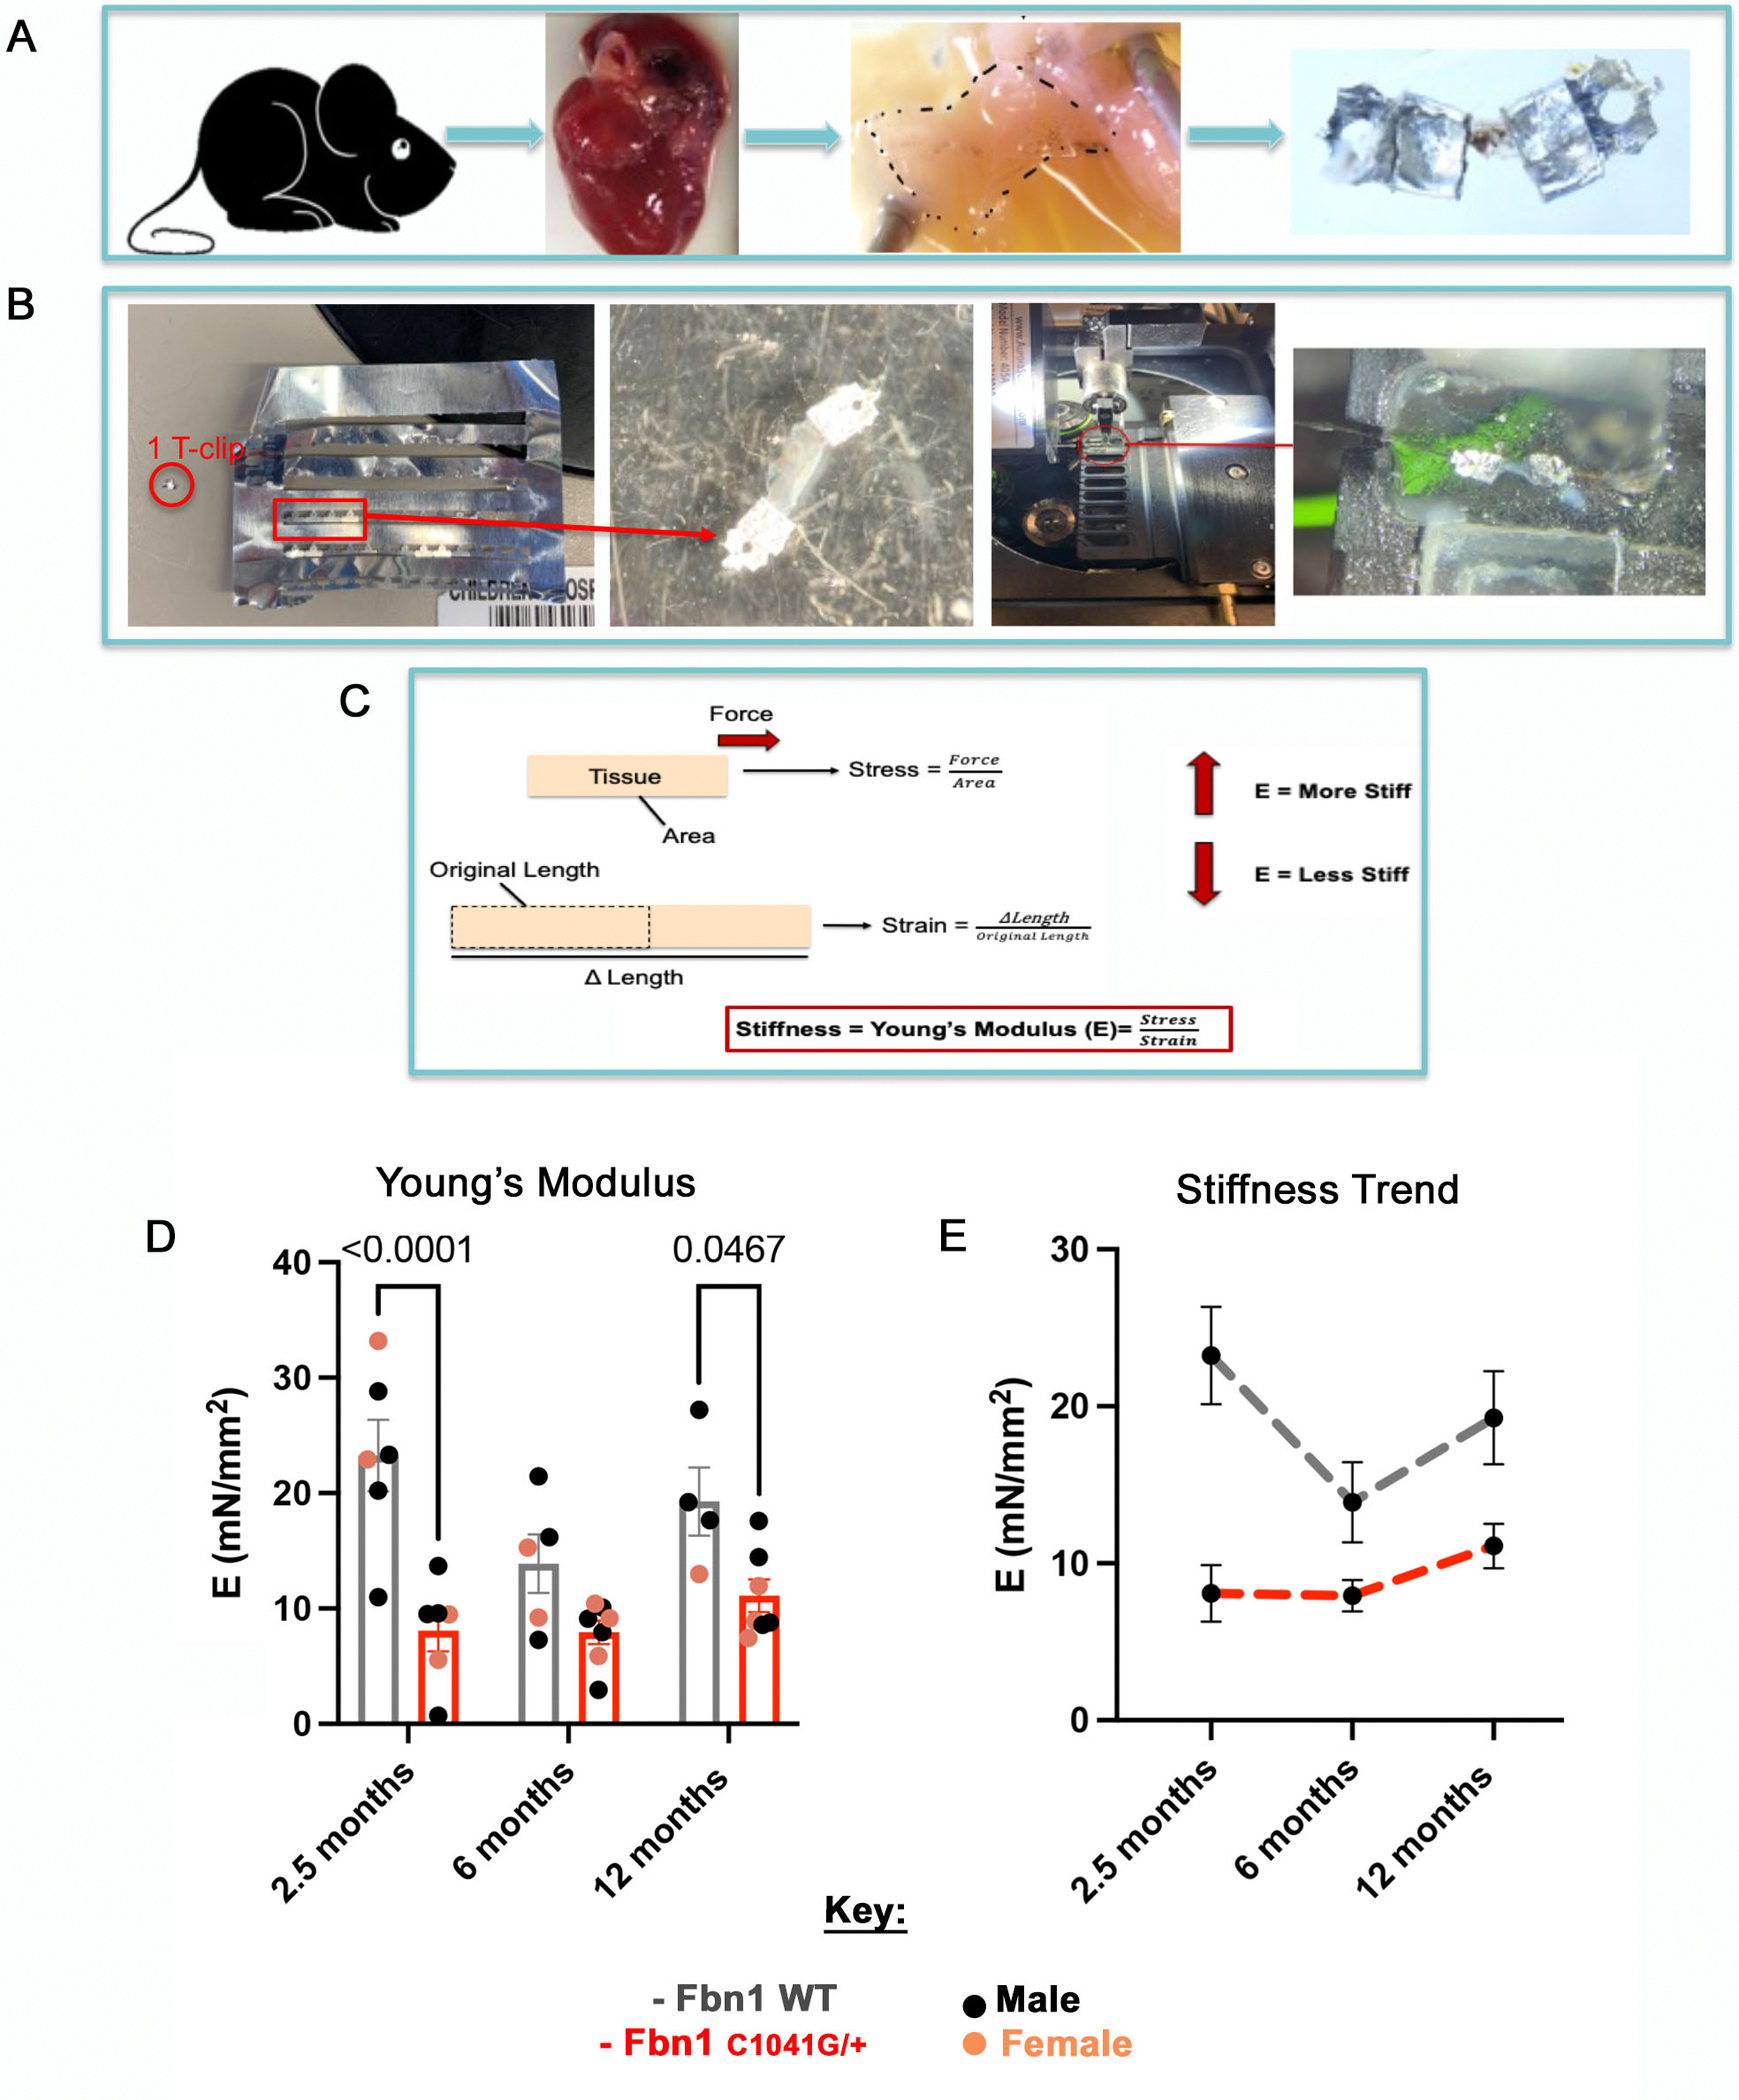
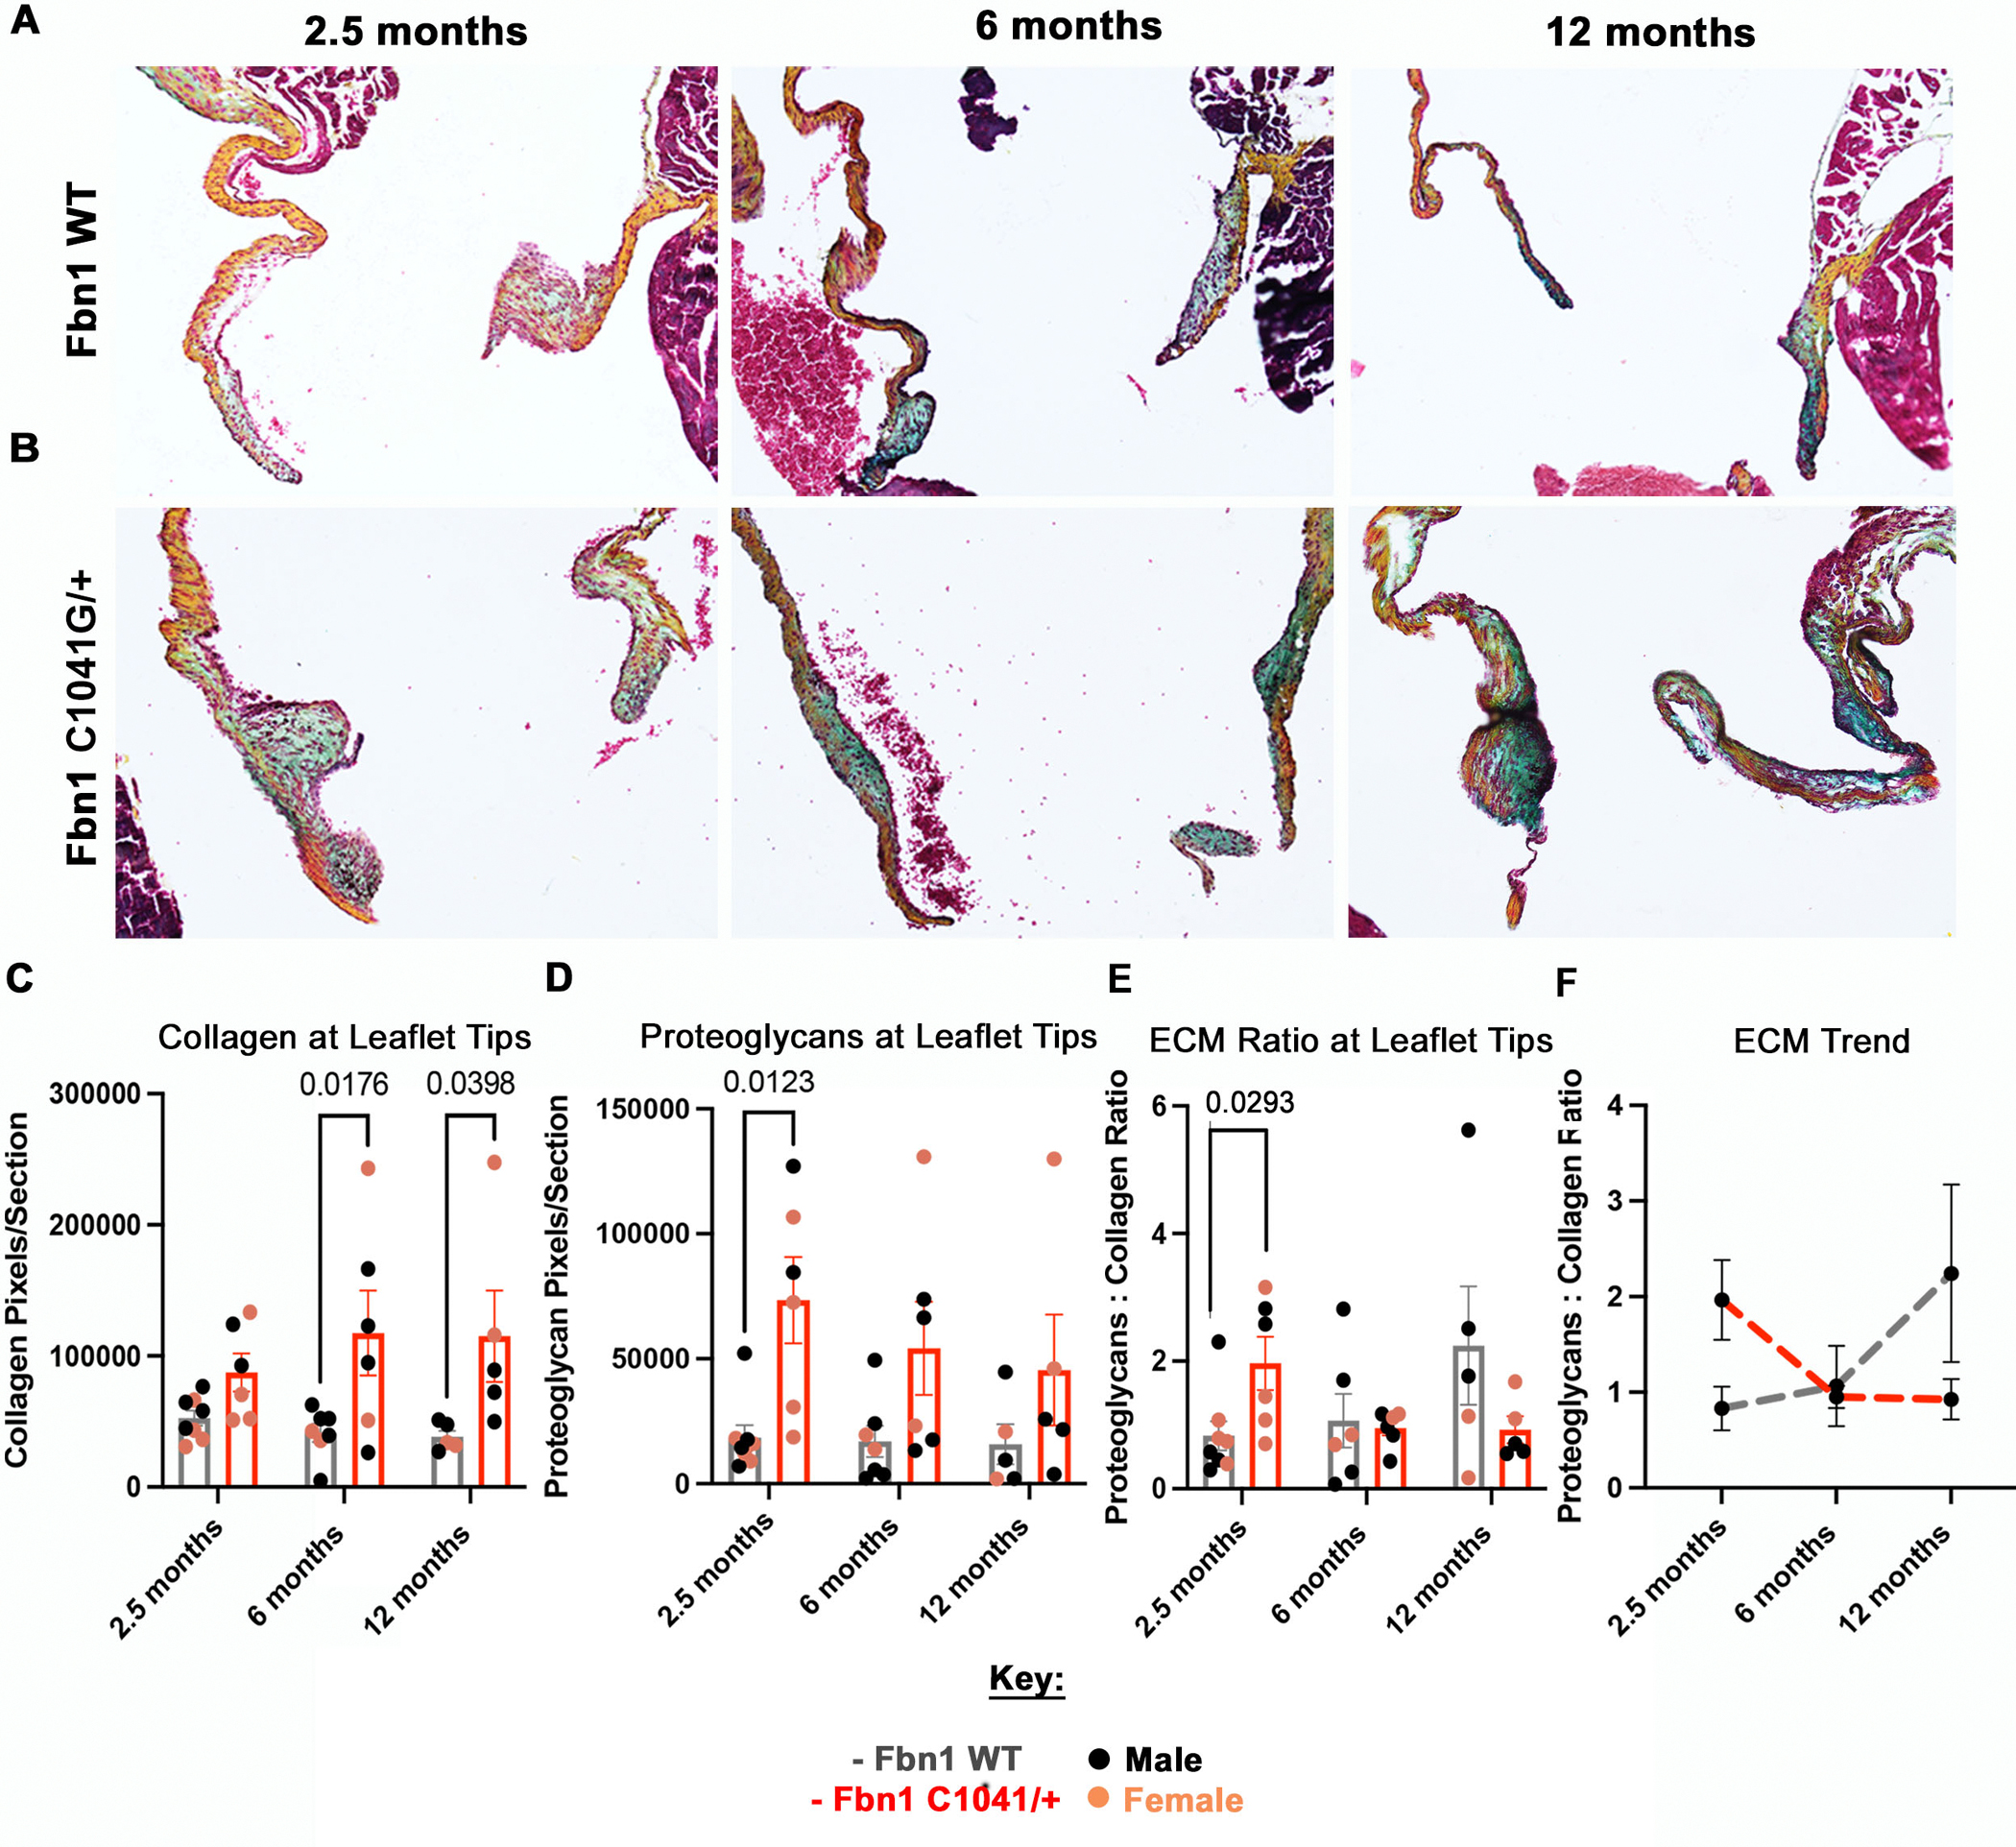
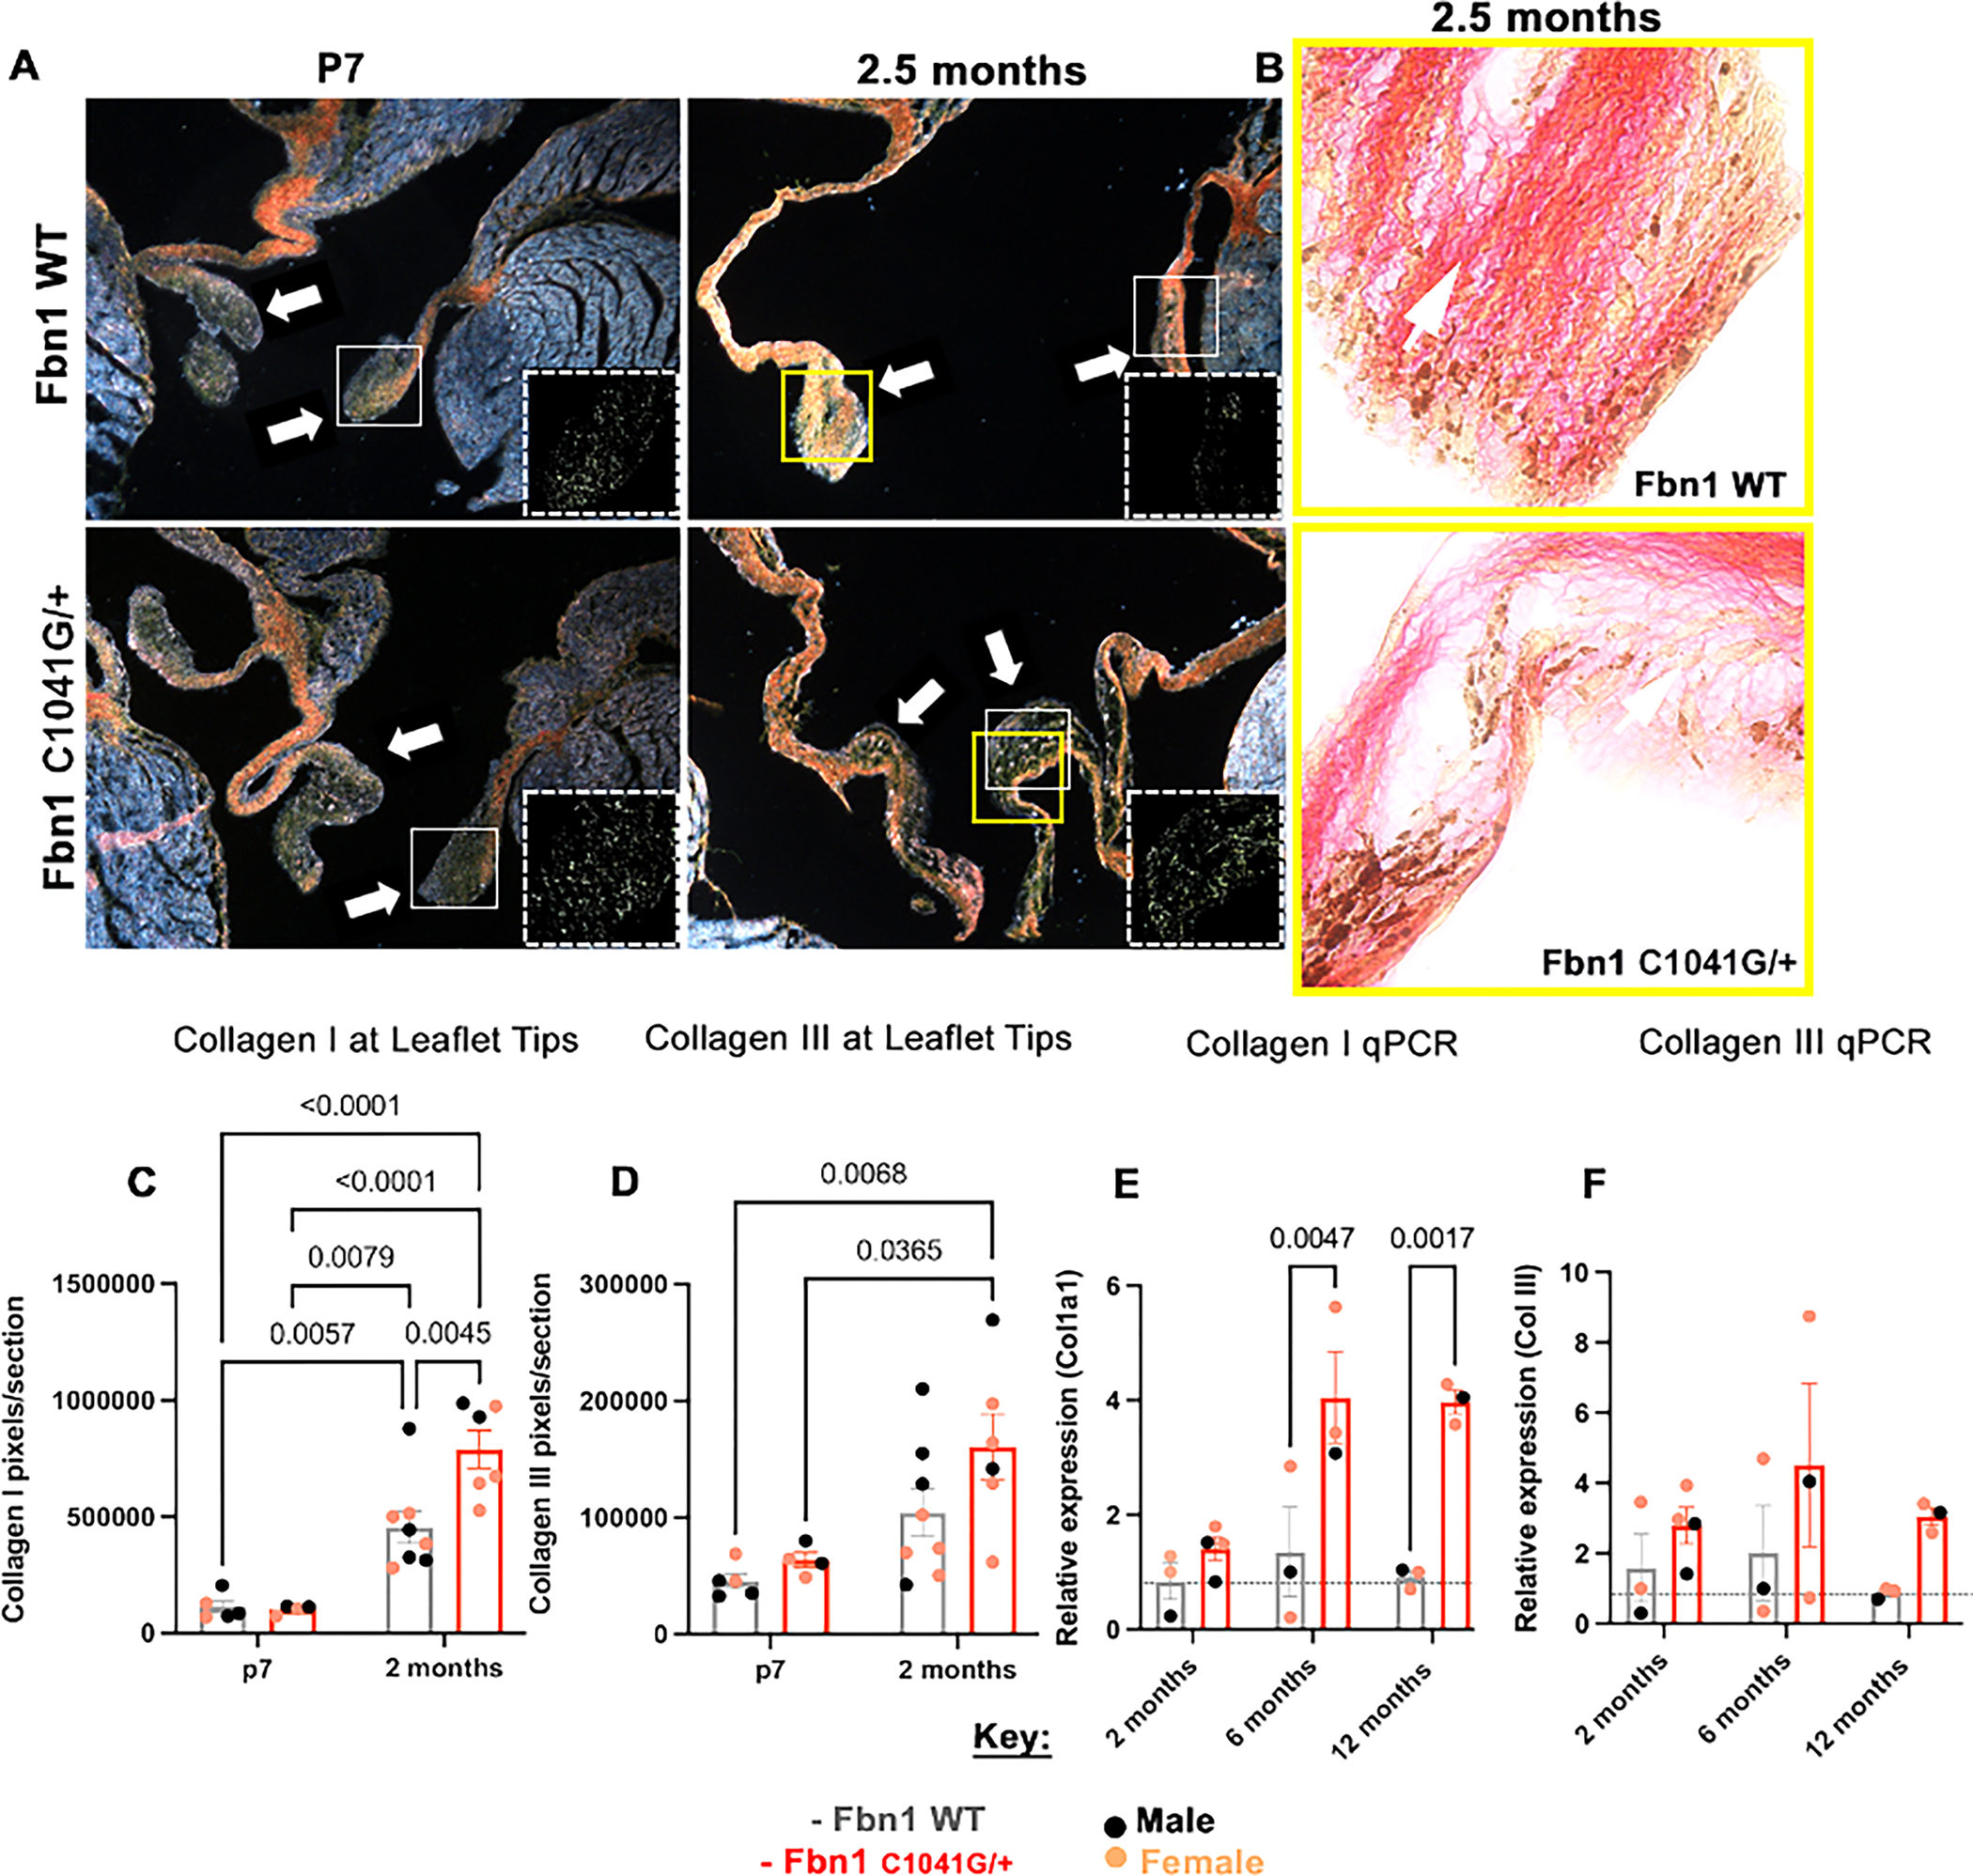
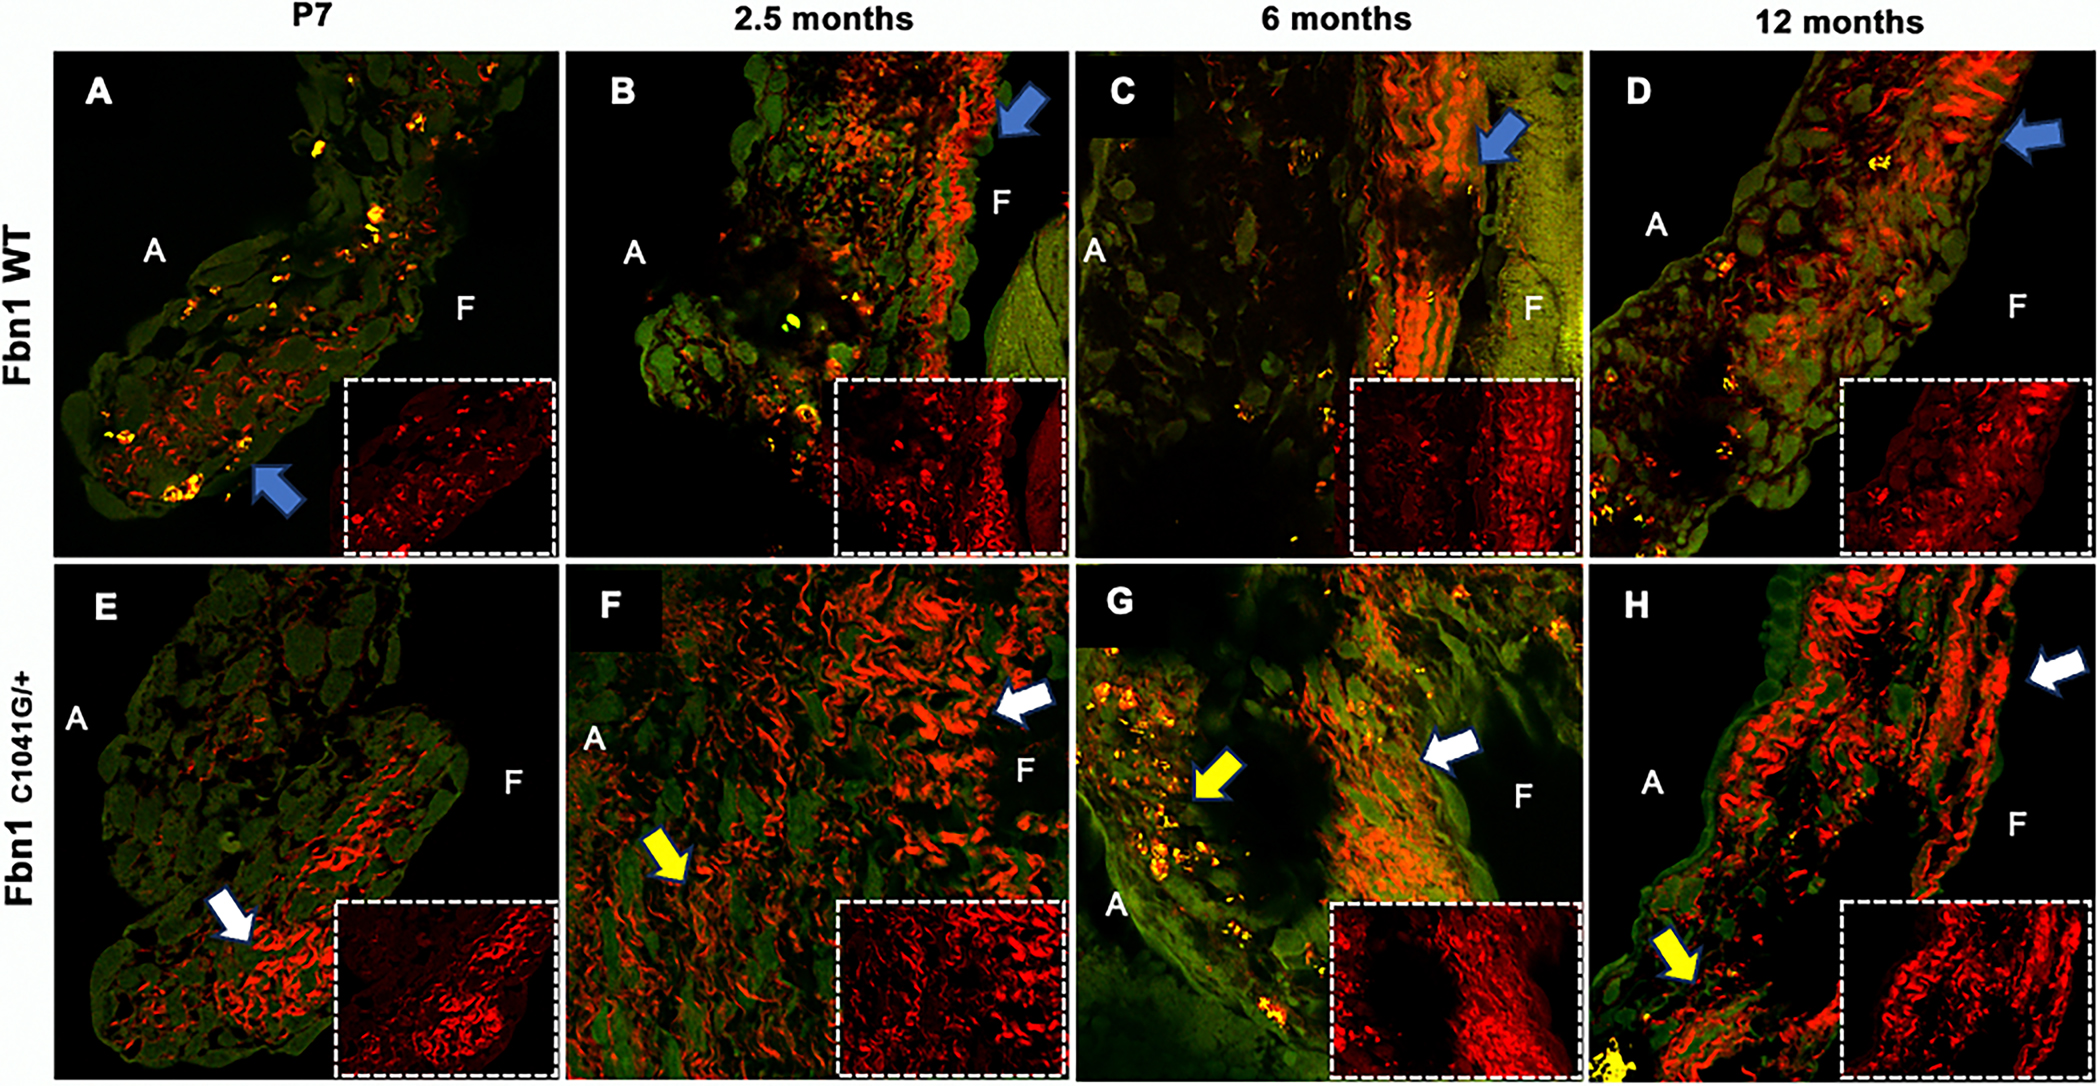
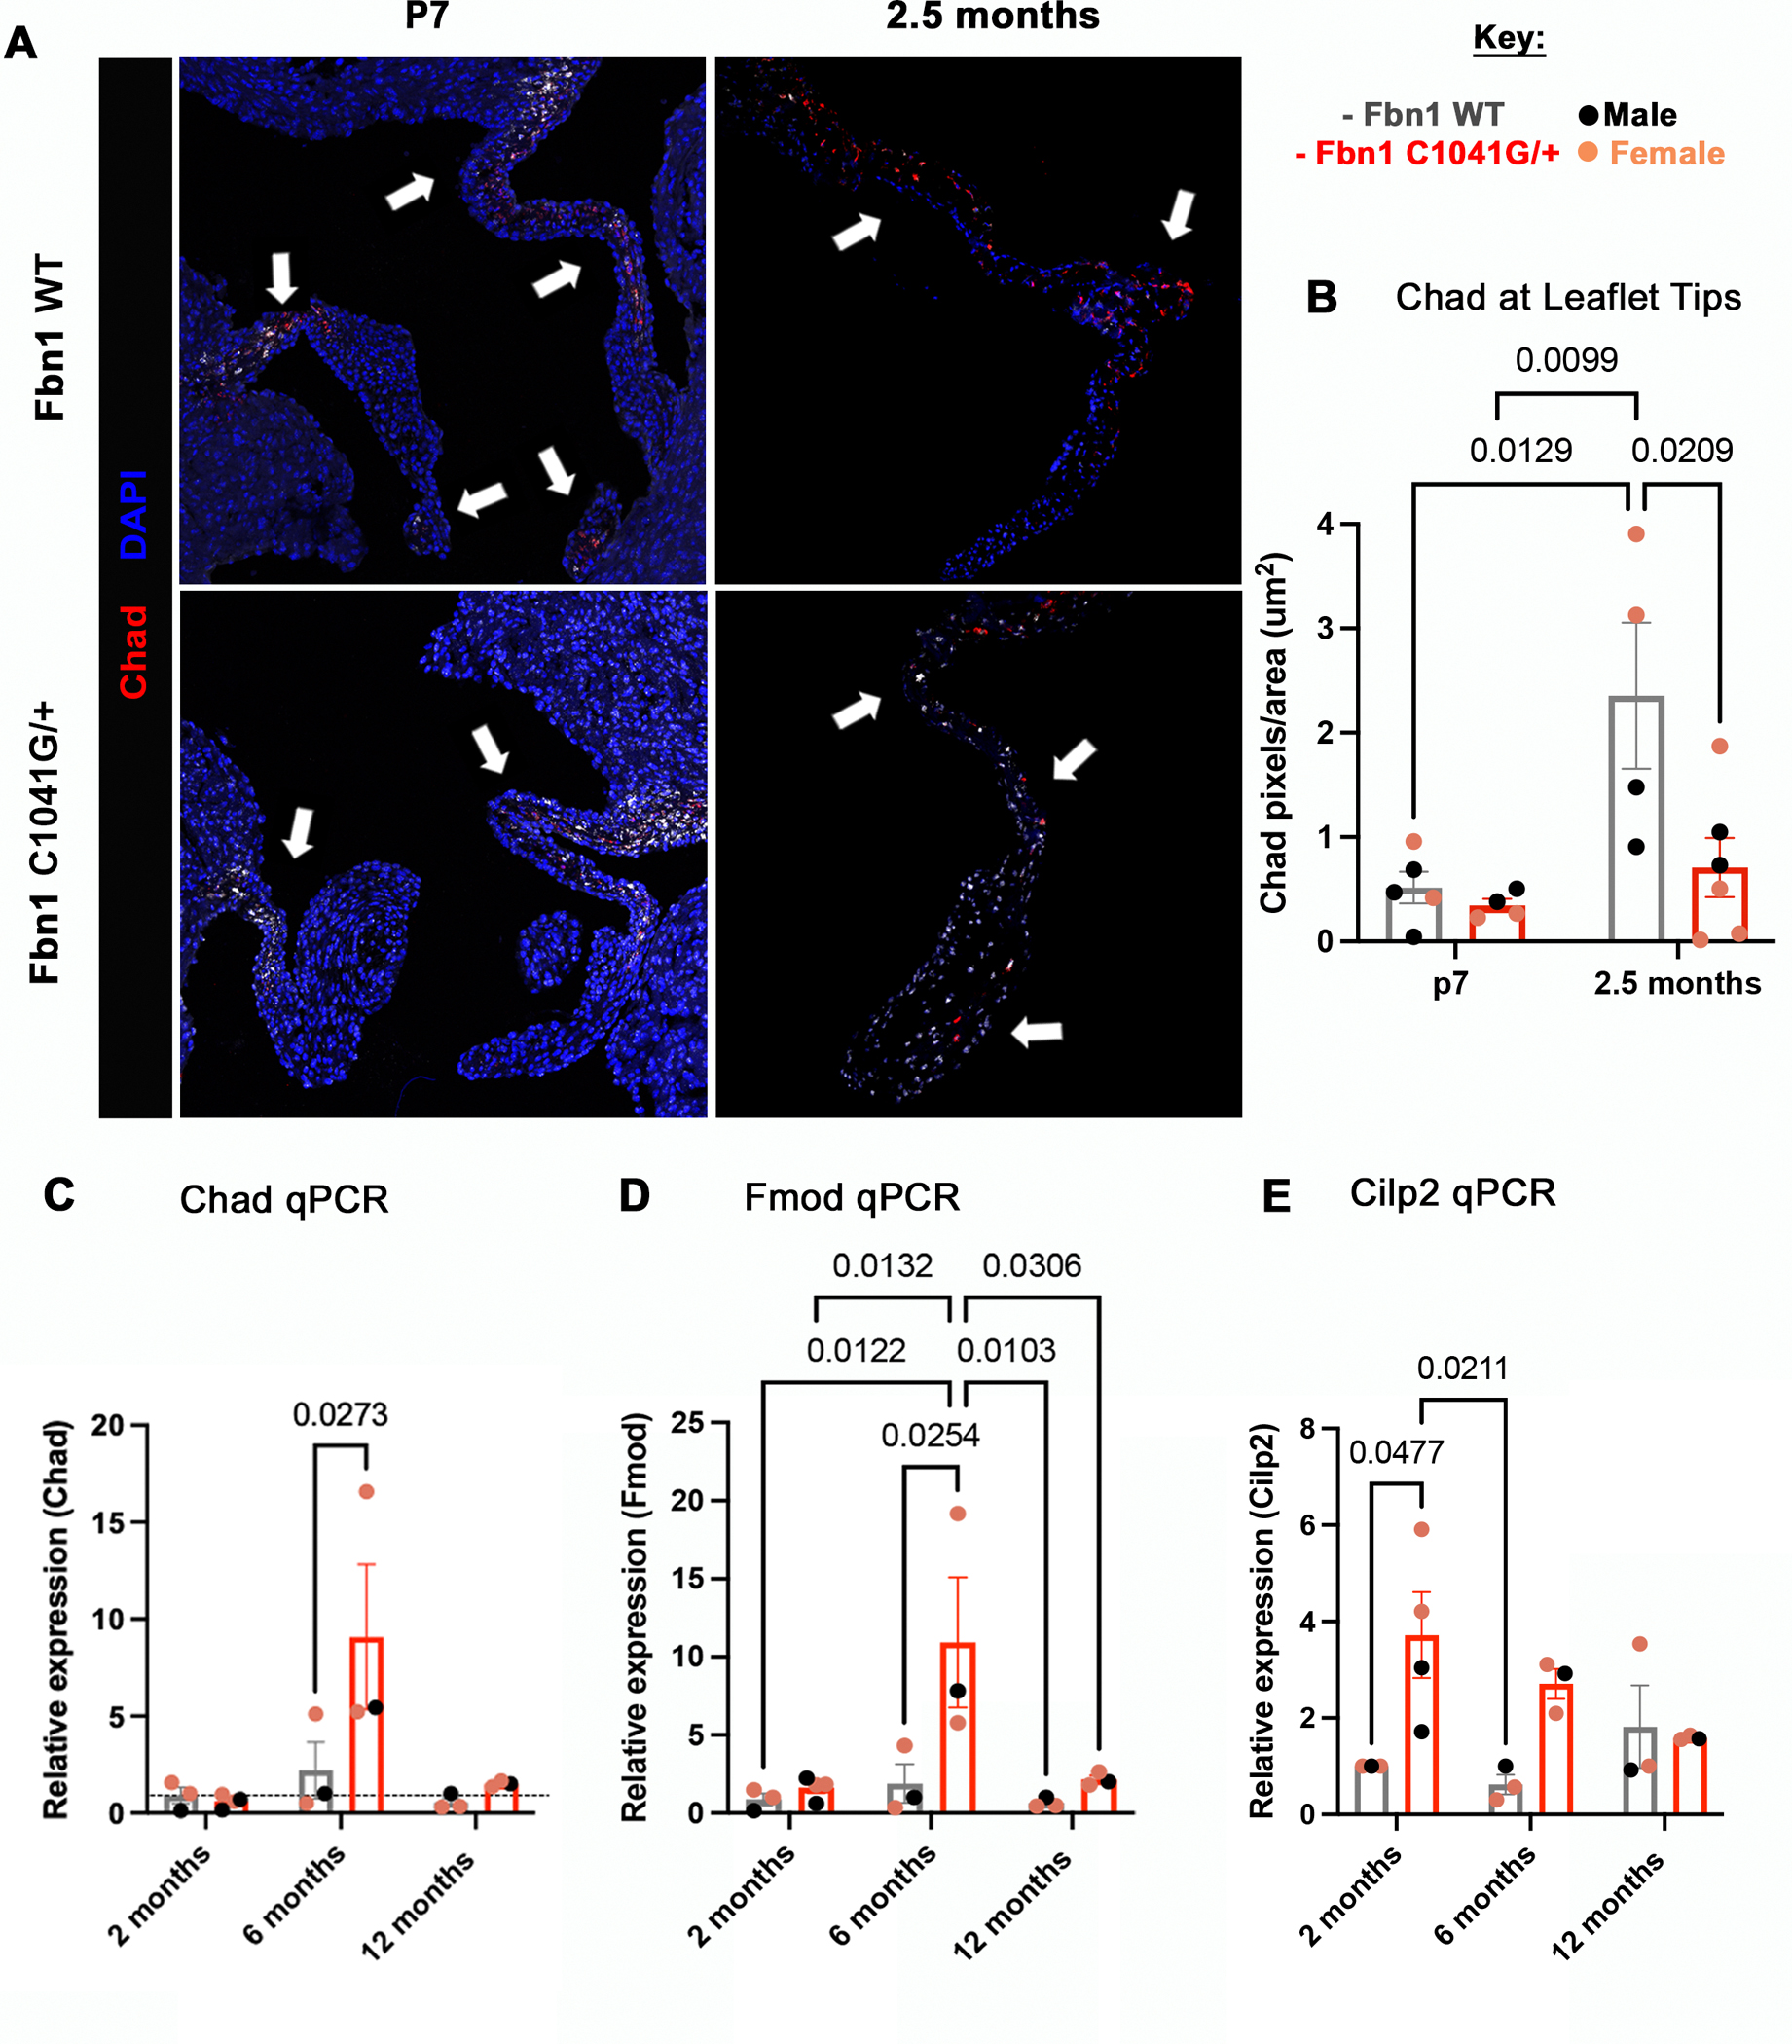
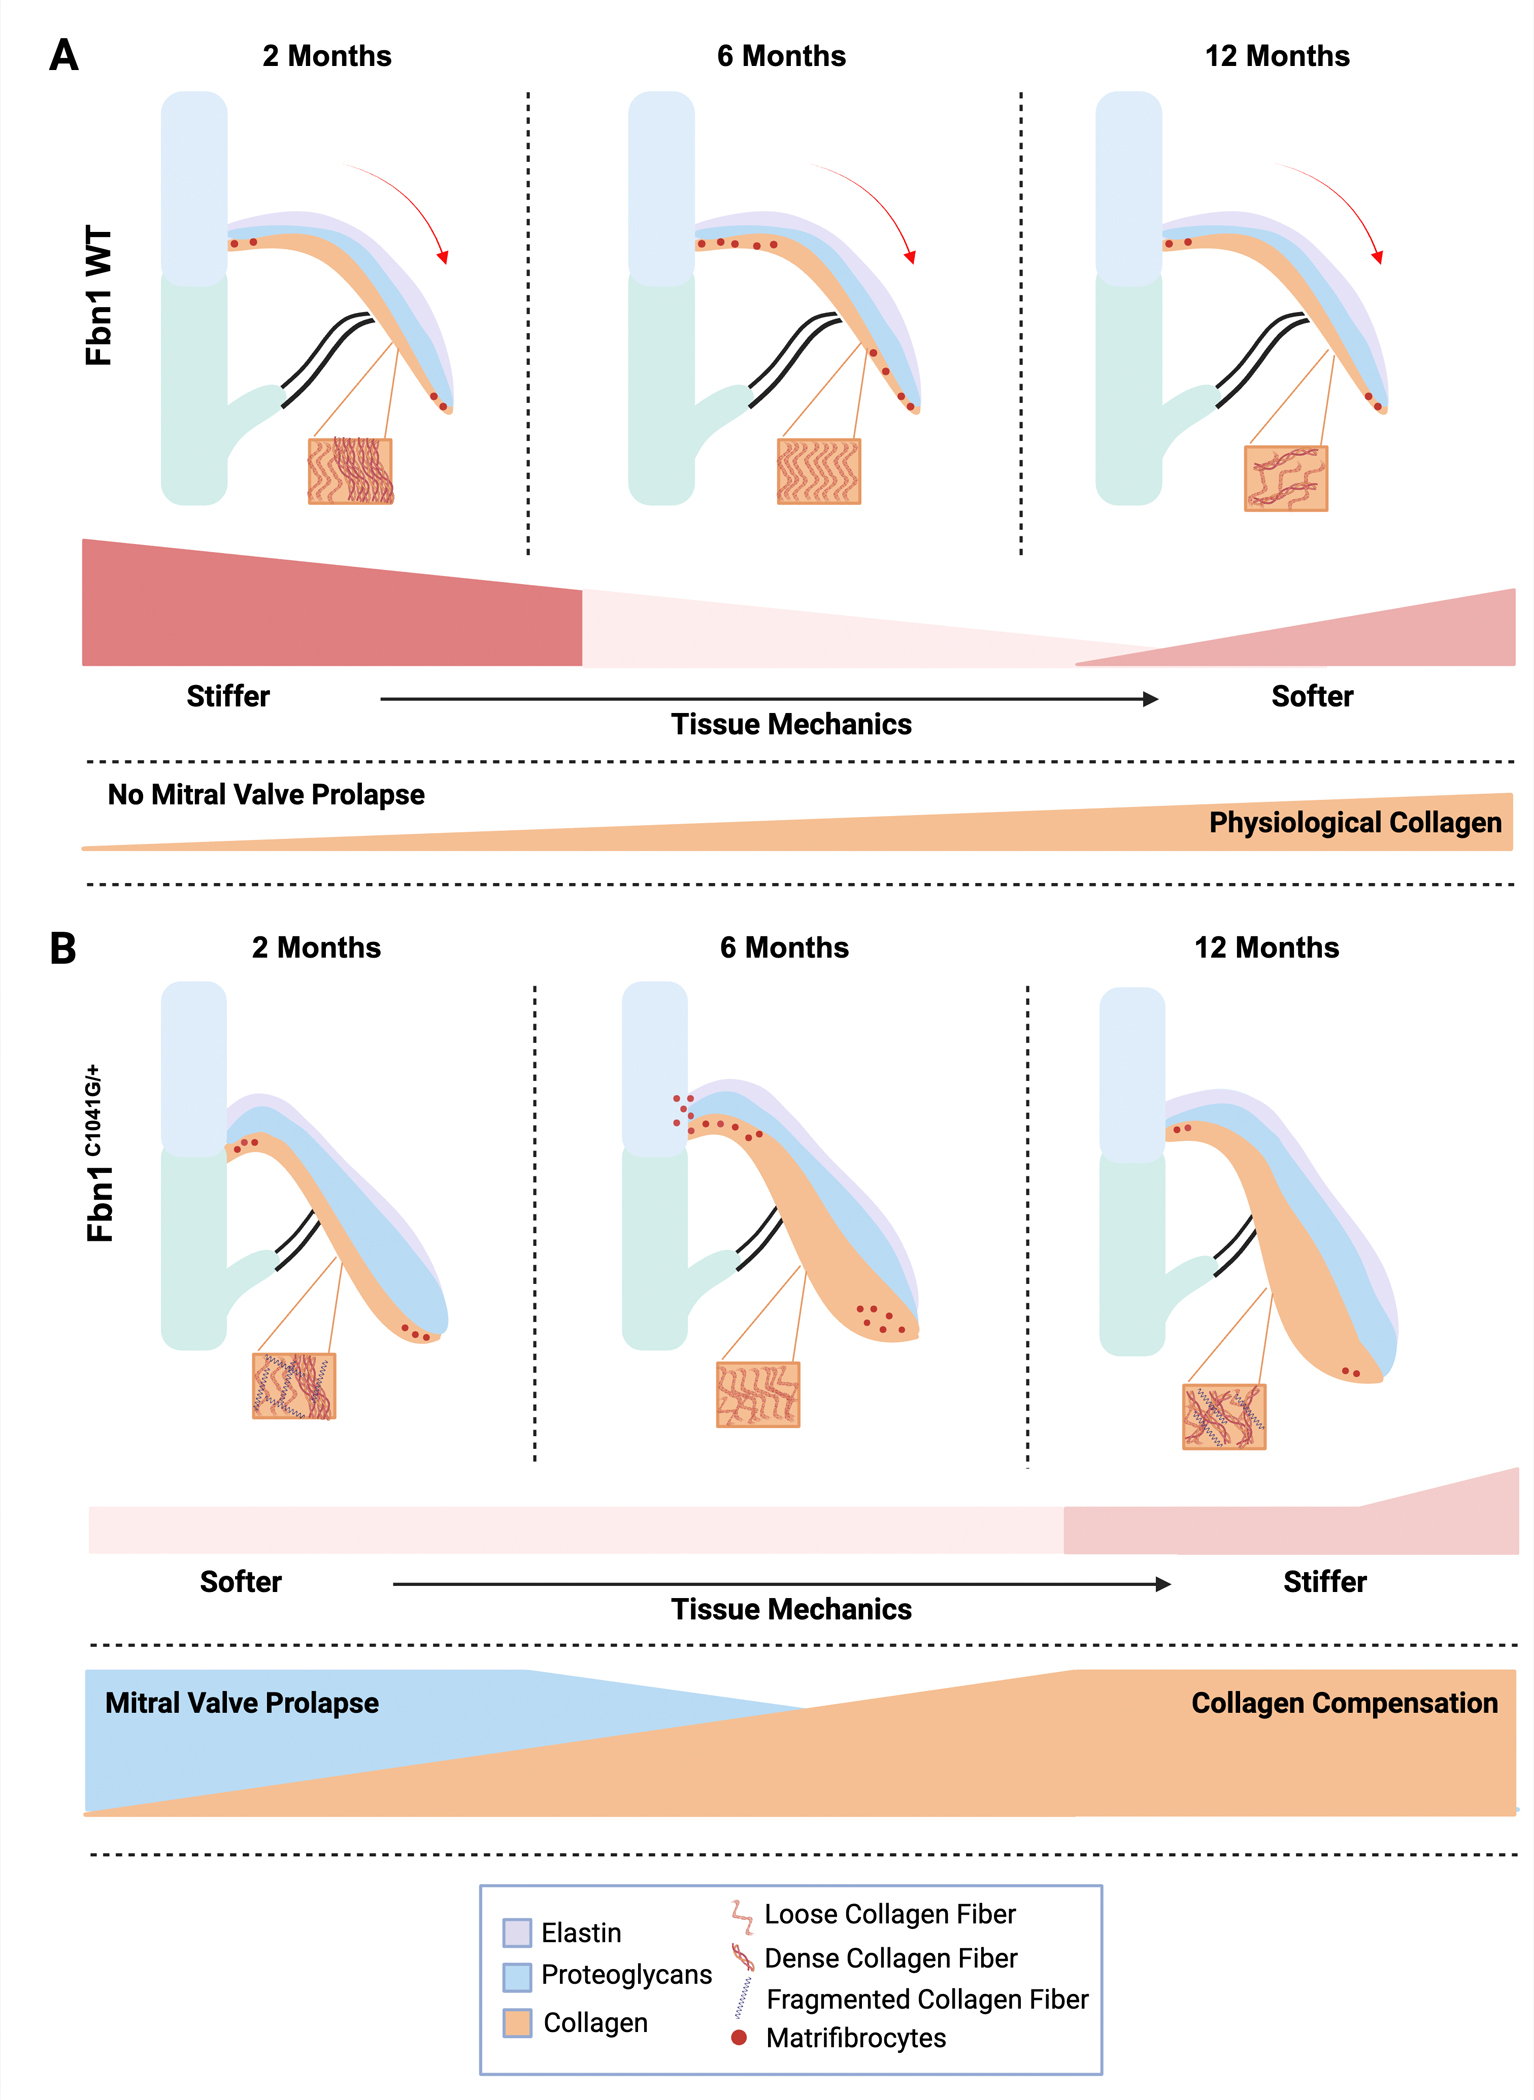
Approach and results: Mechanistic links between mechanical forces and biological changes in MVD progression were examined in Fbn1C1041G/+ MFS mice. By echocardiography, mitral valve dysfunction is prevalent at 2 months with a decrease in cardiac function at 6 months, followed by a preserved cardiac function at 12 months. Mitral valve (MV) regurgitation occurs in a subset of mice at 2-6 months, while progressive dilatation of the aorta occurs from 2 to 12 months. Mitral valve tissue mechanical assessments using a uniaxial Permeabilizable Fiber System demonstrate decreased stiffness of MFS MVs at all stages. Histological and microscopic analysis of ECM content, structure, and fiber orientation demonstrate that alterations in ECM mechanics, composition, and organization precede functional abnormalities in Fbn1C1041G/+MFS MVs. At 2 months, ECM abnormalities are detected with an increase in proteoglycans and decreased stiffness of the mitral valve. By 6-12 months, collagen fiber remodeling is increased with abnormal fiber organization in MFS mitral valve leaflets. At the same time, matrifibrocyte gene expression characteristic of collagen-rich connective tissue is increased, as detected by RNA in situ hybridization and qPCR. Together, these studies demonstrate early prevalence of proteoglycans at 2 months followed by upregulation of collagen structure and organization with age in MVs of MFS mice.

Conclusions: Altogether, our data indicate dynamic regulation of mitral valve structure, tissue mechanics, and function that reflect changes in ECM composition, organization, and gene expression in progressive MVD. Notably, increased collagen fiber organization and orientation, potentially dependent on increased matrifibrocyte cell activity, is apparent with altered mitral valve mechanics and function in aging MFS mice.

Keywords: Collagen organization and structure; Myxomatous mitral valve; Proteoglycans; Valve function; Valve tissue stiffness.


Figures

Figure 1:
Figure 1:. Left sided heart valve dimensions and function are affected in Fbn1C1041G/+ MFS mice as determined by echocardiography measurements.
Echocardiography was done on MFS and WT mice (n=86 total). MFS mice have a significant decrease in (A) mitral valve E wave at later timepoints. The (B) mitral valve A wave is not significant. Even so, the overall left ventricular function, (C) the mitral valve E/A ratio, is significantly lower in the MFS mice at 6 months. The mitral valve (D) annulus, (E) anterior and (F) posterior leaflets dimensions were measured, with significant increase in MFS mice (E-F) leaflet lengths at 2 months. (G-H) Functional abnormalities were found at a higher percent in Fbn1C1041G/+ MFS (G) mitral and (H) aortic valves compared to WT controls. A two-way ANOVA was utilized, data are reported as mean ± SEM and a p-value < 0.05 was statistically significant.
Figure 2:
Figure 2:. Aortic dilatation of Marfan syndrome mice are progressively increased at 2, 6 and 12 months.
(A) A model demonstrating the three main areas, including the (B) aortic root, (C) sinotubular junction and (D) ascending aorta, affected in the aorta of MFS patients. As determined by echocardiography (n=86), aortic dimensions (B-D) are affected in MFS mice, with a significant increase seen at later timepoints of 6 and 12 months in MFS mice compared to WT littermate controls. A two-way ANOVA was utilized, data are reported as mean ± SEM and a p-value < 0.05 was statistically significant. (A) was created with BioRender.com.
Figure 3:
Figure 3:. Tissue mechanical testing demonstrates reduced stiffness of Fbn1C1041G/+ MFS MVs.
A permeabilized fiber system was applied to Fbn1 WT and Fbn1C1041G/+ MFS MVs to test mechanical properties ex vivo. (A) Schematic of the method used for mechanical testing, starting with harvesting mice, explanting the hearts, isolating the mitral valve (MV), and placing the MV leaflet onto T-clips. (B) One T-clip is placed circumferentially on each side of the MV leaflet and then mounted into the channel system to be stretched. The samples are stretched in small increments until the valve reaches 20% its length or the maximum force of 10mN is reached. Force and length measurements are obtained and calculated (C) as stress and strain to determine the Young’s modulus as an indicator of stiffness, of the mitral valve leaflets. The (D) stiffness of Fbn1C1041G/+ MFS mitral valve leaflets are significantly decreased at 2.5 and 12 months relative to WT controls. The overall trends (E) demonstrate that the Fbn1C1041G/+ MFS mice stiffness does not change much over time. A two-way ANOVA was utilized, data are reported as mean ± SEM and a p-value < 0.05 was statistically significant.
Figure 4:
Figure 4:. ECM ratio is significantly increased at 2.5 months at the leaflet tips in Fbn1C1041G/+ MFS mice.
Representative histologic images of the mitral valve at 2.5, 6, and 12 months in WT (A) and MFS (B) mice using Movat’s Pentachrome staining, where blue stains proteoglycan and orange/yellow stains collagen. Red arrows point to the anterior (left leaflet) and posterior (right leaflet) leaflet tips. The (C) collagen and (D) proteoglycan pixels per section and (E) ECM ratio (proteoglycan:collagen) were calculated from the Movat’s Pentachrome images via an in-house MATLAB code. (C) Collagen pixels/section is significantly higher at 6 and 12 months, while the (D) proteoglycan pixels are significantly higher at 2.5 months in the Fbn1C1041G/+ MFS mice. The (E) ECM ratio (proteoglycan:collagen) is significantly higher in the Fbn1C1041G/+ MFS mice at 2.5 months. The overall trend of (F) ECM ratio is shown. A two-way ANOVA was utilized, data are reported as mean ± SEM and a p-value < 0.05 was statistically significant.
Figure 5:
Figure 5:. Collagen fiber maturity and remodeling are altered in Fbn1C1041G/+ MFS mice.
Picrosirius red images (A) at P7 and (A, B) 2.5 months, looking at differences in (A, C-F) collagen I (yellow-orange) and III (green) via (C, D) in-house MATLAB quantification of (A) birefringence and (E, F) qPCR. At (C, D) P7 collagen I and III levels are similar in Fbn1C1041G/+ MFS compared to the WTs, but at 2.5 months an increase (significantly for collagen I) is seen in the Fbn1C1041G/+ MFS mice, yet the collagen seems to be (B) less organized in (B) bright field. At later timepoints, (E, F) the gene expression of collagen for the WT mice remains unchanged from 2, 6 and 12 months, while the Fbn1C1041G/+ MFS mice increase (significantly for collagen I). All qPCR graphs are normalized to 18S (dotted gray lines). A two-way ANOVA was utilized, data are reported as mean ± SEM and a p-value < 0.05 was statistically significant. White arrows point to leaflet tips. Brown deposits in bright field (B) are melanocytes. White boxes signify the zoomed in areas (2 × 2) of the leaflet tips, demonstrating the isolated green (dotted white boxes) pixels.
Figure 6:
Figure 6:. Collagen fiber structure and orientation are altered in Fbn1C1041G/+ MFS mice.
(A-H) Multi-photon confocal microscopy at 60x was performed at P7, 2-, 6- and 12 months of age. WT mice MVs have organized structure (A-D) of collagen throughout, while the MFS have disorganized structure (E-H) and abnormal fibers, progressing with age. Zoomed in areas (2.250 × 1.750) of the leaflet tips are shown in dotted white boxes. Red signal signifies second harmonic generation of collagen fiber bundles. A signifies atrialis side (laminar flow side) and F signifies the fibrosa side. Blue arrows indicate organized collagen, white arrows indicate denser collagen and yellow arrows indicate loose collagen areas.
Figure 7:
Figure 7:. Matrifibrocyte marker genes Chad, Fmod and Cilp2 are dysregulated in Fbn1C1041G/+ MFS MVs.
(A) RNA scope in-situ hybridization was performed for the matrifibrocyte marker (Chad-red) at P7 and 2.5 months mice, with quantification by (B) in-house MATLAB quantification, and (C) qPCR. (B, C) at P7 no changes are seen, but at 2.5 months (B) Chad expression is significantly decreased in Fbn1C1041G/+ MFS compared to WT mice at the leaflet tips. (C-E) The gene expression of matrifibrocyte markers significantly increases at 6 months and 2 months in Fbn1C1041G/+ MFS. All qPCR graphs are normalized to 18S. A two-way ANOVA was utilized; data are reported as mean ± SEM and a p-value < 0.05 was statistically significant. White arrows point to regions of positive staining of Chad in the leaflets.
Figure 8:
Figure 8:. Model demonstrating mitral valve disease progression and ECM changes in Fbn1C1041G/+ MFS mice.
The extracellular matrix changes in (A) Fbn1 WT (WT) and (B) Fbn1C1041G/+ MFS mice are apparent by 2 months, when mitral valve thickening and increased proteoglycans (blue) are observed. (A) Demonstrates the normal extracellular remodeling and aging process, while (B) shows the defective extracellular matrix remodeling and abnormal aging in Fbn1C1041G/+ MFS mice. Major findings include increases in proteoglycans and MVP at 2 months, followed by collagen compensation, and matrifibrocyte gene expression, with a decrease in overall stiffness of the mitral valve leaflets at 6 and 12 months. Indicators of matrifibrocytes (red dots) are increased at 6 months, when collagen fiber structural abnormalities also occur. This figure was created with BioRender.com.

Similar articles

Cited by

References

    1. Hinton RB Jr., et al., Extracellular matrix remodeling and organization in developing and diseased aortic valves. Circ Res, 2006. 98(11): p. 1431–8. - PubMed
    1. Levine RA, et al., Mitral valve disease--morphology and mechanisms. Nat Rev Cardiol, 2015. 12(12): p. 689–710. - PMC - PubMed
    1. Nishimura RA, Vahanian A, Eleid MF, and Mack MJ, Mitral valve disease--current management and future challenges. Lancet, 2016. 387(10025): p. 1324–34. - PubMed
    1. Ramirez F, Caescu C, Wondimu E, and Galatioto J, Marfan syndrome; A connective tissue disease at the crossroads of mechanotransduction, TGFβ signaling and cell stemness. Matrix Biol, 2018. 71–72: p. 82–89. - PMC - PubMed
    1. Milewicz DM, et al., Marfan syndrome. Nat Rev Dis Primers, 2021. 7(1): p. 64. - PMC - PubMed

LinkOut - more resources