

Human lifespan and sex-specific patterns of resilience to disease: a retrospective population-wide cohort study
- PMID: 38185624
- PMCID: PMC10773063
- DOI: 10.1186/s12916-023-03206-w
Human lifespan and sex-specific patterns of resilience to disease: a retrospective population-wide cohort study
Abstract
Background: Slower paces of aging are related to lower risk of developing diseases and premature death. Therefore, the greatest challenge of modern societies is to ensure that the increase in lifespan is accompanied by an increase in health span. To better understand the differences in human lifespan, new insight concerning the relationship between lifespan and the age of onset of diseases, and the ability to avoid them is needed. We aimed to comprehensively study, at a population-wide level, the sex-specific disease patterns associated with human lifespan.
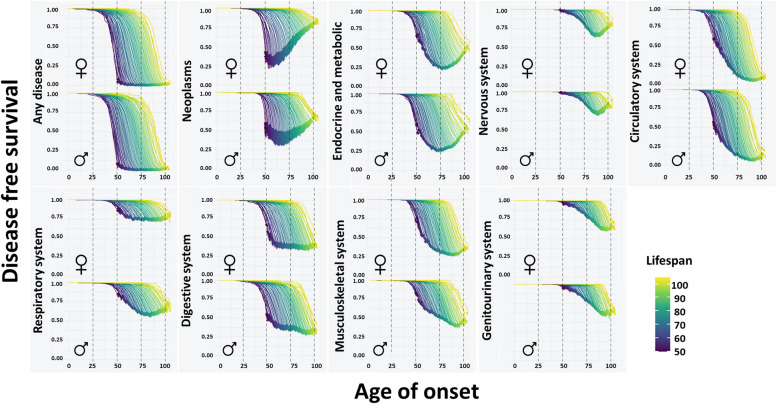
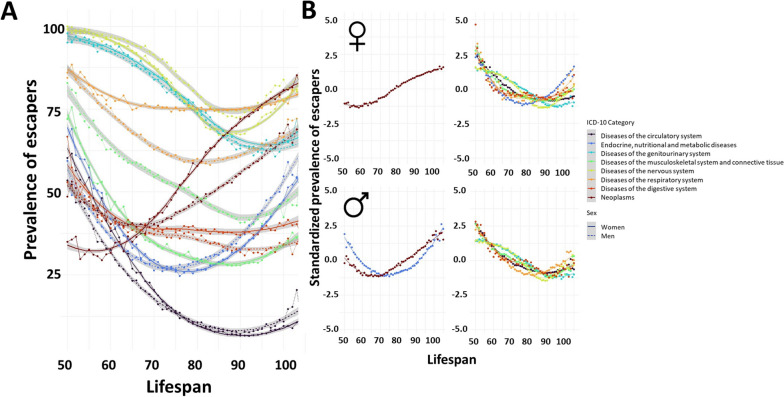
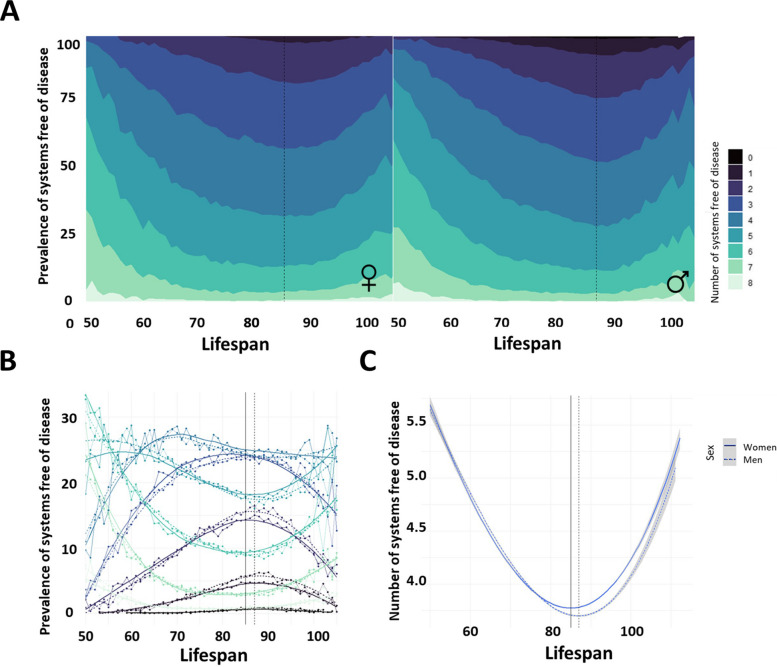
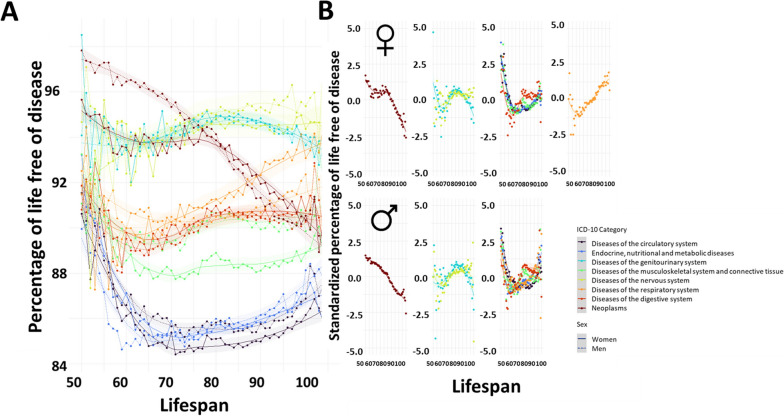
Methods: Observational data from the SIDIAP database of a cohort of 482,058 individuals that died in Catalonia (Spain) at ages over 50 years old between the 1st of January 2006 and the 30th of June 2022 were included. The time to the onset of the first disease in multiple organ systems, the prevalence of escapers, the percentage of life free of disease, and their relationship with lifespan were evaluated considering sex-specific traits.
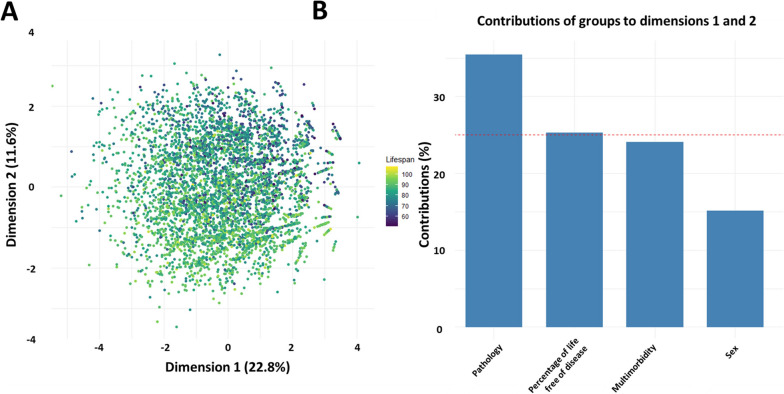
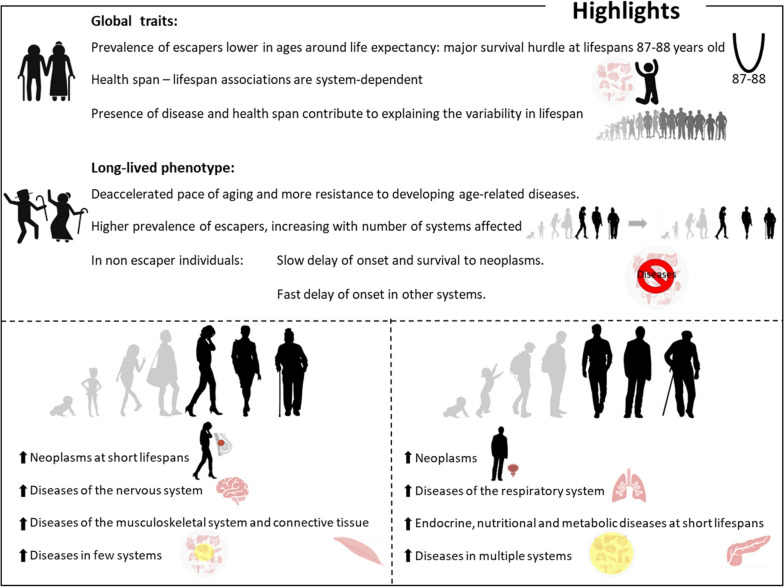
Results: In the study cohort, 50.4% of the participants were women and the mean lifespan was 83 years. The results show novel relationships between the age of onset of disease, health span, and lifespan. The key findings include: Firstly, the onset of both single and multisystem diseases is progressively delayed as lifespan increases. Secondly, the prevalence of escapers is lower in lifespans around life expectancy. Thirdly, the number of disease-free systems decreases until individuals reach lifespans around 87-88 years old, at which point it starts to increase. Furthermore, long-lived women are less susceptible to multisystem diseases. The associations between health span and lifespan are system-dependent, and disease onset and the percentage of life spent free of disease at the time of death contribute to explaining lifespan variability. Lastly, the study highlights significant system-specific disparities between women and men.
Conclusions: Health interventions focused on delaying aging and age-related diseases should be the most effective in increasing not only lifespan but also health span. The findings of this research highlight the relevance of Electronic Health Records in studying the aging process and open up new possibilities in age-related disease prevention that should assist primary care professionals in devising individualized care and treatment plans.
Keywords: Age-related diseases; Aging; Electronic health records; Escapers; Health span; Human lifespan; Primary care.
© 2023. The Author(s).
Conflict of interest statement
The authors declare that this research was conducted in the absence of any commercial or financial relationship that could be considered as a potential conflict of interest.
Figures
Similar articles
-
Germline burden of rare damaging variants negatively affects human healthspan and lifespan.Elife. 2020 Apr 7;9:e53449. doi: 10.7554/eLife.53449. Elife. 2020. PMID: 32254024 Free PMC article.
-
On the measurement of healthy lifespan inequality.Popul Health Metr. 2022 Jan 4;20(1):1. doi: 10.1186/s12963-021-00279-8. Popul Health Metr. 2022. PMID: 34983576 Free PMC article.
-
Morbidity profiles of centenarians: survivors, delayers, and escapers.J Gerontol A Biol Sci Med Sci. 2003 Mar;58(3):232-7. doi: 10.1093/gerona/58.3.m232. J Gerontol A Biol Sci Med Sci. 2003. PMID: 12634289
-
Toward the realization of a better aged society: messages from gerontology and geriatrics.Geriatr Gerontol Int. 2012 Jan;12(1):16-22. doi: 10.1111/j.1447-0594.2011.00776.x. Geriatr Gerontol Int. 2012. PMID: 22188494 Review.
-
Immunogenetics, gender, and longevity.Ann N Y Acad Sci. 2006 Nov;1089:516-37. doi: 10.1196/annals.1386.051. Ann N Y Acad Sci. 2006. PMID: 17261795 Review.
Cited by
-
Ether lipids and sphingolipids drive sex-specific human aging dynamics.Redox Biol. 2025 Jul 18;85:103779. doi: 10.1016/j.redox.2025.103779. Online ahead of print. Redox Biol. 2025. PMID: 40706291 Free PMC article.
-
Association of biological aging acceleration transitions and burdens with incident cardiovascular disease: longitudinal insights from a national cohort study.BMC Med. 2025 Jul 1;23(1):347. doi: 10.1186/s12916-025-04177-w. BMC Med. 2025. PMID: 40598448 Free PMC article.
-
Analysis of sex-specific disease patterns associated with human lifespan.Geroscience. 2025 Jun;47(3):2639-2654. doi: 10.1007/s11357-024-01470-z. Epub 2025 Jan 15. Geroscience. 2025. PMID: 39809916 Free PMC article.
-
Centenarian hippocampus displays high levels of astrocytic metallothioneins.Aging Cell. 2024 Aug;23(8):e14201. doi: 10.1111/acel.14201. Epub 2024 May 20. Aging Cell. 2024. PMID: 38769809 Free PMC article.
References
-
- United Nations Department of Economic and Social Affairs, Population Division. World population prospects 2022: summary of results. 2022. UN DESA/POP/2022/TR/NO. 3.
Publication types
MeSH terms
Grants and funding
- PP10605-PIRS2021/Diputació de lleida
- 2021SGR00990/Departament d'Innovació, Universitats i Empresa, Generalitat de Catalunya
- 2021SGR01481/Departament d'Innovació, Universitats i Empresa, Generalitat de Catalunya
- 2021SGR01345/Departament d'Innovació, Universitats i Empresa, Generalitat de Catalunya
- SLT002/16/00250/Departament de Salut, Generalitat de Catalunya
LinkOut - more resources
Full Text Sources
