. 2024 Jan 8;22(1):11.
doi: 10.1186/s12916-023-03232-8.

Single-cell RNA sequencing in donor and end-stage heart failure patients identifies NLRP3 as a therapeutic target for arrhythmogenic right ventricular cardiomyopathy

Affiliations

Single-cell RNA sequencing in donor and end-stage heart failure patients identifies NLRP3 as a therapeutic target for arrhythmogenic right ventricular cardiomyopathy

Mengxia Fu et al. BMC Med. .

Abstract

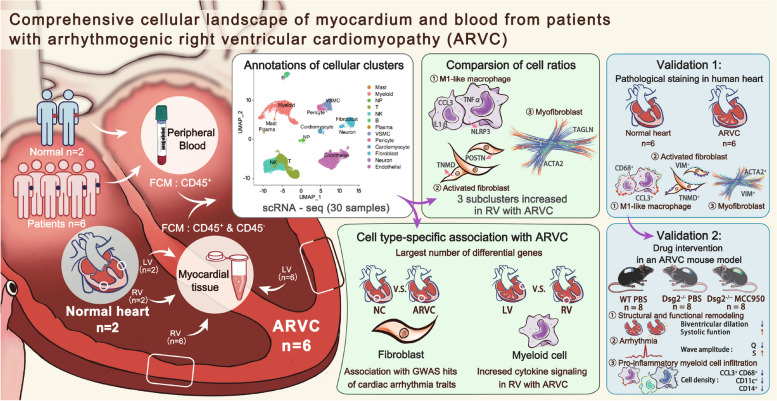
Background: Dilation may be the first right ventricular change and accelerates the progression of threatening ventricular tachyarrhythmias and heart failure for patients with arrhythmogenic right ventricular cardiomyopathy (ARVC), but the treatment for right ventricular dilation remains limited.

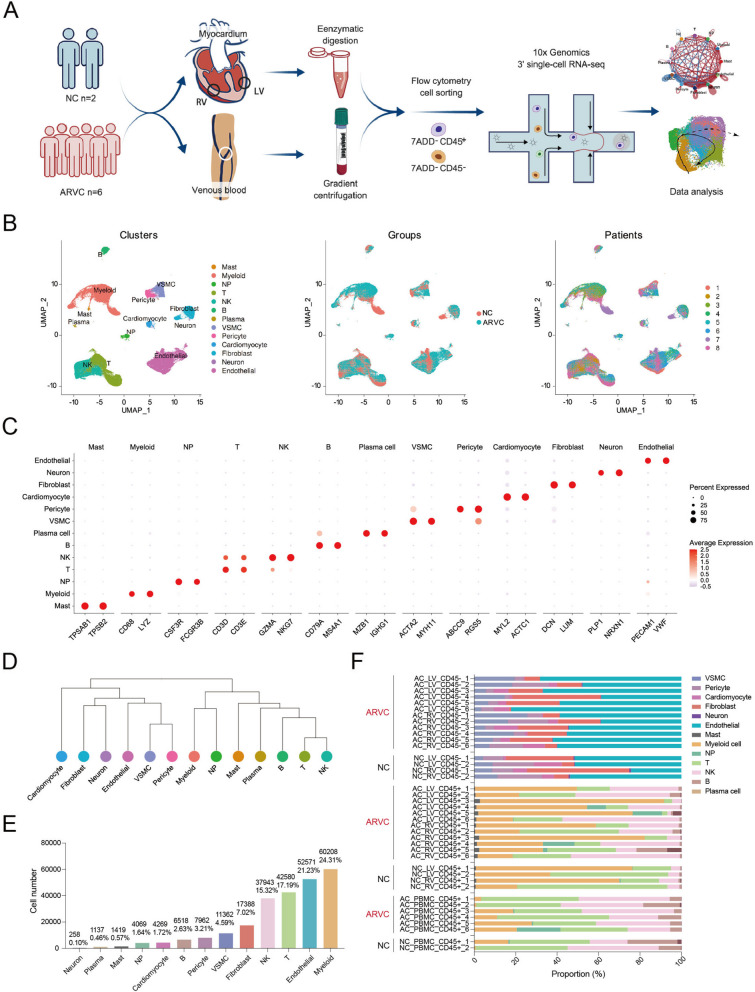
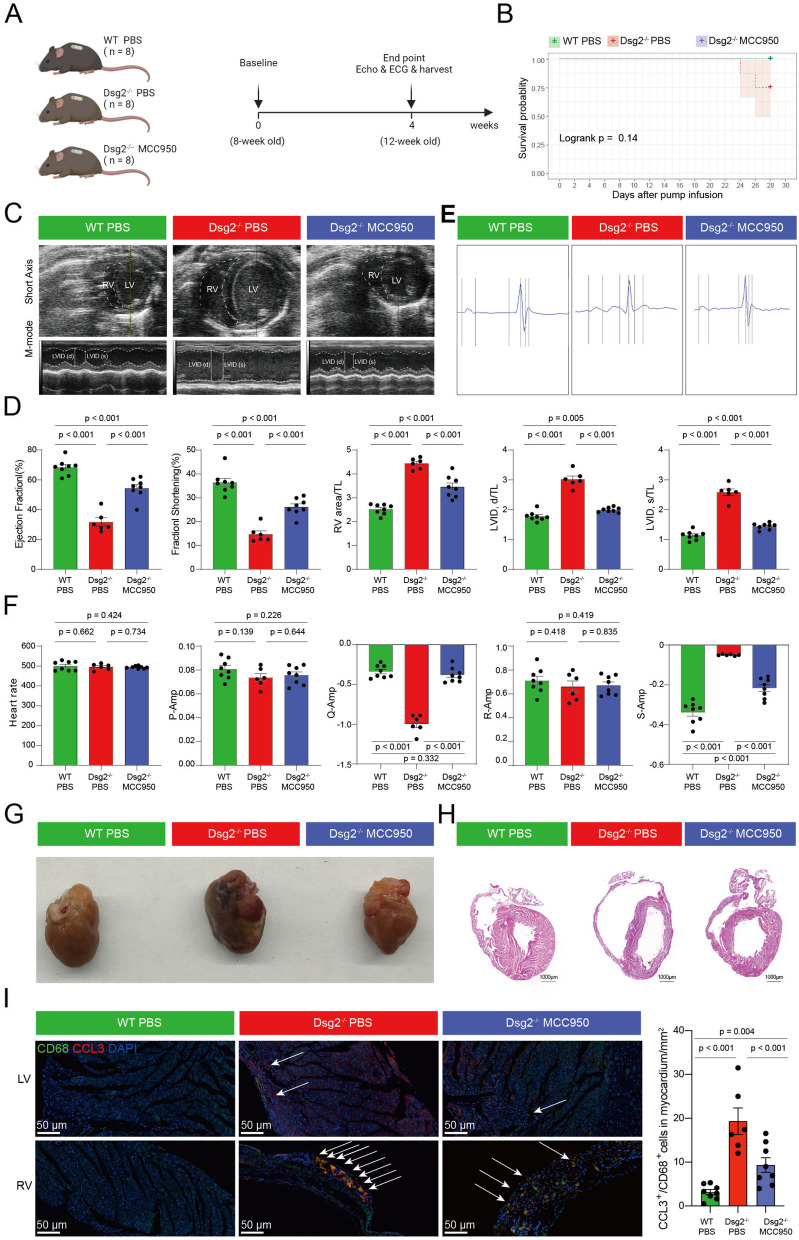
Methods: Single-cell RNA sequencing (scRNA-seq) of blood and biventricular myocardium from 8 study participants was performed, including 6 end-stage heart failure patients with ARVC and 2 normal controls. ScRNA-seq data was then deeply analyzed, including cluster annotation, cellular proportion calculation, and characterization of cellular developmental trajectories and interactions. An integrative analysis of our single-cell data and published genome-wide association study-based data provided insights into the cell-specific contributions to the cardiac arrhythmia phenotype of ARVC. Desmoglein 2 (Dsg2)mut/mut mice were used as the ARVC model to verify the therapeutic effects of pharmacological intervention on identified cellular cluster.

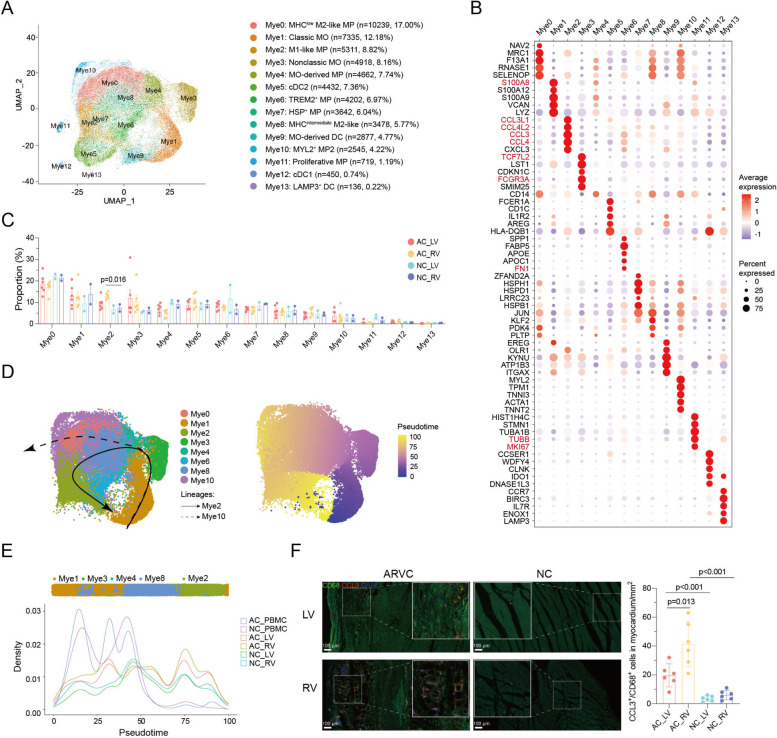
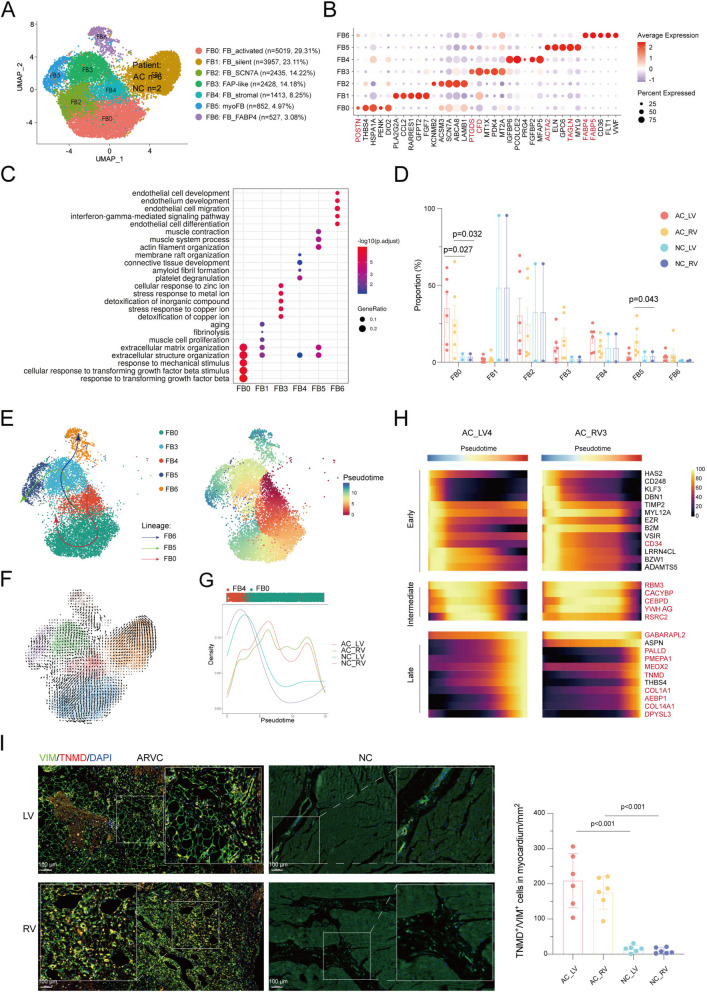
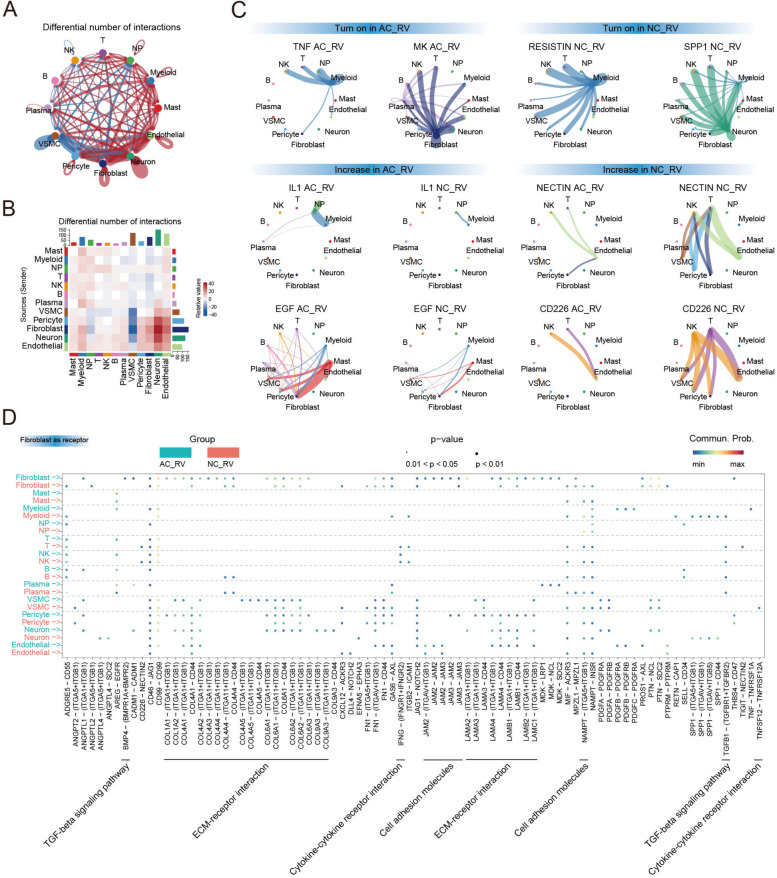
Results: Right ventricle of ARVC was enriched of CCL3+ proinflammatory macrophages and TNMD+ fibroblasts. Fibroblasts were preferentially affected in ARVC and perturbations associated with ARVC overlap with those reside in genetic variants associated with cardiac arrhythmia. Proinflammatory macrophages strongly interact with fibroblast. Pharmacological inhibition of Nod-like receptor protein 3 (NLRP3), a transcriptional factor predominantly expressed by the CCL3+ proinflammatory macrophages and several other myeloid subclusters, could significantly alleviate right ventricular dilation and dysfunction in Dsg2mut/mut mice (an ARVC mouse model).

Conclusions: This study provided a comprehensive analysis of the lineage-specific changes in the blood and myocardium from ARVC patients at a single-cell resolution. Pharmacological inhibition of NLRP3 could prevent right ventricular dilation and dysfunction of mice with ARVC.

Keywords: Arrhythmogenic right ventricular cardiomyopathy; NLRP3; Single-cell RNA sequencing.


Conflict of interest statement

The authors declare that they have no competing interests.

Figures

Fig. 1
Fig. 1
Overview of the 247,684 single cells isolated from ARVC and NC human hearts. A Workflow of the present study. B UMAP plots of the 247,684 cells colored according to the 13 major cell types, two phases, and 8 patients (left to right). C Expression of classic marker genes used to define the major cell types. D Dendrogram demonstrating the similarity of cluster centroids. E Cell numbers of each of the 13 major cell types. F Stacked bar plot depicting the cell-type composition of each sample. UMAP, uniform manifold approximation and projection; ARVC, arrhythmogenic right ventricular cardiomyopathy; NC, normal control; AC_LV, left ventricle of ARVC; AC_RV, right ventricle of ARVC; NC_LV, left ventricle of NC; NC_RV, right ventricle of NC; AC_PBMC, PBMC of ARVC; PBMC, peripheral blood mononuclear cell; NK, natural killer; NP, neutrophils; VSMC, vascular smooth muscle cell
Fig. 2
Fig. 2
Myeloid subpopulations in ARVC human hearts. A UMAP embedding of 18 myeloid subpopulations. B Dot plot showing the top five marker genes of each subcluster. Dot color and size correspond to the expression of each gene and the proportion of cells expressing each gene, respectively. C The ratio of each subcluster in the different phases and topographic regions. D, E Trajectory analysis of selected clusters. F Multiple labeling staining for CCL3+ CD68+ macrophages; scale bar indicates 100 μm. Each spot represents one sample. Data are mean ± SD. Mann–Whitney U test was performed to compare the cellular ratio of Mye2 between ARVC and NC. UMAP, uniform manifold approximation and projection; ARVC, arrhythmogenic right ventricular cardiomyopathy; NC, normal control; AC_LV, left ventricle of ARVC; AC_RV, right ventricle of ARVC; NC_LV, left ventricle of NC; NC_RV, right ventricle of NC; AC_PBMC, PBMC of ARVC; PBMC, peripheral blood mononuclear cell; MP, macrophage; MO, monocyte; DC, dendritic cell; DEGs, differentially expressed genes. Gene names mentioned in the main text are color-coded
Fig. 3
Fig. 3
Fibroblast subpopulations in ARVC human hearts. A UMAP embedding of eight fibroblast subpopulations. B Dot plot showing the top five marker genes of each subcluster. Dot color and size correspond to the expression of each gene and the proportion of cells expressing each gene, respectively. C The top five enriched GOBP of each cluster. D The ratio of each subcluster in the different phases and topographic regions. E Trajectory analysis of selected fibroblast clusters based on Slingshot. F RNA velocity of fibroblast clusters. G Density plots reflecting the number of FB cells along the lineage FB0 stratified for different phases and topographic regions. H Predicted expression of genes showing interesting patterns based on a negative binomial generalized additive model (NB-GAM) for each gene across pseudotime in patient AC_LV_4 (left) and patient AC_RV_3 (right). Normalized expression is smoothed expression from NB-GAM scaled to the maximum value for each gene. I Multiple labeling staining for TNMD+ VIM+ fibroblasts; scale bar indicates 100 μm. Each spot represents one sample. Data are mean ± SD. Mann–Whitney U test was performed to compare the cellular ratio of TNMD+ VIM+ fibroblasts between ARVC and NC. FAP, fibro-adipogenic progenitor; FB, fibroblast; ARVC, arrhythmogenic right ventricular cardiomyopathy; NC, normal control; AC_LV, left ventricle of ARVC; AC_RV, right ventricle of ARVC; NC_LV, left ventricle of NC; NC_RV, right ventricle of NC; AC_PBMC, PBMC of ARVC. Gene names mentioned in the main text were color-coded
Fig. 4
Fig. 4
Fibroblasts may partially contribute to the cardiac arrhythmia of ARVC. A Log-fold-change and two-sided P-value for expression changes between AC_RV (n = 6) and NC_RV (n = 2) (left), AC_LV (n = 6) and NC_LV (n = 2) (center), and AC_RV and AC_LV (right) hearts for each gene tested using limma–voom differential expression analysis. Genes are colored by cell type with larger, opaque dots representing genes with FDR < 0.01 based on the Benjamini–Hochberg procedure. B The number of significantly differentially expressed genes (FDR < 0.01) by cell type for each comparison in (A). C Reactome pathway enrichment for differential expression between each comparison in (A) by cell type. The size of each square represents a two-sided P-value from GSEA and shading represents the normalized enrichment score (NES). Only pathways with a Benjamini–Hochberg FDR < 0.05 in both the GSEA and hypergeometric test for over-representation in at least one cell type are shown. Pathways with FDR < 0.05 in the GSEA test are denoted with a black outline. D Dot plot showing the number of DEGs per cell type that overlaps as GWAS risk variants across cardiac arrhythmia traits from the GWAS catalog (NHGRI-EBI) [39]. Significance of overlap is based on FDR < 0.05. GSEA, gene set enrichment analysis; NES, normalized enrichment score; FDR, false discovery rate; ARVC, arrhythmogenic right ventricular cardiomyopathy; NC, normal control; AC_LV, left ventricle of ARVC; AC_RV, right ventricle of ARVC; NC_LV, left ventricle of NC; NC_RV, right ventricle of NC; AC_PBMC, PBMC of ARVC; PBMC, peripheral blood mononuclear cell; NK, natural killer; NP, neutrophils; VSMC, vascular smooth muscle cell; DEGs, differentially expressed genes
Fig. 5
Fig. 5
Predicted and altered cell–cell interactions in ARVC patient hearts. A Net plot showing the interaction number and weight among the 12 major cell clusters. Each dot indicates one cell cluster and its size is proportional to the number of cells in the cluster. The thickness of the lines connecting cell clusters indicates the differential interaction number (blue line indicates an increase in NC_RV, red line indicates an increase in AC_RV). B Differential number of the cellular interactions between NC_RV and the AC_RV. Red and blue represent enrichment in the AC_RV and NC_RV, respectively. C Circos plots showing the inferred intercellular communication network among the major cell types. D Bubble plot showing the selected ligand–receptor interactions between the 12 major cell types (ligand) and fibroblasts. ARVC, arrhythmogenic right ventricular cardiomyopathy; NC, normal control; AC_LV, left ventricle of ARVC; AC_RV, right ventricle of ARVC; NC_LV, left ventricle of NC; NC_RV, right ventricle of NC; AC_PBMC, PBMC of ARVC; PBMC, peripheral blood mononuclear cell; NK, natural killer; NP, neutrophils; VSMC, vascular smooth muscle cell
Fig. 6
Fig. 6
Pharmacological inhibition of proinflammatory macrophages significantly alleviate the right ventricular dysfunction in a ARVC mouse model. A Experimental protocol. B Survival curve. C Representative short-axis M-mode Echo from PBS-infused wild type and Dsg2mut/mut mice, and MCC950-infused Dsg2mut/mut mice at 12 weeks of age. D Echo of PBS-infused wild type and Dsg2mut/mut mice, and MCC950-infused Dsg2mut/mut mice at 12 weeks of age. E, F Representative signal-averaged electrocardiograms (E) and electrocardiogram parameters (F) of PBS-infused wild type and Dsg2mut/mut mice, and MCC950-infused Dsg2mut/mut mice at 12 weeks of age. G, H Representative gross pathology (G) and long-axis sections of the hearts stained with H&E-stained (H) micrographs from PBS-infused wild type and Dsg2mut/mut mice, and MCC950-infused Dsg2mut/mut mice at 12 weeks of age. Scale bar, 1000 µm. I Multiple labeling staining for CCL3+ CD68+ macrophages; scale bar indicates 100 μm. Each spot represents one sample. Data are mean ± SD. The Mann–Whitney U test was performed to compare the cellular ratio of CCL3+ CD68+ macrophages.TL, tibial length; LVIDs, left ventricular internal diameter at end-diastole; LVIDs, left ventricular internal diameter at end-systole; P-Amp, P-wave amplitude; R-Amp, R-wave amplitude; Q-Amp, Q-wave amplitude; S-Amp, S-wave amplitude
Fig. 7
Fig. 7
Summary of the present study. We constructed a comprehensive cellular landscape of human biventricular myocardium and blood from 6 end-stage heart patients with ARVC and 2 normal controls by using single-cell RNA sequencing. We identified the increased cell ratios of M1-macrophage, activated fibroblast, and myofibroblast in right ventricle with ARVC compared to normal control. The cell type-specific association with ARVC were also described. To sure robust science, we used two validation methods of the key findings of single-cell RNA sequencing data, including pathological staining in human heart with a larger sample size and drug intervention in an ARVC mouse model. ARVC, arrhythmogenic right ventricular cardiomyopathy

References

    1. Leren IS, Saberniak J, Haland TF, Edvardsen T, Haugaa KH. Combination of ECG and echocardiography for identification of arrhythmic events in early ARVC. JACC Cardiovasc Imaging. 2017;10(5):503–513. doi: 10.1016/j.jcmg.2016.06.011. - DOI - PubMed
    1. Chen S, Chen L, Saguner AM, Chen K, Akdis D, Gasperetti A, Brunckhorst C, Tang H, Guo G, Rao M, et al. Novel risk prediction model to determine adverse heart failure outcomes in arrhythmogenic right ventricular cardiomyopathy. J Am Heart Assoc. 2022;11(13):e024634. doi: 10.1161/JAHA.121.024634. - DOI - PMC - PubMed
    1. Chelko SP, Asimaki A, Lowenthal J, Bueno-Beti C, Bedja D, Scalco A, Amat-Alarcon N, Andersen P, Judge DP, Tung L, et al. Therapeutic modulation of the immune response in arrhythmogenic cardiomyopathy. Circulation. 2019;140(18):1491–1505. doi: 10.1161/CIRCULATIONAHA.119.040676. - DOI - PMC - PubMed
    1. Campuzano O, Alcalde M, Iglesias A, Barahona-Dussault C, Sarquella-Brugada G, Benito B, Arzamendi D, Flores J, Leung TK, Talajic M, et al. Arrhythmogenic right ventricular cardiomyopathy: severe structural alterations are associated with inflammation. J Clin Pathol. 2012;65(12):1077–1083. doi: 10.1136/jclinpath-2012-201022. - DOI - PubMed
    1. Moccia F, Lodola F, Stadiotti I, Pilato CA, Bellin M, Carugo S, Pompilio G, Sommariva E, Maione AS. Calcium as a Key Player in Arrhythmogenic Cardiomyopathy: Adhesion Disorder or Intracellular Alteration? Int J Mol Sci. 2019;20(16):3986. doi: 10.3390/ijms20163986. - DOI - PMC - PubMed

Publication types

Substances