. 2024 Jan 8;16(1):5.
doi: 10.1186/s13073-023-01265-5.

Rare copy-number variants as modulators of common disease susceptibility

Collaborators, Affiliations

Rare copy-number variants as modulators of common disease susceptibility

Chiara Auwerx et al. Genome Med. .

Abstract

Background: Copy-number variations (CNVs) have been associated with rare and debilitating genomic disorders (GDs) but their impact on health later in life in the general population remains poorly described.

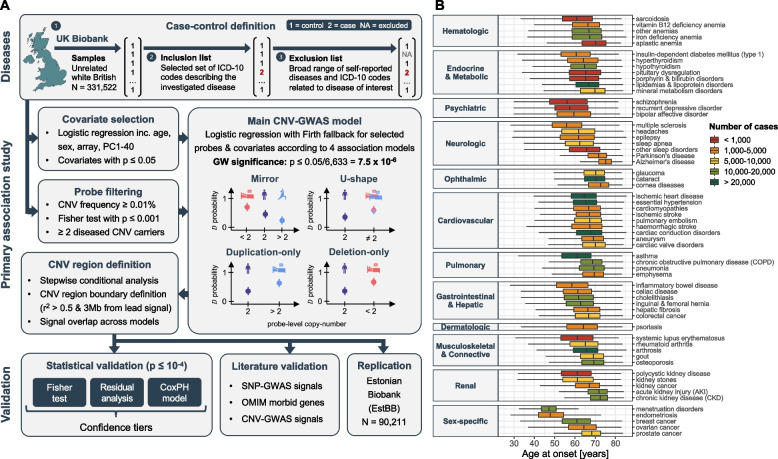
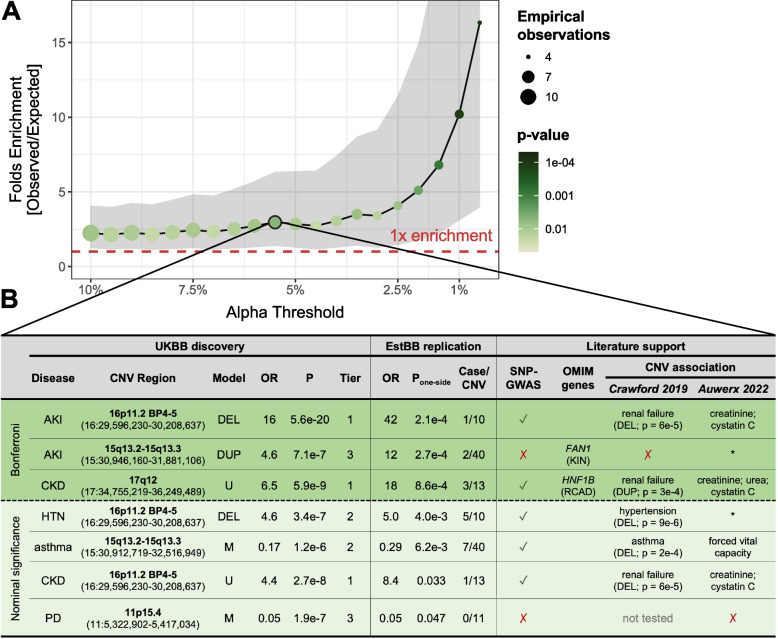
Methods: Assessing four modes of CNV action, we performed genome-wide association scans (GWASs) between the copy-number of CNV-proxy probes and 60 curated ICD-10 based clinical diagnoses in 331,522 unrelated white British UK Biobank (UKBB) participants with replication in the Estonian Biobank.

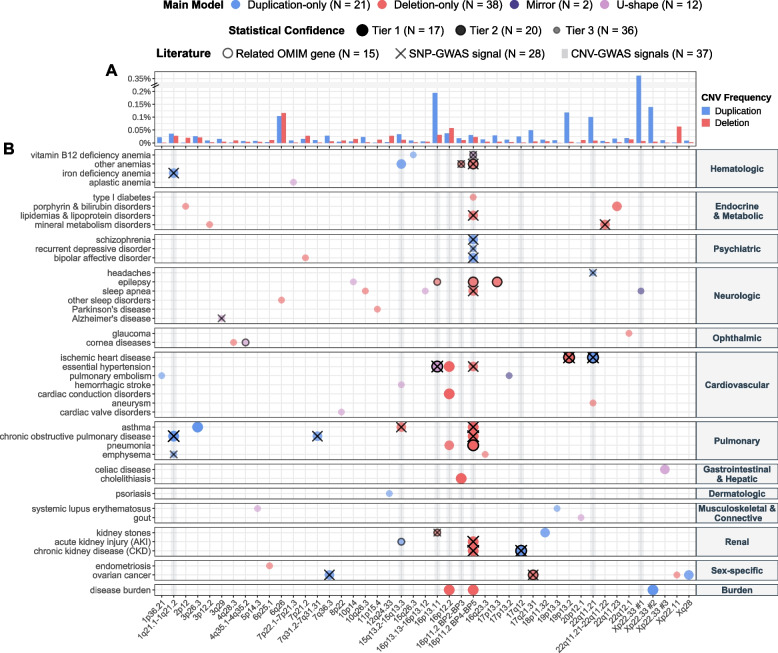
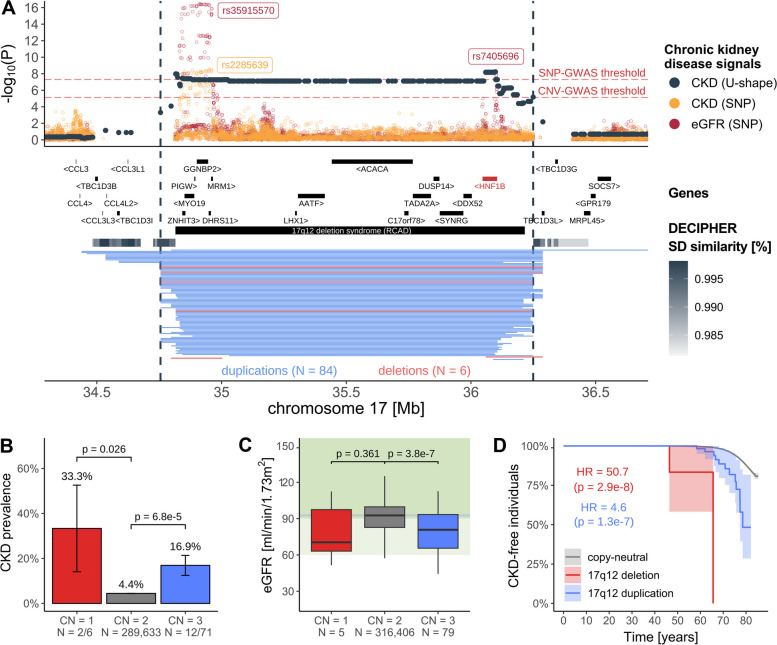
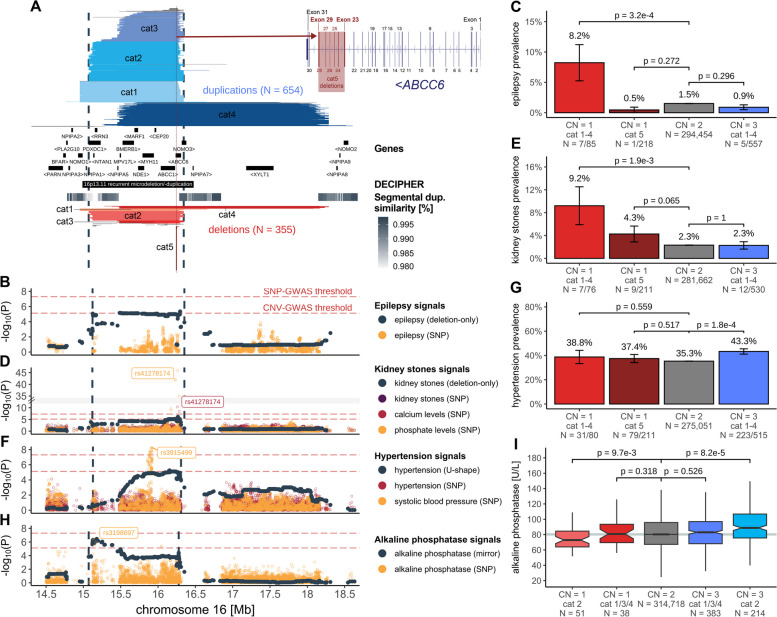
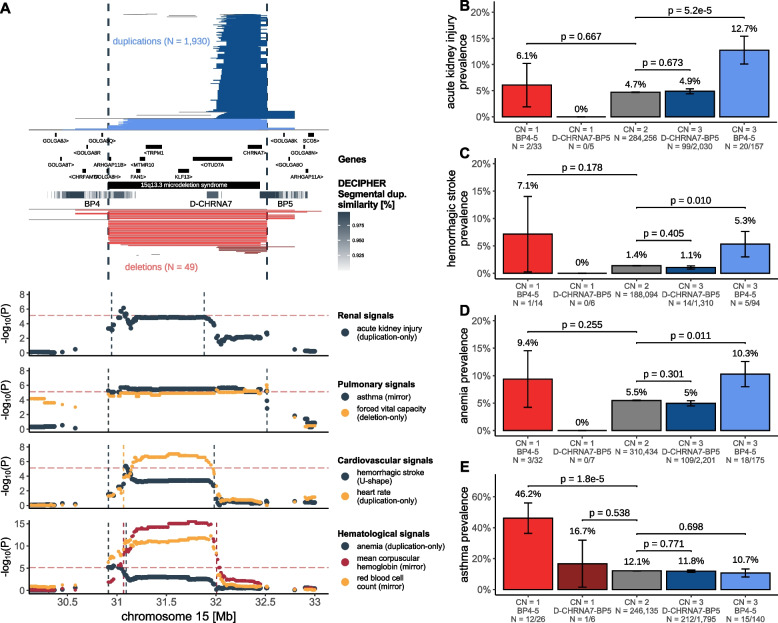
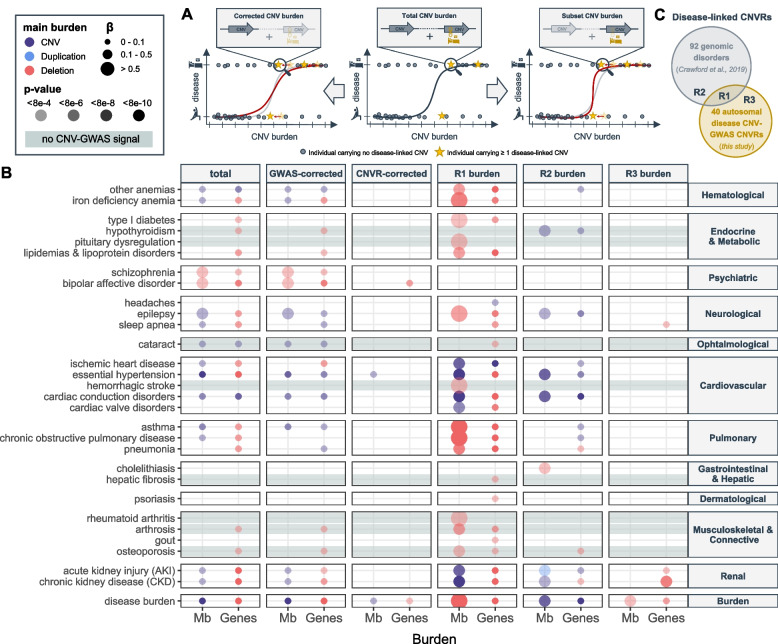
Results: We identified 73 signals involving 40 diseases, all of which indicating that CNVs increased disease risk and caused earlier onset. We estimated that 16% of these associations are indirect, acting by increasing body mass index (BMI). Signals mapped to 45 unique, non-overlapping regions, nine of which being linked to known GDs. Number and identity of genes affected by CNVs modulated their pathogenicity, with many associations being supported by colocalization with both common and rare single-nucleotide variant association signals. Dissection of association signals provided insights into the epidemiology of known gene-disease pairs (e.g., deletions in BRCA1 and LDLR increased risk for ovarian cancer and ischemic heart disease, respectively), clarified dosage mechanisms of action (e.g., both increased and decreased dosage of 17q12 impacted renal health), and identified putative causal genes (e.g., ABCC6 for kidney stones). Characterization of the pleiotropic pathological consequences of recurrent CNVs at 15q13, 16p13.11, 16p12.2, and 22q11.2 in adulthood indicated variable expressivity of these regions and the involvement of multiple genes. Finally, we show that while the total burden of rare CNVs-and especially deletions-strongly associated with disease risk, it only accounted for ~ 0.02% of the UKBB disease burden. These associations are mainly driven by CNVs at known GD CNV regions, whose pleiotropic effect on common diseases was broader than anticipated by our CNV-GWAS.

Conclusions: Our results shed light on the prominent role of rare CNVs in determining common disease susceptibility within the general population and provide actionable insights for anticipating later-onset comorbidities in carriers of recurrent CNVs.

Keywords: 16p11.2; 16p13.11; CNV; Common diseases; GWAS; Genomic disorders; Pleiotropy; Structural variation; Time-to-event analysis.


Conflict of interest statement

SO is an employee of MSD at the time of the submission; contribution to the research occurred during affiliation at the University of Lausanne. The remaining authors declare that they have no competing interests.

Figures

Fig. 1
Fig. 1
Overview of the study. A Schematic representation of the analysis workflow. Diseases: For each of the 60 investigated diseases, 331,552 unrelated white British individuals were divided into three subsets: controls (encoded as 1; step 1), cases with the disease (encoded as 2; step 2), and a subset of individuals who were excluded because they had conditions similar but not identical to the disease (encoded as NA; step 3). Primary association study: Disease-specific relevant covariates were selected. Probes were pre-filtered based on copy-number variant (CNV) frequency, Fisher test association p-value, and presence of ≥ 2 diseased carriers. Disease- and model-specific covariates and probes were used to generate tailored genome-wide CNV association scans (CNV-GWASs) based on Firth fallback logistic regression according to a mirror, U-shape, duplication-only (i.e., considering only duplications), and deletion-only (i.e., considering only deletions) models. Independent lead signals were identified through stepwise conditional analysis and CNV regions were defined based on probe correlation and merged across models. Validation: Statistical validation methods (i.e., Fisher test, residuals regression, and Cox proportional hazards model (CoxPH)) were used to rank associations in confidence tiers. Literature validation approaches leverage data from independent studies to corroborate that genetic perturbation (single-nucleotide polymorphisms (SNP), rare variants from the OMIM database, or CNVs) in the region are linked to the disease. Independent replication in the Estonian Biobank. B Age of onset for the 60 assessed diseases, grouped based on ICD-10 chapters and colored according to case count. Data are represented as boxplots; outliers are not shown
Fig. 2
Fig. 2
CNV-disease association map. A Duplication and deletion frequencies ([%]; y-axis; break: //) of the lead probe for each unique and non-overlapping disease-associated CNV region (CNVR), labeled with corresponding cytogenic band (x-axis; 16p11.2 is split to distinguish the distal 220 kb BP2-3 and proximal 600 kb BP4-5 CNVRs; non-overlapping CNVRs on the same cytogenic band are numbered). If signals mapping to the same CNVR have different lead probes, the maximal frequency was plotted. B Associations between CNVRs (x-axis) and diseases (y-axis) identified through CNV-GWAS. Color indicates the main association model. Size and transparency reflect the statistical confidence tier. Black contours indicate overlap with OMIM gene causing a disease with shared phenotypic features. Black crosses indicate overlap with SNP-GWAS signal for a related trait. Gray shaded vertical lines indicate CNVRs with continuous trait associations [27]. N provides count for various features
Fig. 3
Fig. 3
Replication of CNV-disease associations in the Estonian Biobank. A Enrichment for signal replication (y-axis; 95% confidence interval as gray ribbon) at different levels of significance (alpha; x-axis) in the Estonian Biobank (EstBB). Color and size indicate the p-value of the enrichment (one-sided binomial test) and the number of observed associations, respectively. Dashed red line indicates one-fold enrichment, i.e., the number of observed associations matches the number of expected ones. B Associations replicated at nominal significance in the EstBB, color-stratified according to whether they meet the replication (p ≤ 1.0 × 10−3; green) or nominal (p ≤ 0.05; light green) significance threshold. Disease (CKD = chronic kidney disease; AKI = acute kidney injury; HTN = hypertension; PD = Parkinson’s disease), cytogenic band and coordinates, best model (M = mirror; U = U-shape; DUP = duplication-only; DEL = deletion-only), odds ratio (OR), p-value (P), and statistical confidence tier are given for the UK Biobank (UKBB) discovery analysis. OR, one-sided p-values, and number of cases among CNV carriers are provided for the EstBB replication. Overlap with SNP-GWAS signals for a related trait (✓ = yes; ✗ = no) or a relevant OMIM gene (RCAD = renal cyst and diabetes; KIN = karyomegalic interstitial nephritis) is indicated. Previous association with diseases [24] (duplication (DUP) or deletion (DEL) was associated with indicated disease; no association (✗); some CNVRs were not tested) and continuous traits [27] (disease-relevant biomarkers are specified; other traits (*); no association (✗)) are listed
Fig. 4
Fig. 4
Increased and decreased dosage of 17q12 impairs kidney function. A 17q12 association landscape. Top: Negative logarithm of association p-values of CNVs (dark gray; CNV region (CNVR) delimited by vertical dashed lines) and single-nucleotide polymorphisms (SNPs) with chronic kidney disease (CKD; orange) [71] and SNPs with estimated glomerular filtration rate (eGFR; red) [72]. Lead SNPs are labeled. Red horizontal dashed lines represent the genome-wide threshold for significance for CNV-GWAS (p ≤ 7.5 × 10−6) and SNP-GWAS (p ≤ 5 × 10−8). Middle: Genomic coordinates of genes and DECIPHER GD, with HNF1B, the putative causal gene in red. Segmental duplications are represented as a gray gradient proportional to the degree of similarity. Bottom: Genomic coordinates of duplications (blue) and deletions (red) of UK Biobank participants overlapping the region. B CKD prevalence (± standard error) according to 17q12 copy-number (CN). P-values compare deletion (CN = 1) and duplication (CN = 3) carriers to copy-neutral (CN = 2) individuals (two-sided Fisher test). Number of cases and samples sizes are indicated (N = cases/sample size). C eGFR levels according to 17q12 CN, shown as boxplots; outliers are not shown. P-value comparisons as in B (two-sided t-test). Gray horizontal line represents median eGFR in non-carriers. Light and darker green background represent mildly decreased (60–90 ml/min/1.73m2) and normal (≥ 90 ml/min/1.73 m.2) kidney function, respectively. D Kaplan–Meier curve depicting the percentage, with 95% confidence interval, of individuals free of CKD over time among copy-neutral and 17q12 deletion and duplication carriers. Hazard ratio (HR) and p-value for deletion and duplication are given (CoxPH model)
Fig. 5
Fig. 5
Dissection of complex pleiotropic patterns of recurrent CNVs at 16p13.11. A 16p13.11 genetic landscape. Coordinates of UK Biobank duplications (shades of blue; top) and deletions (shades of red; bottom) overlapping the maximal CNV region (CNVR delimited by vertical dashed lines) associated with epilepsy, kidney stones, hypertension, and alkaline phosphatase (ALP). CNVs are divided and colored according to five categories (cat1-5) to reflect recurrent breakpoints, with atypical CNVs in gray (Additional file 1: Note S6). Breakpoints reflect segmental duplications, represented with a gray gradient proportional to the degree of similarity. Middle: genomic coordinates of genes and DECIPHER GD. Inset: Overlap between ABCC6’s exonic structure and cat5 deletions. B, D, F, H Negative logarithm of association p-values of CNVs (dark gray; model in parenthesis; CNVR delimited by vertical dashed lines) with B epilepsy, D kidney stones, F hypertension, and H ALP and SNPs with B epilepsy [73], D kidney stones [74], calcium levels, and phosphate levels (y-axis; break: //); F hypertension and systolic blood pressure [75], and H ALP. Lead SNPs are labeled. Red horizontal dashed lines represent genome-wide thresholds for significance for CNV-GWAS (p ≤ 7.5 × 10−6) and SNP-GWAS (p ≤ 5 × 10−8). C, E, G Prevalence (± standard error) of C epilepsy, E kidney stones, and G hypertension according to 16p13.11 copy-number (CN) and CNV categories from A. P-values compare carriers of specific deletions (CN = 1) and duplications (CN = 3) to copy-neutral (CN = 2) individuals (two-sided Fisher test). Number of cases and samples sizes are indicated (N = cases/sample size). I ALP levels according to 16p13.11 CN and CNV category, shown as boxplots; outliers are not shown. P-values compare carriers of specific deletions (CN = 1) and duplications (CN = 3) to copy-neutral (CN = 2) individuals (two-sided t-test). Gray horizontal line represents median ALP value in non-carriers
Fig. 6
Fig. 6
Dissection of complex pleiotropic patterns of recurrent CNVs at 15q13. A 15q13 genetic landscape. Top: Coordinates of duplications (shades of blue; top) and deletions (shades of red; bottom) overlapping the maximal CNV region (CNVR; delimited by vertical dashed lines) associated with acute kidney injury (AKI), asthma, forced vital capacity, hemorrhagic strokes, heart rate, anemia, mean corpuscular hemoglobin, and red blood cell count. CNVs are divided and colored according to whether they span breakpoint (BP) 4 to 5 or D-CHRNA7 to BP5, with atypical CNVs in gray (Additional file 1: Note 6). Breakpoints reflect segmental duplications, represented as a gray gradient proportional to the degree of similarity. Genomic coordinates of genes and DECIPHER GD are displayed. Bottom: Negative logarithm of association p-values of CNVs (best model in parenthesis) with renal, pulmonary, cardiovascular, and hematological traits. Traits-specific CNVRs are shown with vertical dashed lines. Red horizontal dashed line represents the genome-wide threshold for significance for CNV-GWAS (p ≤ 7.5 × 10−6). B, C, D, E Prevalence (± standard error) of B AKI, C hemorrhagic stroke, D anemia, and E asthma according to 15q13 copy-number (CN) and groups from A. P-values compare BP4-5 and D-CHRNA7-BP5 deletion (CN = 1) and duplication (CN = 3) carriers to copy-neutral (CN = 2) individuals (two-sided Fisher test). Number of cases and sample sizes are indicated (N = cases/sample size)
Fig. 7
Fig. 7
CNV burden at known genomic disorder CNVRs increases overall disease risk. A Burden calculation. Middle: Total CNV (duplication + deletion), duplication, or deletion burdens are calculated by summing up the length (in number of affected Mb or genes) of all CNVs, duplications, or deletions in an individual, respectively. Burden values are used as a predictor for disease risk. Left: Corrected burdens are calculated by summing up the length of all CNVs, duplications, or deletions that do not overlap with regions listed in a given genomic partition. Right: Subset burdens are calculated by summing up the length of all CNVs, duplications, or deletions that overlap with regions listed in a given genomic partition. Both corrected and subset burden values are used to re-estimate contribution of the CNV burden to disease risk (red curve). B Contribution of the total burden, CNV-GWAS signal- and CNVR-corrected burdens, and the R1, R2, and R3 subset burdens measured in number of affected Mb (x-axis; left) or genes (x-axis; right) to disease risk (y-axis). Only the effect of the most significantly associated of the CNV (purple), duplication (blue), or deletion (red) burdens, providing p ≤ 0.05/61 = 8.2 × 10−4, is shown. Color indicates whether the CNV, duplication, or deletion burden was most significantly associated, with size and transparency being proportional to the effect size (beta) and p-value, respectively. Gray horizontal bands mark traits with no CNV-GWAS signal. C Schematic representation of the R1, R2, and R3 partitions used to define the subset burdens in B

References

    1. Sudmant PH, Rausch T, Gardner EJ, Handsaker RE, Abyzov A, Huddleston J, et al. An integrated map of structural variation in 2,504 human genomes. Nature. 2015;526:75–81. doi: 10.1038/nature15394. - DOI - PMC - PubMed
    1. Conrad DF, Pinto D, Redon R, Feuk L, Gokcumen O, Zhang Y, et al. Origins and functional impact of copy number variation in the human genome. Nature. 2010;464:704–712. doi: 10.1038/nature08516. - DOI - PMC - PubMed
    1. Zhang F, Gu W, Hurles ME, Lupski JR. Copy Number Variationin Human Health, Disease, and Evolution. Annu Rev Genomics Hum Genet. 2009;10:451–481. doi: 10.1146/annurev.genom.9.081307.164217. - DOI - PMC - PubMed
    1. Weischenfeldt J, Symmons O, Spitz F, Korbel JO. Phenotypic impact of genomic structural variation: insights from and for human disease. Nat Rev Genet. 2013;14:125–138. doi: 10.1038/nrg3373. - DOI - PubMed
    1. Sebat J, Lakshmi B, Malhotra D, Troge J, Lese-martin C, Walsh T, et al. Strong Association of De Novo Copy Number Mutations with Autism. Science. 1979;2007(316):445–449. - PMC - PubMed

Publication types

LinkOut - more resources