. 2024 Jan 8;16(1):3.
doi: 10.1186/s13073-023-01274-4.

MAGPIE: accurate pathogenic prediction for multiple variant types using machine learning approach

Affiliations

MAGPIE: accurate pathogenic prediction for multiple variant types using machine learning approach

Yicheng Liu et al. Genome Med. .

Erratum in

Abstract

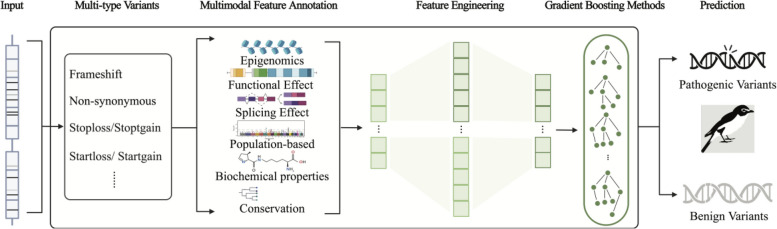
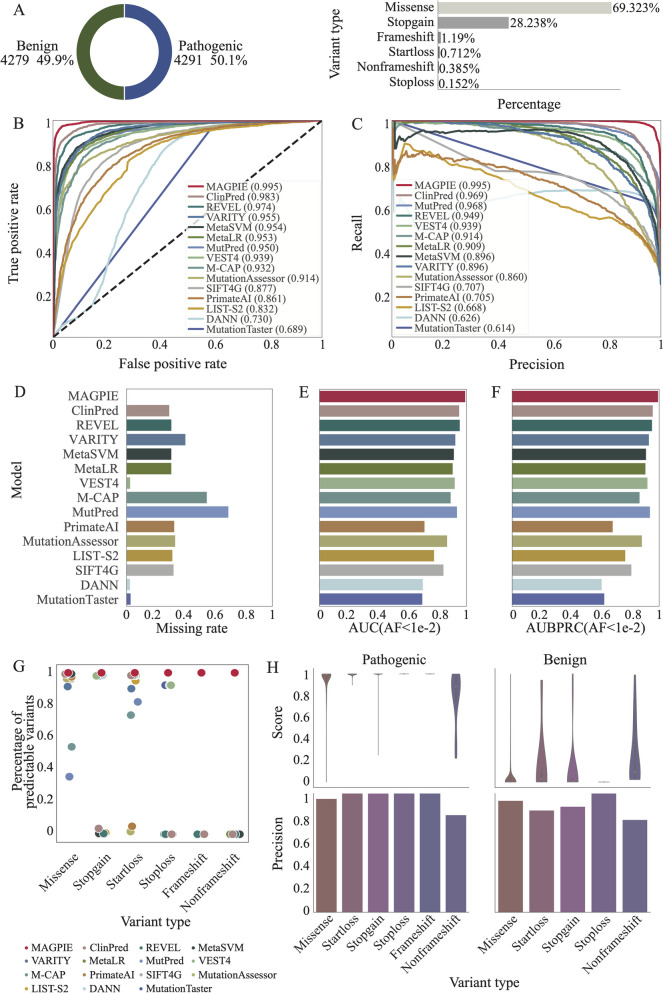
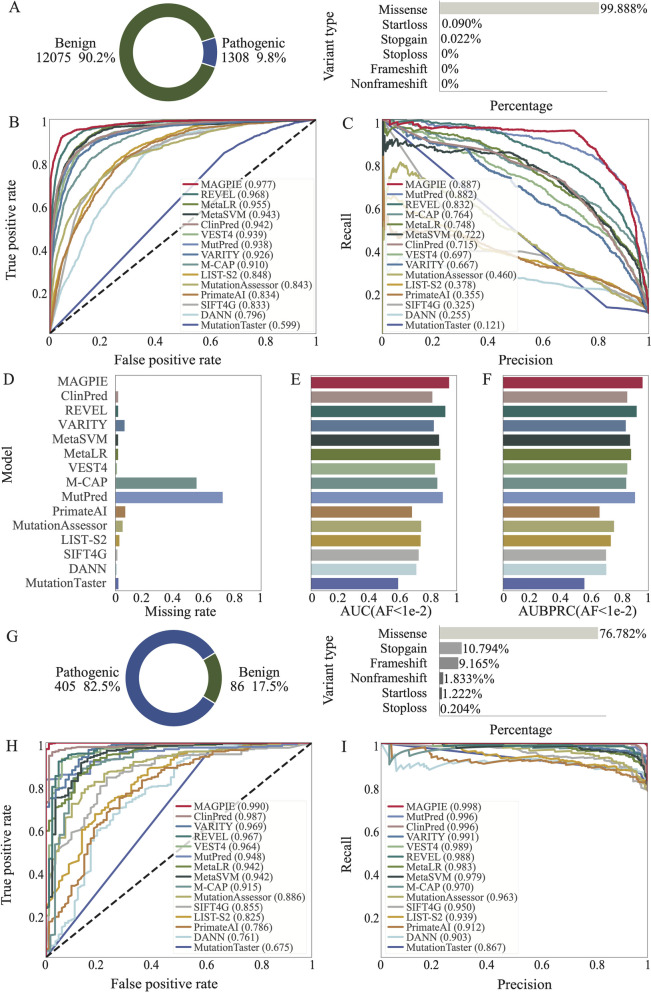
Identifying pathogenic variants from the vast majority of nucleotide variation remains a challenge. We present a method named Multimodal Annotation Generated Pathogenic Impact Evaluator (MAGPIE) that predicts the pathogenicity of multi-type variants. MAGPIE uses the ClinVar dataset for training and demonstrates superior performance in both the independent test set and multiple orthogonal validation datasets, accurately predicting variant pathogenicity. Notably, MAGPIE performs best in predicting the pathogenicity of rare variants and highly imbalanced datasets. Overall, results underline the robustness of MAGPIE as a valuable tool for predicting pathogenicity in various types of human genome variations. MAGPIE is available at https://github.com/shenlab-genomics/magpie .

Keywords: Genomic variation; Machine learning; Multimodal annotation; Pathogenic prediction.


Conflict of interest statement

The authors have submitted a patent application for the method. Other than this, the authors declare that they do not have any competing interests.

Figures

None
Algorithm 1. Dataset split
None
Algorithm 2. Separated feature selection
Fig. 1
Fig. 1
Framework of MAGPIE. The model was trained to predict pathogenic scores of multi-type variants and included three steps. First, candidate variants were annotated with high-dimensional features covering six different modalities. Second, automatic feature engineering and separated feature selection were undertaken step by step. Finally, a gradient boosting method with controllable tuning was implemented to train the model and obtain predictions for the pathogenicity of variants
Fig. 2
Fig. 2
Feature importance and correlation. A Correlation between features used to train MAGPIE. B A captivating hierarchical relationship diagram is presented, displaying the intricate relationship between features and the categories they belong to. Each dot in the outermost layer represents a distinct feature, while the size of the dots indicates their importance. The second layer depicts feature categories, with the size reflecting the sum of importance of the subordinate features. C The bar plot illustrates feature importance, which shows the contribution of each feature after feature selection. Part of the add-on features is automatically removed during the training process
Fig. 3
Fig. 3
MAGPIE makes accurate predictions. A The pie chart showed the proportion of pathogenic and benign variants in the independent test set, and the bar plot illustrated the percentages of multi-type variants in the dataset. B The receiver operating characteristic curve of MAGPIE and 14 other predicted tools in the independent test set. The area under the curve (AUC) scores were shown in the bar plot. C Precision-recall curve of MAGPIE and 14 other predicted tools in the ClinVarTest dataset were illustrated. D Missing rate comparison of MAGPIE and 14 other predicted tools in the independent test set. The higher missing rate represented that the prediction tools cannot predict pathogenic scores on the larger number of candidate variants. E AUC comparison of MAGPIE and 14 other predicted tools in the ClinVarRare, which only included variants with AF < 0.01. F AUBPRC comparison of MAGPIE and 14 other predicted tools in the ClinVarRare which only included variants with AF < 0.01. G Percentages of predictable variants across different variant types in various tools. H Violin plots illustrated distributions of pathogenic scores. And bar plots showed the precisions in each category of pathogenic variants and benign variants
Fig. 4
Fig. 4
MAGPIE outperforms other models in orthogonal validation set and ACMG-guided dataset. A The pie chart showed the proportion of pathogenic and benign variants in the orthogonal validation set and the bar plot illustrated the percentages of multi-type variants in the dataset. B The receiver operating characteristic curve of MAGPIE and 14 other predicted tools in the orthogonal validation set. C The precision-recall curve of MAGPIE and 14 other predicted tools in the orthogonal validation set were illustrated. D Missing rate comparison of MAGPIE and 14 other predicted tools in the orthogonal validation set. The higher missing rate represented that the prediction tools cannot predict pathogenic scores on the larger number of candidate variants. E AUC comparison of MAGPIE and 14 other predicted tools in the SwissProtRare which only included variants with AF < 0.01. F AUBPRC comparison of MAGPIE and 14 other predicted tools in the SwissProtRare which only included variants with AF < 0.01. G The pie chart showed the proportion of pathogenic and benign variants in the ACMG-guided dataset, and the bar plot illustrated the percentages of multi-type variants in the dataset. H Performance comparison of MAGPIE and 14 other predicted tools in the ACMG-guided dataset. I The precision-recall curve of MAGPIE and 14 other predicted tools in the ACMG-guided dataset were illustrated
Fig. 5
Fig. 5
MAGPIE detects most variants in pathogenic genes. A Comparison of the number of detected pathogenic variants in four well-known pathogenic genes between MAGPIE and 14 other prediction tools. B Density plots illustrated distributions of pathogenic scores predicted by MAGPIE, MutationTaster, and VEST4. Moreover, the pie charts showed the proportion of predictable and unpredictable variants of each tool

References

    1. Karczewski KJ, Francioli LC, Tiao G, Cummings BB, Alfoldi J, Wang Q, ... MacArthur DG. The mutational constraint spectrum quantified from variation in 141,456 humans. Nature. 2020;581(7809):434–443. - PMC - PubMed
    1. Lek M, Karczewski KJ, Minikel EV, Samocha KE, Banks E, Fennell T, ... Exome Aggregation Consortium. Analysis of protein-coding genetic variation in 60,706 humans. Nature. 2016;536(7616):285-291 - PMC - PubMed
    1. Cao Y, Li L, Xu M, Feng Z, Sun X, Lu J, ... Wang W. The ChinaMAP analytics of deep whole genome sequences in 10,588 individuals. Cell Res. 2020;30(9):717–731. - PMC - PubMed
    1. Landrum MJ, Lee JM, Benson M, Brown G, Chao C, Chitipiralla S, ... Maglott DR. ClinVar: public archive of interpretations of clinically relevant variants. Nucleic Acids Res. 2016;44(D1), D862-D868. - PMC - PubMed
    1. Amberger JS, Bocchini CA, Schiettecatte F, Scott AF, Hamosh A. OMIM. org: Online Mendelian Inheritance in Man (OMIM®), an online catalog of human genes and genetic disorders. Nucleic Acids Res. 2015;43(D1):D789–D798. doi: 10.1093/nar/gku1205. - DOI - PMC - PubMed

Publication types

LinkOut - more resources