

The effect of feature normalization methods in radiomics
- PMID: 38185786
- PMCID: PMC10772134
- DOI: 10.1186/s13244-023-01575-7
The effect of feature normalization methods in radiomics
Abstract
Objectives: In radiomics, different feature normalization methods, such as z-Score or Min-Max, are currently utilized, but their specific impact on the model is unclear. We aimed to measure their effect on the predictive performance and the feature selection.
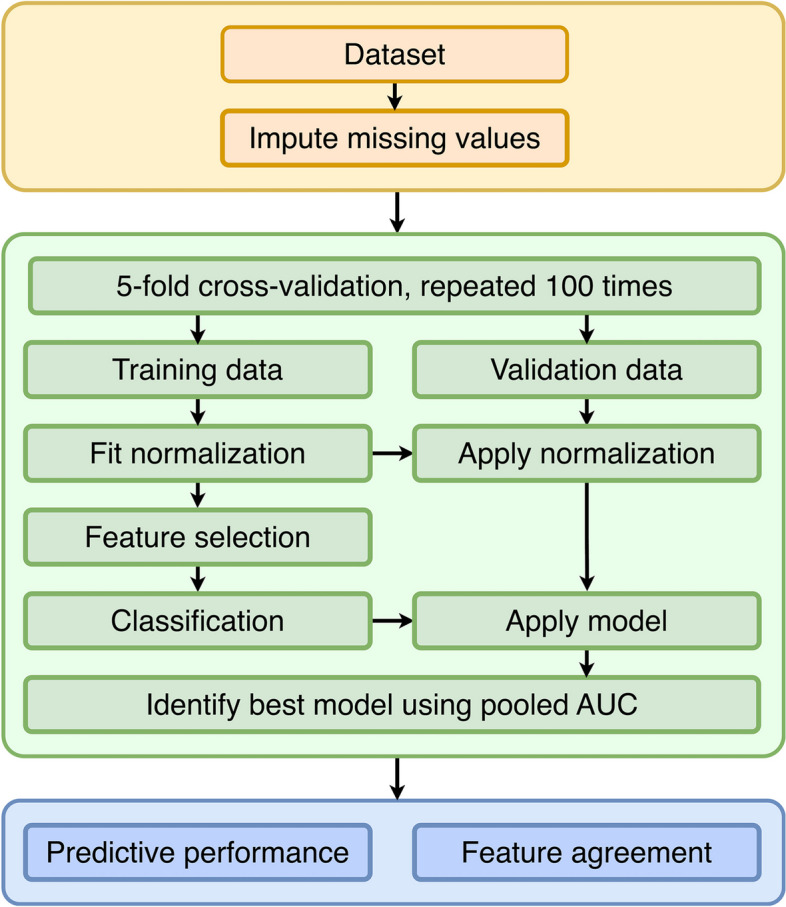
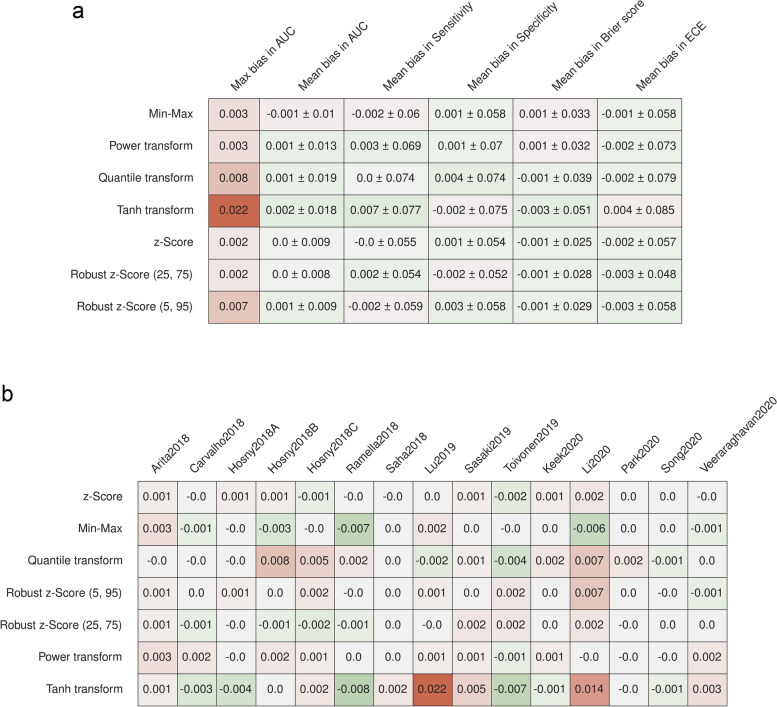
Methods: We employed fifteen publicly available radiomics datasets to compare seven normalization methods. Using four feature selection and classifier methods, we used cross-validation to measure the area under the curve (AUC) of the resulting models, the agreement of selected features, and the model calibration. In addition, we assessed whether normalization before cross-validation introduces bias.
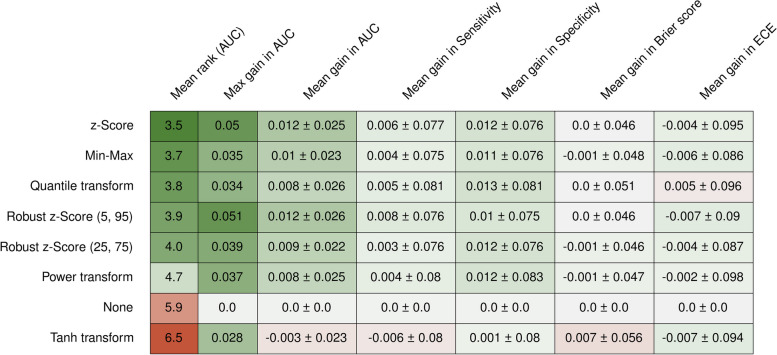
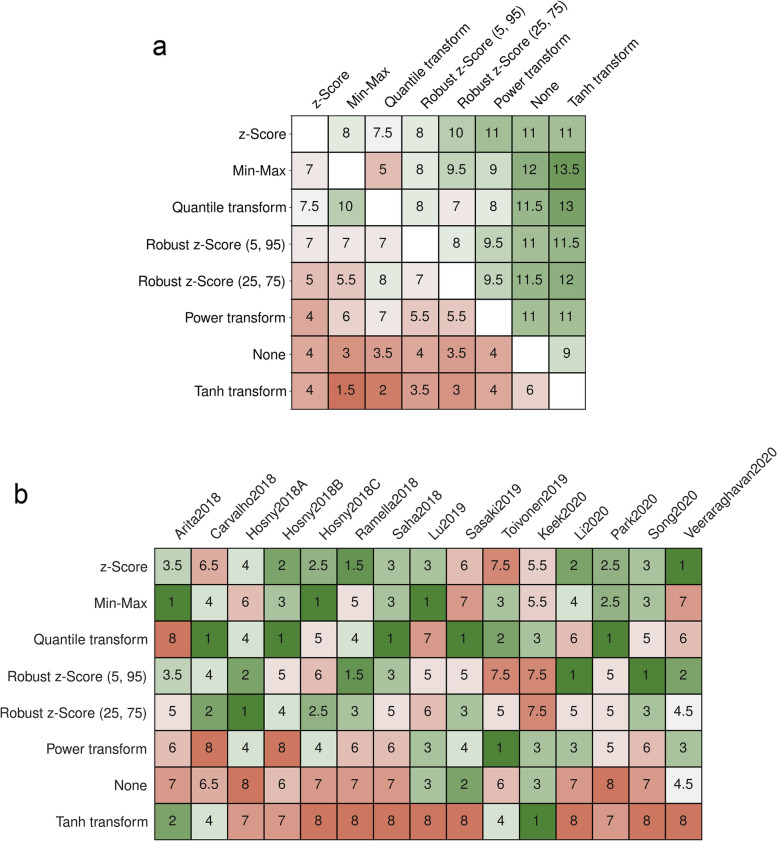
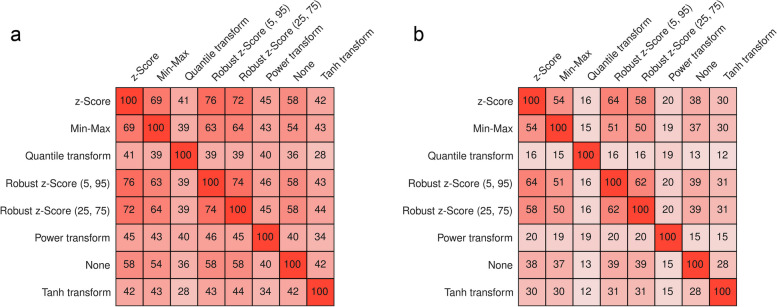
Results: On average, the difference between the normalization methods was relatively small, with a gain of at most + 0.012 in AUC when comparing the z-Score (mean AUC: 0.707 ± 0.102) to no normalization (mean AUC: 0.719 ± 0.107). However, on some datasets, the difference reached + 0.051. The z-Score performed best, while the tanh transformation showed the worst performance and even decreased the overall predictive performance. While quantile transformation performed, on average, slightly worse than the z-Score, it outperformed all other methods on one out of three datasets. The agreement between the features selected by different normalization methods was only mild, reaching at most 62%. Applying the normalization before cross-validation did not introduce significant bias.
Conclusion: The choice of the feature normalization method influenced the predictive performance but depended strongly on the dataset. It strongly impacted the set of selected features.
Critical relevance statement: Feature normalization plays a crucial role in the preprocessing and influences the predictive performance and the selected features, complicating feature interpretation.
Key points: • The impact of feature normalization methods on radiomic models was measured. • Normalization methods performed similarly on average, but differed more strongly on some datasets. • Different methods led to different sets of selected features, impeding feature interpretation. • Model calibration was not largely affected by the normalization method.
Keywords: Feature normalization; Feature scaling; Feature selection; High-dimensional datasets; Radiomics.
© 2023. The Author(s).
Conflict of interest statement
The authors declare that they have no competing interests.
Figures
Similar articles
-
The effect of data resampling methods in radiomics.Sci Rep. 2024 Feb 3;14(1):2858. doi: 10.1038/s41598-024-53491-5. Sci Rep. 2024. PMID: 38310165 Free PMC article.
-
Measuring the bias of incorrect application of feature selection when using cross-validation in radiomics.Insights Imaging. 2021 Nov 24;12(1):172. doi: 10.1186/s13244-021-01115-1. Insights Imaging. 2021. PMID: 34817740 Free PMC article.
-
Diagnostic Performance of 2D and 3D T2WI-Based Radiomics Features With Machine Learning Algorithms to Distinguish Solid Solitary Pulmonary Lesion.Front Oncol. 2021 Nov 18;11:683587. doi: 10.3389/fonc.2021.683587. eCollection 2021. Front Oncol. 2021. PMID: 34868905 Free PMC article.
-
Benchmarking Feature Selection Methods in Radiomics.Invest Radiol. 2022 Jul 1;57(7):433-443. doi: 10.1097/RLI.0000000000000855. Epub 2022 Jan 18. Invest Radiol. 2022. PMID: 35045555
-
Feature selection methods and predictive models in CT lung cancer radiomics.J Appl Clin Med Phys. 2023 Jan;24(1):e13869. doi: 10.1002/acm2.13869. Epub 2022 Dec 17. J Appl Clin Med Phys. 2023. PMID: 36527376 Free PMC article. Review.
Cited by
-
Incidence rate of occult lymph node metastasis in clinical T1-2N0M0 small cell lung cancer patients and radiomic prediction based on contrast-enhanced CT imaging: a multicenter study : Original research.Respir Res. 2024 May 29;25(1):226. doi: 10.1186/s12931-024-02852-9. Respir Res. 2024. PMID: 38811960 Free PMC article.
-
Non-invasive prediction of the secondary enucleation risk in uveal melanoma based on pretreatment CT and MRI prior to stereotactic radiotherapy.Strahlenther Onkol. 2025 Aug 8. doi: 10.1007/s00066-025-02449-1. Online ahead of print. Strahlenther Onkol. 2025. PMID: 40781366
-
Reproducibility and interpretability in radiomics: a critical assessment.Diagn Interv Radiol. 2025 Jul 8;31(4):321-328. doi: 10.4274/dir.2024.242719. Epub 2024 Oct 21. Diagn Interv Radiol. 2025. PMID: 39463040 Free PMC article. Review.
-
Applying oversampling before cross-validation will lead to high bias in radiomics.Sci Rep. 2024 May 21;14(1):11563. doi: 10.1038/s41598-024-62585-z. Sci Rep. 2024. PMID: 38773233 Free PMC article.
-
Automatic Detection of Acute Leukemia (ALL and AML) Utilizing Customized Deep Graph Convolutional Neural Networks.Bioengineering (Basel). 2024 Jun 24;11(7):644. doi: 10.3390/bioengineering11070644. Bioengineering (Basel). 2024. PMID: 39061726 Free PMC article.
References
-
- Harlow CA, Dwyer SJ, Lodwick G (1976) On radiographic image analysis. In: Digital Picture Analysis. Springer. 65–150
LinkOut - more resources
Full Text Sources
