

The role of senescence genes in the treatment, prognosis, and tumor microenvironment of gastric cancer
- PMID: 38187003
- PMCID: PMC10767519
The role of senescence genes in the treatment, prognosis, and tumor microenvironment of gastric cancer
Abstract
Aim: Gastric cancer (GC) has a high incidence and poor prognosis. Senescence genes are suggested to participate in immune cell infiltration, thus affecting the immunotherapy of GC. In this research, we established a senescence-related GC model to explore and verify the role of senescence genes in the prognosis, treatment, and tumor microenvironment (TME) of GC.
Methods: The TCGA GC (TCGA-STAD) dataset was used to screen key senescence genes from differentially expressed genes (DEGs). A prognostic risk model was trained utilizing the TCGA-STAD dataset and validated using an external GEO dataset. The CIBERSORT algorithm was run to explore the relationship between senescence genes and TME. The chemotherapy drug sensitivities in GC patients were calculated utilizing R package pRRophetic.
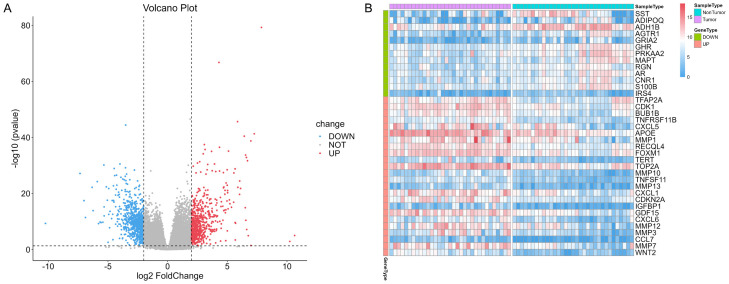
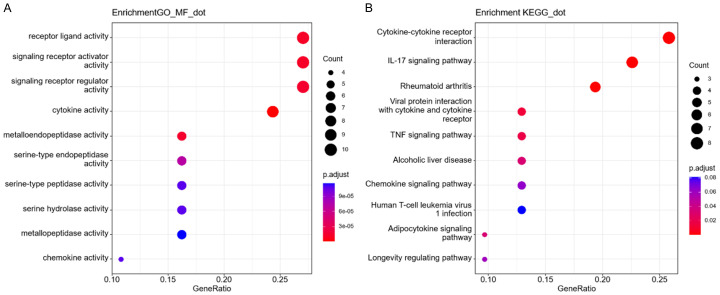
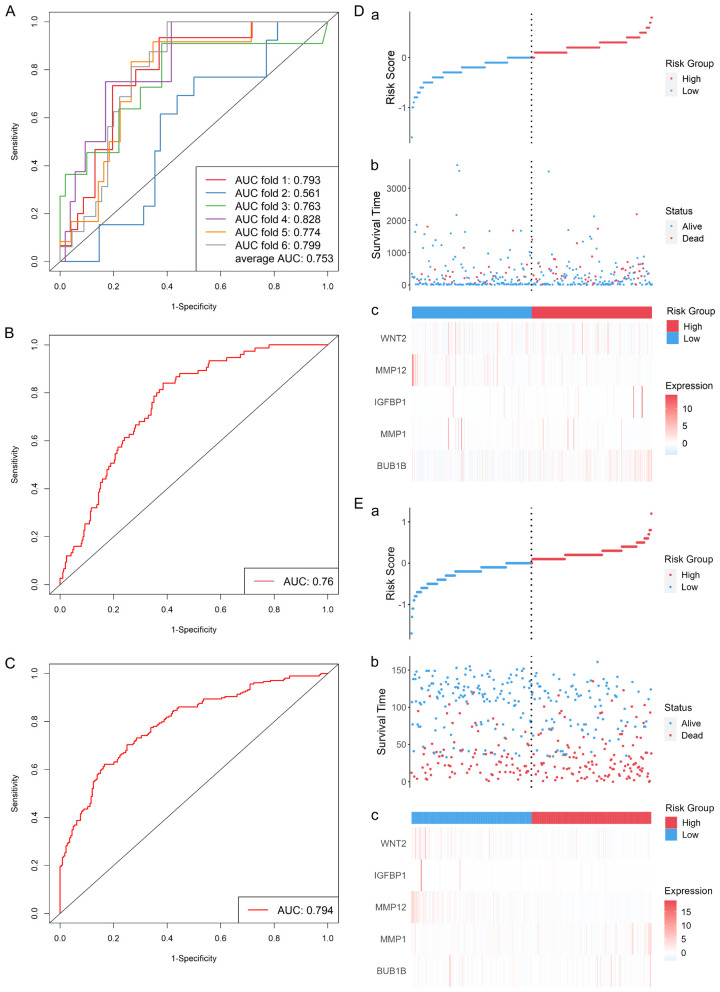
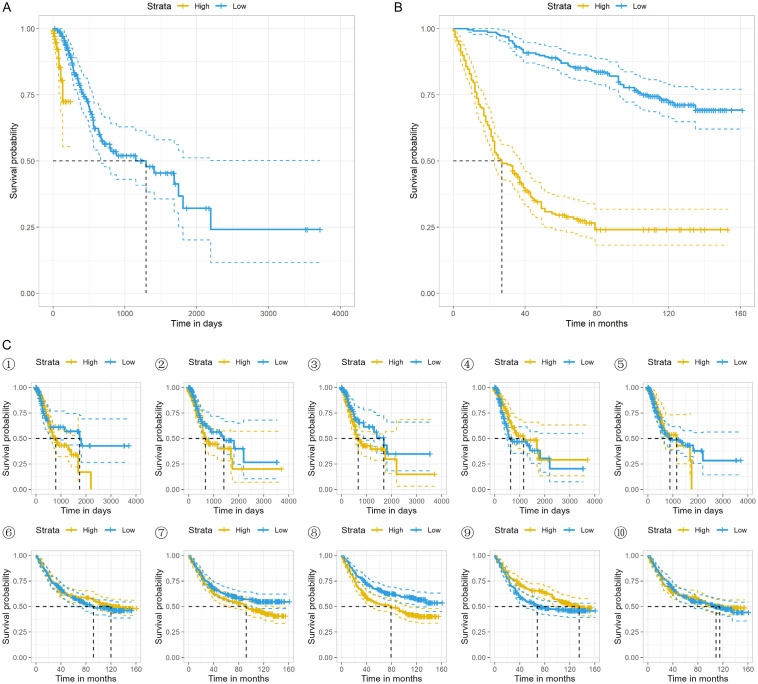
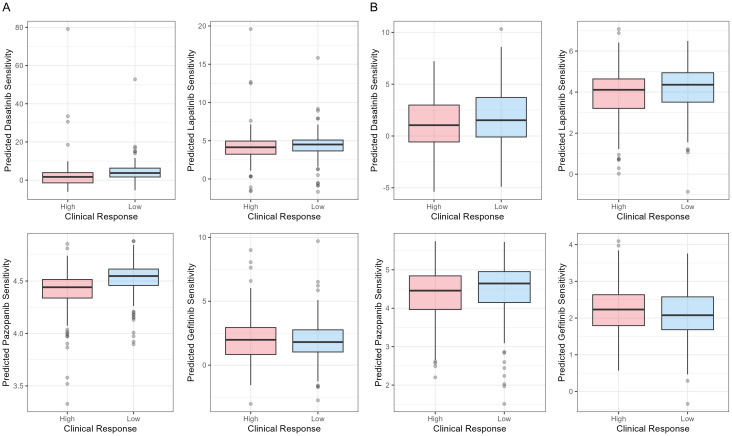
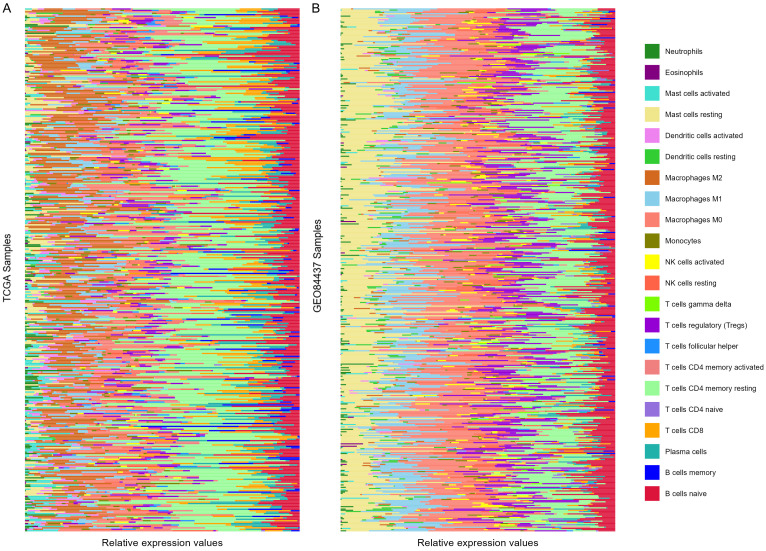
Results: A total of 37 senescence-related DEGs were obtained. Five key senescence-related genes were further screened to establish a senescence-related risk model based on Cox regression. The survival status of GC patients in the high-risk group was found to be worse than that in the low-risk group. According to the results of gene set enrichment analysis, the senescence-related risk was mainly associated with cytokine activity, immune mechanism, and related pathways. By analyzing the sensitivity of common chemotherapy drugs in GC patients, it was revealed that the sensitivities of high-risk patients to Dasatinib, Lapatinib, and Pazopanib were lower than those of low-risk patients. The CIBERSORT algorithm was executed to analyze the TME in the high-risk group, revealing elevated levels of CD8 T cells, Macrophages M2, and resting Mast cells. In addition, decreased levels of resting memory CD4 T cells , resting NK cells, activated Dendritic cells, and activated Mast cells were also observed.
Conclusion: Senescence genes were related to the prognosis, response to chemotherapy drugs, and TME of GC. Our senescence-related risk model could forecast the survival of patients, their response to chemotherapy drugs, and the TME to a certain extent.
Keywords: Senescence gene; gastric cancer; immunotherapy; prognostic model; survival analysis; tumor microenvironment.
AJTR Copyright © 2023.
Conflict of interest statement
None.
Figures
Similar articles
-
Identification of cuproptosis-related subtypes, construction of a prognosis model, and tumor microenvironment landscape in gastric cancer.Front Immunol. 2022 Nov 21;13:1056932. doi: 10.3389/fimmu.2022.1056932. eCollection 2022. Front Immunol. 2022. PMID: 36479114 Free PMC article.
-
Characterization of the Prognosis and Tumor Microenvironment of Cellular Senescence-related Genes through scRNA-seq and Bulk RNA-seq Analysis in GC.Recent Pat Anticancer Drug Discov. 2024;19(4):530-542. doi: 10.2174/0115748928255417230924191157. Recent Pat Anticancer Drug Discov. 2024. PMID: 37807645
-
Identification and validation of the prognostic value of cyclic GMP-AMP synthase-stimulator of interferon (cGAS-STING) related genes in gastric cancer.Bioengineered. 2021 Dec;12(1):1238-1250. doi: 10.1080/21655979.2021.1911557. Bioengineered. 2021. PMID: 33843442 Free PMC article.
-
Identify potential prognostic indicators and tumor-infiltrating immune cells in pancreatic adenocarcinoma.Biosci Rep. 2022 Feb 25;42(2):BSR20212523. doi: 10.1042/BSR20212523. Biosci Rep. 2022. PMID: 35083488 Free PMC article. Review.
-
Role of Interleukins and New Perspectives in Mechanisms of Resistance to Chemotherapy in Gastric Cancer.Biomedicines. 2022 Jul 5;10(7):1600. doi: 10.3390/biomedicines10071600. Biomedicines. 2022. PMID: 35884907 Free PMC article. Review.
Cited by
-
Long non-coding RNA VCAN-AS1 promotes gastric cancer progression via the HuR/F11R pathway.Am J Transl Res. 2024 Nov 15;16(11):6489-6499. doi: 10.62347/KPXD5964. eCollection 2024. Am J Transl Res. 2024. PMID: 39678543 Free PMC article.
-
RNF26-mediated ubiquitination of TRIM21 promotes bladder cancer progression.Am J Cancer Res. 2024 Aug 25;14(8):4082-4095. doi: 10.62347/TECQ5002. eCollection 2024. Am J Cancer Res. 2024. PMID: 39267687 Free PMC article.
References
-
- Smyth EC, Nilsson M, Grabsch HI, van Grieken NC, Lordick F. Gastric cancer. Lancet. 2020;396:635–648. - PubMed
-
- Thrift AP, Nguyen TH. Gastric cancer epidemiology. Gastrointest Endosc Clin N Am. 2021;31:425–439. - PubMed
-
- Petryszyn P, Chapelle N, Matysiak-Budnik T. Gastric cancer: where are we heading? Dig Dis. 2020;38:280–285. - PubMed
-
- Lopez MJ, Carbajal J, Alfaro AL, Saravia LG, Zanabria D, Araujo JM, Quispe L, Zevallos A, Buleje JL, Cho CE, Sarmiento M, Pinto JA, Fajardo W. Characteristics of gastric cancer around the world. Crit Rev Oncol Hematol. 2023;181:103841. - PubMed
LinkOut - more resources
Full Text Sources
Research Materials
Miscellaneous