. 2023 Dec 15;13(12):5846-5867.
eCollection 2023.

GAPDH: unveiling its impact as a key hypoxia-related player in head and neck squamous cell carcinoma tumor progression, prognosis, and therapeutic potential

Affiliations

GAPDH: unveiling its impact as a key hypoxia-related player in head and neck squamous cell carcinoma tumor progression, prognosis, and therapeutic potential

Cong Peng et al. Am J Cancer Res. .

Abstract

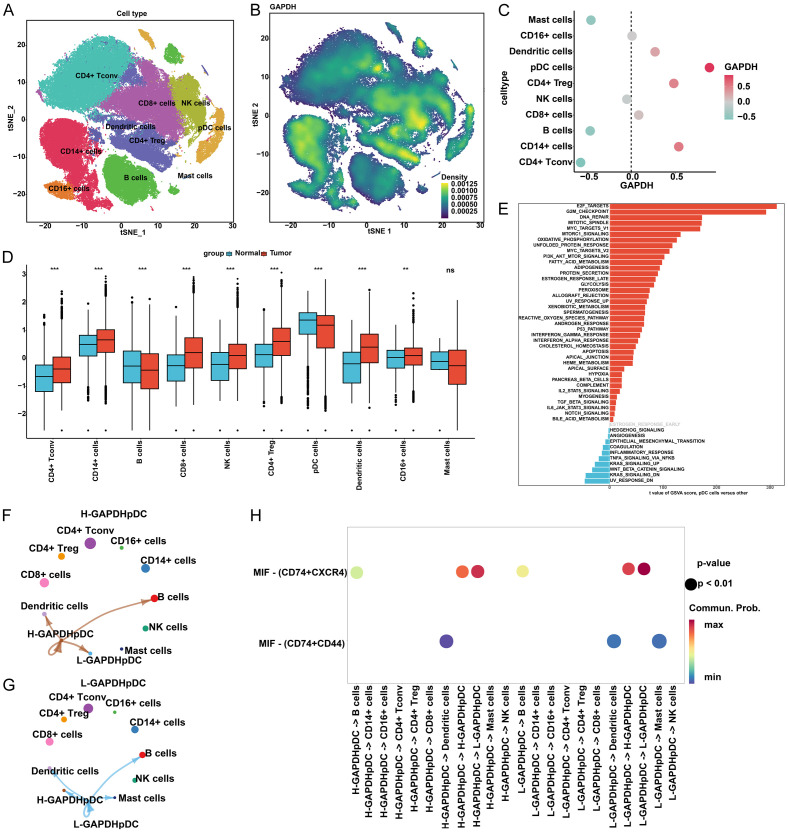
Head and neck squamous cell carcinoma (HNSCC), characterized by hypoxia patterns, ranks as the sixth most prevalent malignant tumor worldwide. Glyceraldehyde-3-phosphate dehydrogenase (GAPDH) plays a role in oncogenesis under hypoxic conditions in various cancers. However, its precise function in HNSCC, especially under varied hypoxic conditions, including at high altitudes, remains unclear. Elevated GAPDH mRNA and protein levels in HNSCC relative to normal tissues have been demonstrated through data from The Cancer Genome Atlas (TCGA), GSE29330, and the Human Protein Atlas (P<0.05). This elevation was further confirmed through in vitro experiments utilizing two HNSCC cell lines and a normal oral mucosal epithelial cell line. Additionally, data from TCGA and GSE41613 reveal a correlation between elevated GAPDH expression and diminished overall and progression-free survival in patients (P<0.05). Subsequent analysis identifies GAPDH as an independent risk factor for HNSCC (P<0.05). Using the ESTIMATE and single-sample gene set enrichment analysis (ssGSEA) algorithms, high GAPDH expression was found to be associated with reduced immune scores and diminished anti-tumor cell infiltration, such as CD8+ T cells, in TCGA and GSE41613 datasets (P<0.05). Analysis of single-cell RNA sequencing data from GSE139324 suggests that elevated GAPDH expression hinders communication between plasmacytoid dendritic cells and mast cells (P<0.05). Furthermore, in the TCGA and GSE41613 datasets, GAPDH's biological function is closely tied to hypoxia through Gene Ontology (GO), Kyoto Encyclopedia of Genes and Genomes (KEGG), and Gene Set Variation Analysis (GSVA) analyses. Moreover, its expression is linked to one cuproptosis-related gene, five N6-methyladenosine-related genes, six immune checkpoint genes, and pivotal pathways such as MYC and E2F (P<0.05). GAPDH showed excellent predictive value in estimating the efficacy of immunotherapy and 11 anti-tumor drugs (e.g., cisplatin) (P<0.05), using TIDE and pRRophetic algorithms on the TCGA and GSE41613 datasets. Under 1% O2 in vitro, HNSCC cells show elevated GAPDH expression, leading to decreased apoptosis and increased migration, clonogenicity, invasiveness, and resistance to cisplatin (P<0.05). At 5% O2, these effects persisted, albeit less pronouncedly. Inhibiting GAPDH reversed these effects under all oxygen concentrations (P<0.05). Overall, our findings reveal GAPDH as a key hypoxia-related player influencing tumor progression, prognosis, and therapeutic potential in HNSCC.

Keywords: GAPDH; Hypoxia; cisplatin; head and neck squamous cell carcinoma; immunotherapy.


Conflict of interest statement

None.

Figures

Figure 1
Figure 1
Flow chart of this study. Note: TCGA, The Cancer Genome Atlas; OS, overall survival; PFS, progression-free survival; DEG, Differentially Expressed Genes; GO, Gene Ontology; KEGG, Kyoto Encyclopedia of Genes and Genomes; GSVA, Gene Set Variation Analysis; m6A, N6-Methyladenosine; ssGSEA, Single-sample Gene Set Enrichment Analysis; TME, Tumor Microenvironment; TIDE, Tumor Immune Dysfunction and Exclusion; TCIA, The Cancer Immunome Atlas.
Figure 2
Figure 2
Comparative analysis of GAPDH mRNA and protein expression in HNSCC tissues and normal head and neck tissue samples. (A, B) GAPDH mRNA expression in HNSCC versus normal tissues in TCGA: Wilcoxon rank sum test (A) and paired differentiation analysis (B). (C) Wilcoxon rank sum test analysis of GAPDH expression in HNSCC versus normal tissues in GSE29330. (D) Immunohistochemical staining data in the HPA database shows the expression levels of GAPDH protein in the HNSCC and normal head and neck tissue samples. (E) Quantitative PCR and western blot analyses results show the GAPDH mRNA and protein expression levels in the Tu212 and FaDu HNSCC cell lines and the normal oral mucosal NHOK cells. (F, G) GAPDH expression levels in HNSCC patients were stratified by age (≤60 years vs. >60 years) and gender (males vs. females). (H, I) GAPDH expression levels in HNSCC patients are stratified according to WHO grades (WHO grades G2-4 vs. WHO grade G1) and TNM stages (TNM stages II-IV vs. TNM stage I). Note: HPA, Human Protein Atlas; WHO, World Health Organization; TNM, tumor node metastasis. ns, P>0.05, *P<0.05, **P<0.01, and ***P<0.001.
Figure 3
Figure 3
Prognostic analysis of HNSCC patients based on the GAPDH expression levels. A. OS of HNSCC patients in the TCGA dataset with high and low GAPDH expression levels. B. PFS of HNSCC patients in the TCGA dataset with high and low GAPDH expression levels. C. OS of HNSCC patients in the GSE41613 dataset with high and low GAPDH expression levels. D. Univariate and multivariate Cox regression analysis to evaluate independent prognostic value of GAPDH in TCGA dataset. Note: TCGA, The Cancer Genome Atlas; OS, overall survival; PFS, progression-free survival.
Figure 4
Figure 4
Prognostic analysis of HNSCC patients based on GAPDH expression levels and stratification of clinical features. (A-I) OS of HNSCC patients stratified according to GAPDH expression levels and clinical features, including (A) Age: >60 years; (B) Gender: female; (C) WHO grades: G1-2; (D) TNM stages: II-IV; (E) Margin status: close; (F) Lymph node neck dissection; (G) No radiation therapy; (H) Radiation therapy; and (I) Smoking: yes.
Figure 5
Figure 5
Differential Gene Expression, spearman correlation analysis, functional enrichment analysis, and GSVA of GAPDH and related genes in HNSCC. (A) Heatmaps displaying gene expression patterns between high- and low-GAPDH expressing HNSCC samples in both TCGA (left) and GSE41613 (right) databases. (B) Spearman correlation analysis shows genes that are significantly associated with GAPDH in TCGA (left) and GSE41613 (right) based on the gene count matrix. (C, D) GO enrichment (C) and KEGG pathway (D) analyses for genes with a correlation coefficient >0.6 with GAPDH in both TCGA (left) and GSE41613 (right) databases. (E) Analysis of the activation status of biological behaviors in high- and low-GAPDH expressing groups across TCGA (left) and GSE41613 (right) databases. Note: GSVA, gene set variation analysis; GO, Gene Ontology; KEGG, Kyoto Encyclopedia of Genes and Genomes.
Figure 6
Figure 6
Correlation analysis between GAPDH expression levels in the HNSCC tissues and the status of the tumor immune microenvironment and the expression levels of cuproptosis-, m6A-related, and the immune checkpoint genes. (A) ESTIMATE algorithm shows the immune scores and estimate scores of HNSCC patients with high- and low-GAPDH expression in TCGA (left) and GSE41613 (right) datasets. (B-D) Comparative analysis of the expression levels of several cuproptosis-related genes (B), m6A-related genes (C), and immune checkpoint genes (D) between HNSCC tumors with high and low GAPDH expression in TCGA (left or top) and GSE41613 (right or bottom). Note: ns, P>0.05, ***P<0.001, **P<0.01, *P<0.05.
Figure 7
Figure 7
Associations of GAPDH expression with pathway activation and immune functions in HNSCC. (A, B) Comparative analysis of pathway activation (A) and immune-related functions (B) in HNSCC with high- and low-GAPDH expression in TCGA (left or top) and GSE41613 (right or bottom). (C) Spearman correlation analysis displays varying immune cell infiltration abundance significantly associated with GAPDH in TCGA (right) and GSE41613 (left). Note: ns, P>0.05, ***P<0.001, **P<0.01, *P<0.05.
Figure 8
Figure 8
Characterization of immune cell subtypes in HNSCC based on GAPDH expression using single-cell RNA sequencing analysis. (A) ScRNA-seq data analysis results show annotation of ten subtypes of immune cells in GSE139324 based on the expression of their marker genes. (B) t-SNE plot illustrating the distribution of the ten immune cell subtypes based on GAPDH expression. (C) Dot plot depicting the expression levels of GAPDH in the ten immune cell subtypes. (D) Comparison of the GAPDH expression levels in the ten immune cell subtypes between the HNSCC and normal tissues. (E) GSVA of plasmacytoid dendritic cells (pDC) shows the activation of hypoxia-related pathways in HNSCC. (F, G) Ligand-receptor interactions between high- (F) or low-GAPDH expression pDCs (G) and other cell subpopulations. (H) Comparison of the significant ligand-receptor pairs between high- and low-GAPDH expression pDC cell subtypes and other cell subpopulations. Note: GSVA, Gene set variation analysis; pDC, plasmacytoid dendritic cells. ns, P>0.05, ***P<0.001, **P<0.01.
Figure 9
Figure 9
Prediction performance of GAPDH in determining the efficacy of immunotherapy and anti-tumor drugs in patients with HNSCC. (A) Immunotherapy efficacy outcomes, including dysfunction, exclusion, MSI, and TIDE scores, between high vs. low GAPDH expression groups in TCGA (left) and GSE41613 (right). (B) Immunotherapy efficacy scores according to four different scoring methods in the TCIA algorithm for HNSCC patients with high and low GAPDH expression levels. (C) The intersections of different sensitive drugs between TCGA and GSE41613. (D) Differences in responses to cisplatin between HNSCC patients in the low vs. high GAPDH expression groups from both TCGA (above) and GSE41613 datasets (below). (E, F) Differences in responses to ten drugs between HNSCC patients in the low vs. high GAPDH expression groups from both the TCGA (E) and GSE41613 (F) datasets. Note: TCIA, The Cancer Immunome Atlas; MSI, microsatellites; TIDE, Tumor Immune Dysfunction and Exclusion.
Figure 10
Figure 10
Assessing GAPDH expression and apoptosis rates in HNSCC cell lines under varying oxygen conditions in vitro. (A, B) Evaluation of GAPDH mRNA and protein expression levels (A) and apoptosis rate (B) in FaDu and TU212 HNSCC cell lines, exploring distinct oxygen conditions and intervention groups: 1% O2, 5% O2, and 21% O2, as well as si-GAPDH transfection followed by exposure to these oxygen levels. Note: **P<0.01.
Figure 11
Figure 11
Exploring migration, clonogenicity, invasiveness, and viability against cisplatin in HNSCC cell lines under varying oxygen conditions in vitro. (A-D) Evaluation of migration (A), clonogenicity (B), invasiveness (C), and viability post-24-hour exposure to various cisplatin concentrations (D) in FaDu and TU212 HNSCC cell lines, exploring distinct oxygen conditions and intervention groups: 1% O2, 5% O2, and 21% O2, as well as si-GAPDH transfection followed by exposure to these oxygen levels. Note: **P<0.01.

Similar articles

Cited by

References

    1. Sung H, Ferlay J, Siegel RL, Laversanne M, Soerjomataram I, Jemal A, Bray F. Global cancer statistics 2020: GLOBOCAN estimates of incidence and mortality worldwide for 36 cancers in 185 countries. CA Cancer J Clin. 2021;71:209–249. - PubMed
    1. Kim K, Amonkar MM, Hogberg D, Kasteng F. Economic burden of resected squamous cell carcinoma of the head and neck in an incident cohort of patients in the UK. Head Neck Oncol. 2011;3:47. - PMC - PubMed
    1. Schernberg A, Sagaon-Teyssier L, Schwarzinger M EPICORL Study Group. Clinical and economic burden of head and neck cancer: a nationwide retrospective cohort study from France. Clinicoecon Outcomes Res. 2019;11:441–451. - PMC - PubMed
    1. Kase S, Baburin A, Kuddu M, Innos K. Incidence and survival for head and neck cancers in Estonia, 1996-2016: a population-based study. Clin Epidemiol. 2021;13:149–159. - PMC - PubMed
    1. Marur S, Forastiere AA. Head and neck squamous cell carcinoma: update on epidemiology, diagnosis, and treatment. Mayo Clin Proc. 2016;91:386–396. - PubMed

LinkOut - more resources