

Construction of a diagnostic model for osteoarthritis based on transcriptomic immune-related genes
- PMID: 38187306
- PMCID: PMC10770511
- DOI: 10.1016/j.heliyon.2023.e23636
Construction of a diagnostic model for osteoarthritis based on transcriptomic immune-related genes
Abstract
Background: Osteoarthritis (OA) is a leading cause of disability globally, affecting over 500 million individuals worldwide. However, accurate and early diagnosis of OA is challenging to achieve. Immune-related genes play an essential role in OA development. Therefore, the objective of this study was to develop a diagnostic model for OA based on immune-related genes identified in synovial membrane.
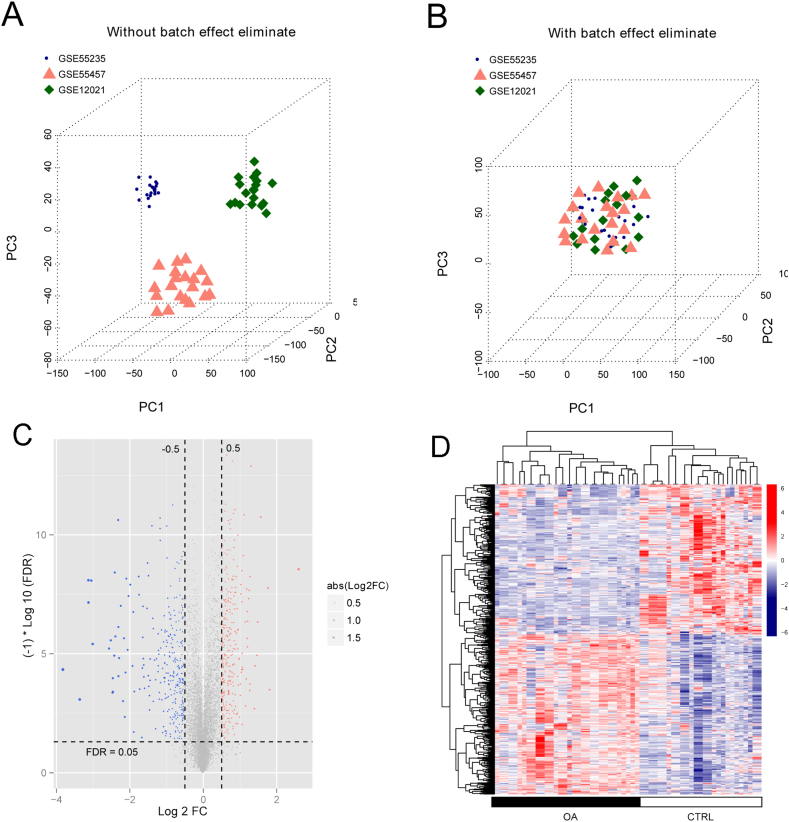
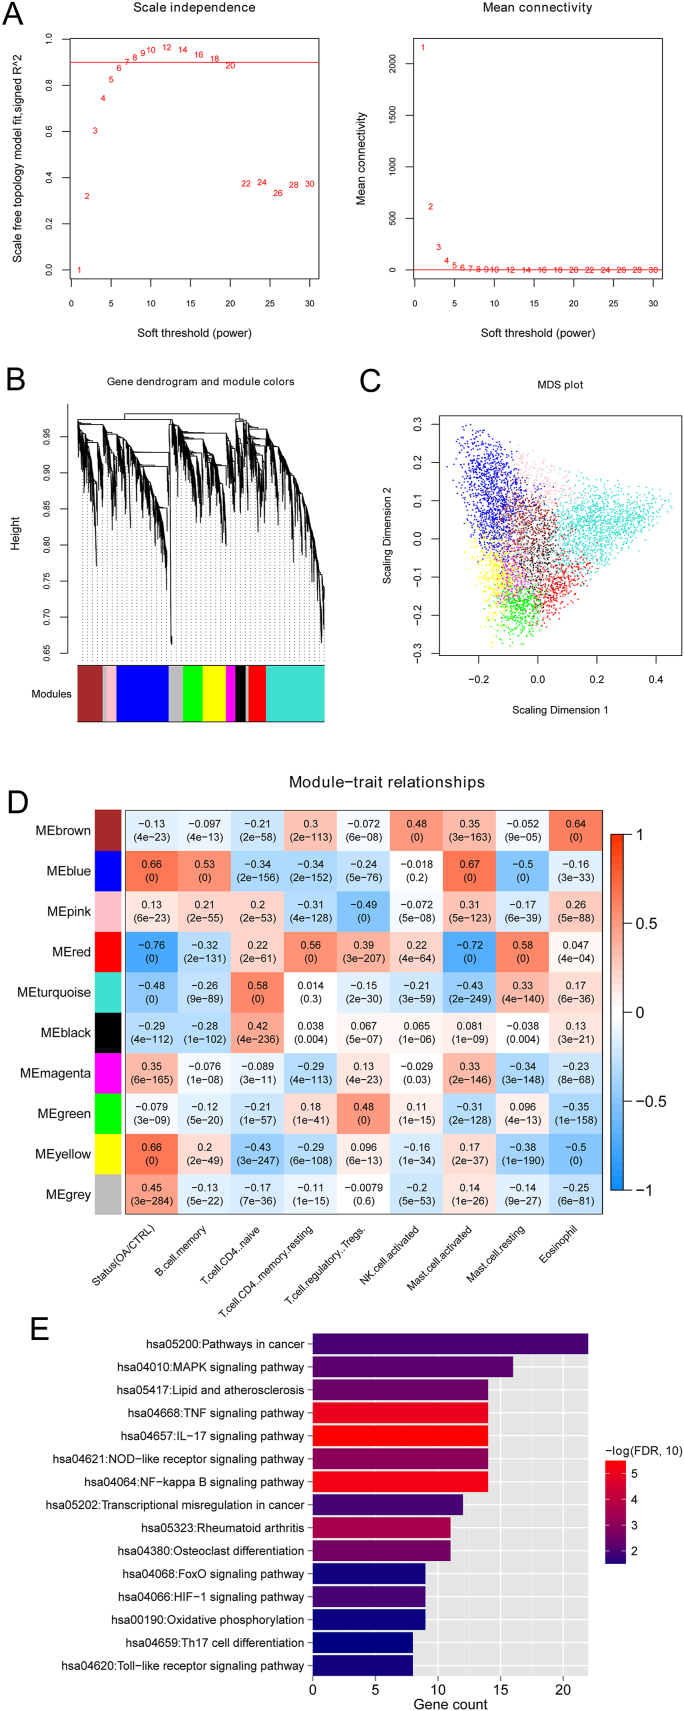
Methods: The gene expression profile of OA were downloaded based on four datasets. The significantly differentially expressed genes (DEGs) between OA and control groups were selected. The differential immune cells were analyzed, followed by immune-related DEGs screening. WGCNA was used to screen module genes and these genes were further selected through optimization algorithm. Then, nomogram model was constructed. Chemical drug small molecule related to OA was predicted. Finally, expression levels of several key genes were validated by qRT-PCR through construction of OA rat models.
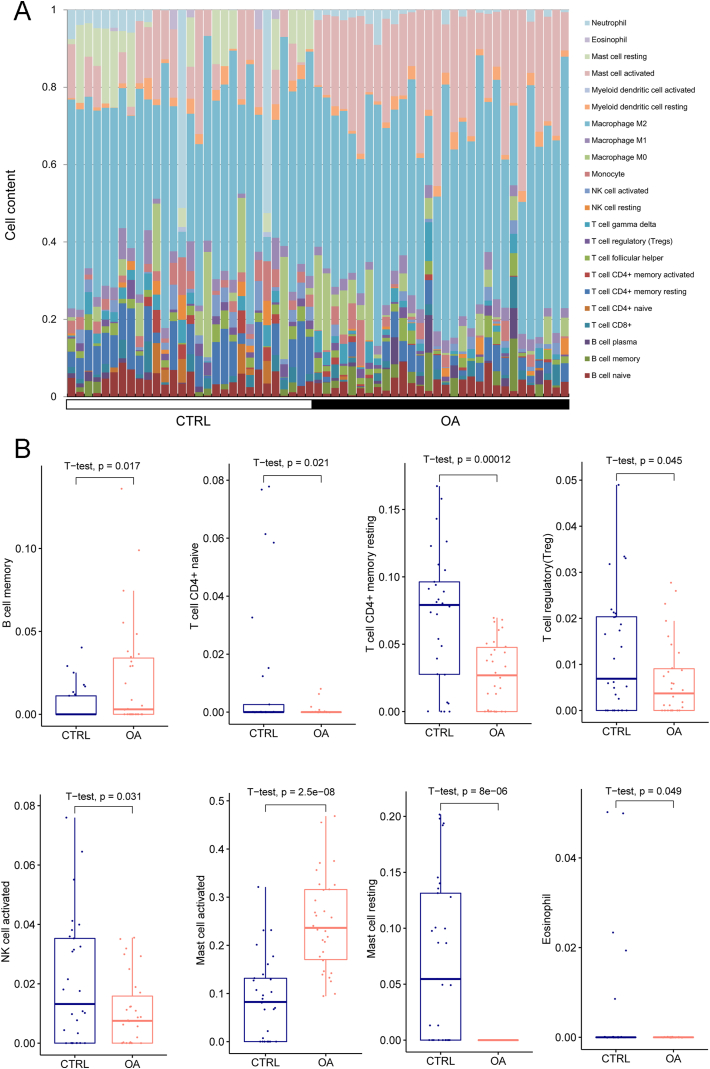
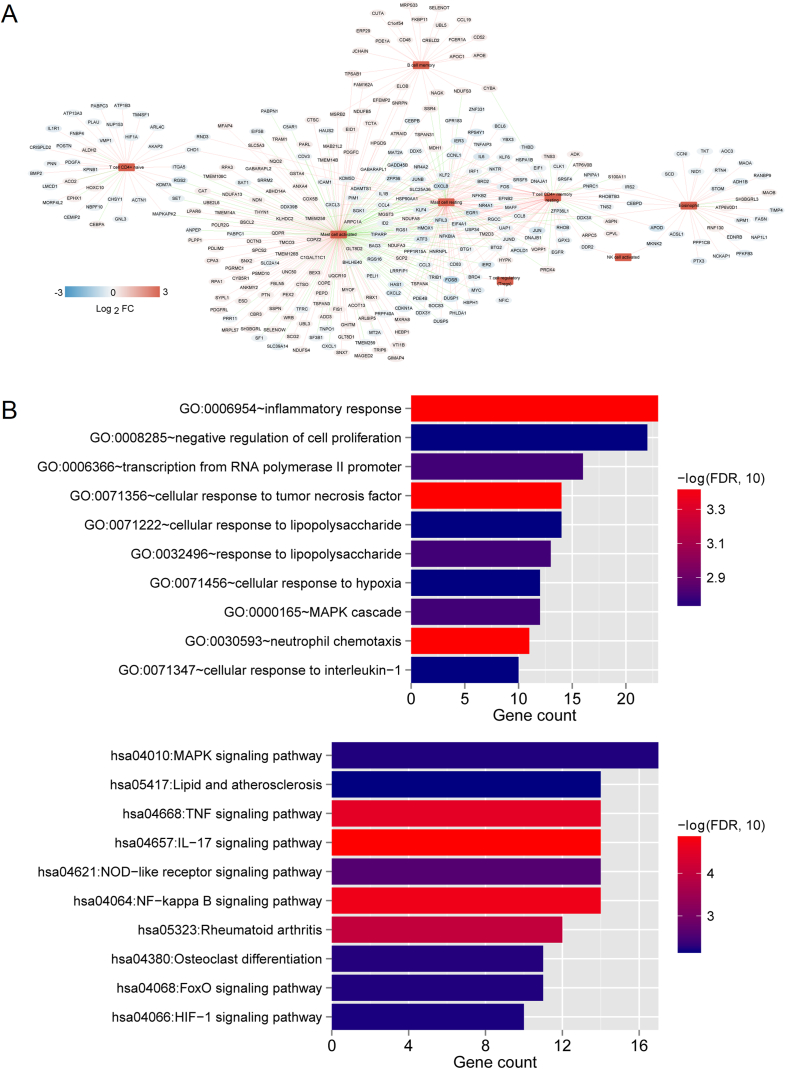
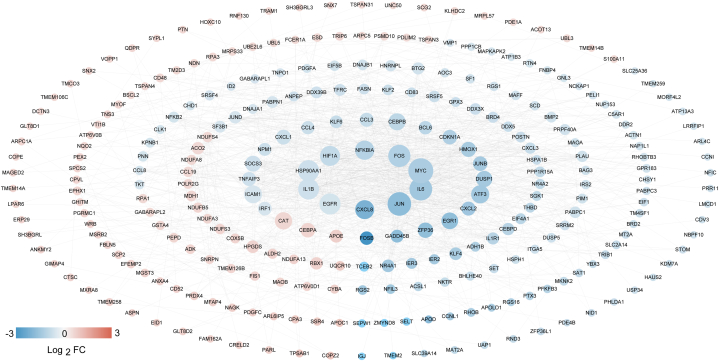
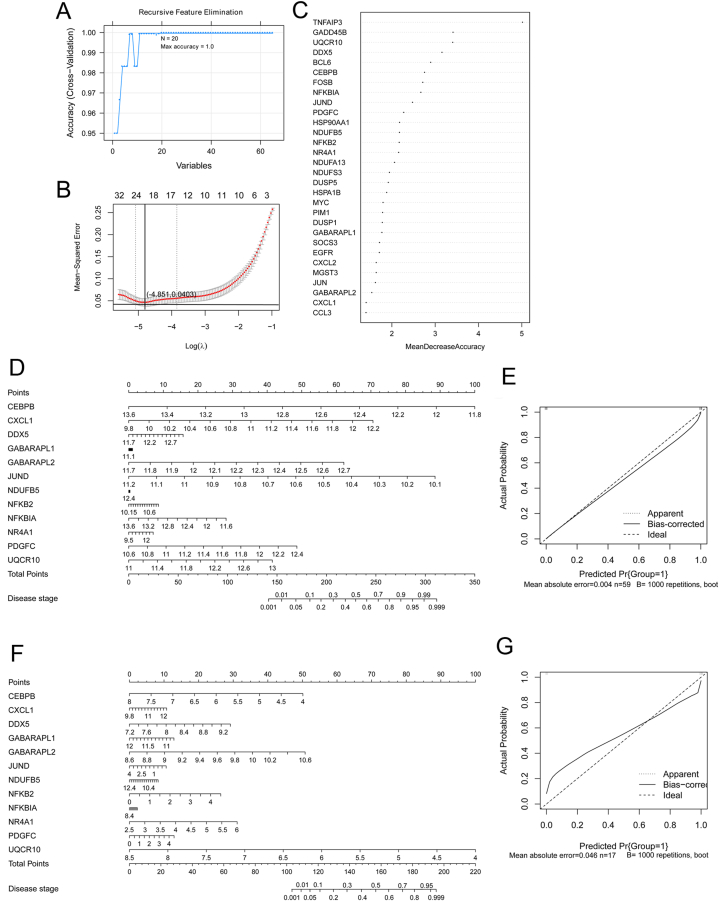
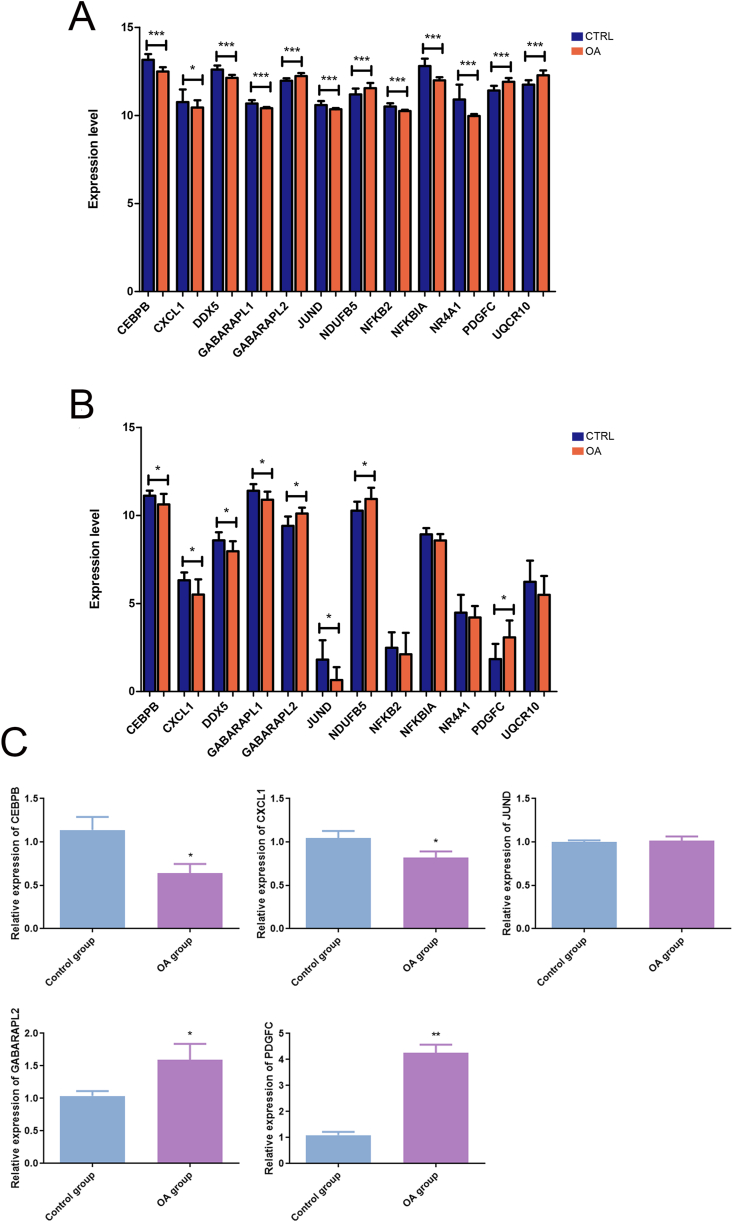
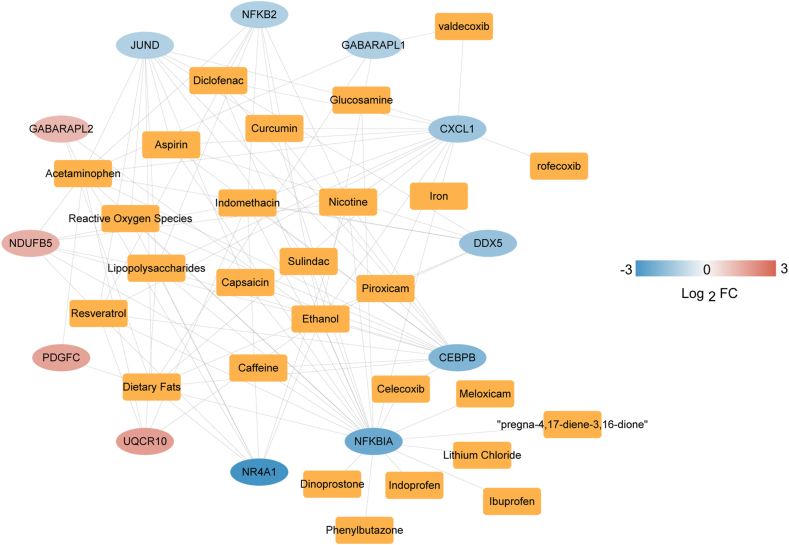
Results: The total 656 DEGs were obtained. Eight immune cells were significantly differential between two groups, and 317 immune-related DEGs were obtained. WGCNA identified three modules. The genes in modules were significantly involved in 15 pathways, involving in 65 genes. Then 12 DEGs were screened as the final optimal combination of DEGs, such as CEBPB, CXCL1, JUND, GABARAPL2 and PDGFC. The Nomogram model was also constructed. Furthermore, the chemical small molecules, such as acetaminophen, aspirin, and caffeine were predicted. The expression levels of CEBPB, CXCL1, GABARAPL2 and PDGFC were validated in OA rat models.
Conclusion: A diagnostic model based on twelve immune related genes was constructed. These model genes, such as CEBPB, CXCL1, GABARAPL2, and PDGFC, may serve as diagnostic biomarkers and immunotherapeutic targets.
Keywords: Biomarker; Gene; Model; Osteoarthritis; immune.
© 2023 The Authors.
Conflict of interest statement
The authors declare that they have no known competing financial interests or personal relationships that could have appeared to influence the work reported in this paper.
Figures
Similar articles
-
Identification and development of a novel 5-gene diagnostic model based on immune infiltration analysis of osteoarthritis.J Transl Med. 2021 Dec 23;19(1):522. doi: 10.1186/s12967-021-03183-9. J Transl Med. 2021. PMID: 34949204 Free PMC article.
-
Integrated Analysis of miRNAs and Gene Expression Profiles Reveals Potential Biomarkers for Osteoarthritis.Front Genet. 2022 Jun 17;13:814645. doi: 10.3389/fgene.2022.814645. eCollection 2022. Front Genet. 2022. PMID: 35783271 Free PMC article.
-
Identification of Key Diagnostic Markers and Immune Infiltration in Osteoarthritis.Comb Chem High Throughput Screen. 2023;26(2):410-423. doi: 10.2174/1386207325666220426083526. Comb Chem High Throughput Screen. 2023. PMID: 35473522 Free PMC article.
-
ATF3 as a potential diagnostic marker of early-stage osteoarthritis and its correlation with immune infiltration through bioinformatics analysis.Bone Joint Res. 2022 Sep;11(9):679-689. doi: 10.1302/2046-3758.119.BJR-2022-0075.R1. Bone Joint Res. 2022. PMID: 36082523 Free PMC article.
-
Screening of diagnostic biomarkers for ferroptosis-related osteoarthritis and construction of a risk-prognosis model.Ann Med Surg (Lond). 2024 Jan 4;86(2):856-866. doi: 10.1097/MS9.0000000000001696. eCollection 2024 Feb. Ann Med Surg (Lond). 2024. PMID: 38333254 Free PMC article.
References
-
- Murphy C.A., Garg A.K., Silva-Correia J., Reis R.L., Oliveira J.M., Collins M.N. The meniscus in normal and osteoarthritic tissues: facing the structure property challenges and current treatment trends. Annu. Rev. Biomed. Eng. 2019;21:495–521. - PubMed
-
- Martel-Pelletier J., Barr A.J., Cicuttini F.M., Conaghan P.G., Cooper C., Goldring M.B., et al. Osteoarthritis. Nat Rev Dis Primers. 2016;2 - PubMed
-
- Cross M., Smith E., Hoy D., Nolte S., Ackerman I., Fransen M., et al. The global burden of hip and knee osteoarthritis: estimates from the global burden of disease 2010 study. Annals of the rheumatic diseases. 2014;73:1323–1330. - PubMed
LinkOut - more resources
Full Text Sources
