. 2023 Dec 22:14:1253674.
doi: 10.3389/fimmu.2023.1253674. eCollection 2023.

B-cell-specific MhcII regulates microbiota composition in a primarily IgA-independent manner

Affiliations

B-cell-specific MhcII regulates microbiota composition in a primarily IgA-independent manner

Mary Melissa Roland et al. Front Immunol. .

Abstract

Background: The expression of major histocompatibility complex class II (MhcII) molecules on B cells is required for the development of germinal centers (GCs) in lymphoid follicles; the primary sites for the generation of T-cell-dependent (TD) antibody responses. Peyer's patches (PPs) are secondary lymphoid tissues (SLOs) in the small intestine (SI) that give rise to high-affinity, TD antibodies (mainly immunoglobulin A (IgA)) generated against the microbiota. While several studies have demonstrated that MhcII antigen presentation by other immune cells coordinate TD IgA responses and regulate microbiota composition, whether or not B-cell-specific MhcII influences gut microbial ecology is unknown.

Methods: Here, we developed a novel Rag1 -/- adoptive co-transfer model to answer this question. In this model, Rag1 -/- mice were reconstituted with naïve CD4+ T cells and either MhcII-sufficient or MhcII-deficient naïve B cells. Subsequent to this, resulting shifts in microbiota composition was characterized via 16S rRNA gene sequencing of SI-resident and fecal bacterial communities.

Results: Results from our experiments indicate that SLO development and reconstitution of an anti-commensal TD IgA response can be induced in Rag1 -/- mice receiving T cells and MhcII-sufficient B cells, but not in mice receiving T cells and MhcII-deficient B cells. Results from our 16S experiments confirmed that adaptive immunity is a relevant host factor shaping microbial ecology in the gut, and that its impact was most pronounced on SI-resident bacterial communities.

Conclusion: Our data also clearly establishes that MhcII-mediated cognate interactions between B cells and T cells regulates this effect by maintaining species richness in the gut, which is a phenotype commonly associated with good health. Finally, contrary to expectations, our experimental results indicate that IgA was not responsible for driving any of the effects on the microbiota ascribed to the loss of B cell-specific MhcII. Collectively, results from our experiments support that MhcII-mediated antigen presentation by B cells regulates microbiota composition and promotes species richness through an IgA-independent mechanism.

Keywords: IgA; MhcII; adaptive immunity; microbial ecology; microbiota.


Conflict of interest statement

The authors declare that the research was conducted in the absence of any commercial or financial relationships that could be construed as a potential conflict of interest.

Figures

Figure 1
Figure 1
Overview of Rag -/- adoptive T:B transfer model used to study influence of B-cell-specific MhcII antigen presentation on microbiota composition. (A) Experimental treatment groups are shown. (B) General overview of experimental design is shown. (C) Representative flow plots demonstrating enrichment for naïve splenic CD4+ T cells are shown. (D) Representative flow plots demonstrating enrichment for splenic B cells and comparison of enriched B cell subsets between WT and MhcII B cell donor mice are shown. (A, B) Created with Biorender.com.
Figure 2
Figure 2
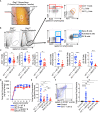
Reconstitution of GALT and anti-commensal IgA responses in Rag1 -/- adoptive T:B transfer recipients. (A) Representative image of induced SLOs in Rag1 -/- transfer recipients. (B) Representative gating strategy for enumeration of T cell and B cell subsets in GALT of Rag1 -/- transfer recipients. (C) The relative abundance of relevant T and B cell subsets in SI SLOs are shown. CD4+ T cells: Student’s t-test with Welch’s correction for heteroscedasticity; ns=not significant. TFH cells, GC-TFH cells, Naïve B cells, GC B cells: Mann-Whitney U test, ns=not significant, **=p<0.01, ****=p<0.0001. Activated B cells: Student’s t-test; ****=p<0.0001. (D) Fecal IgA concentrations as measured by ELISA over course of seven-week experiment are shown for each experimental group. (E) Final fecal IgA concentrations at experimental endpoint (seven weeks post-transfer) are shown. Multiple t-test with Tukey’s post-hoc correction for multiple hypothesis testing (all-vs-all) (ns=not significant, *=p<0.05, **=p<0.01). (E, F) Representative FACS plot demonstrating gating around background signal in Rag1 -/- mice is shown. The abundance of IgA-bound bacteria in the feces of experimental groups are shown (dotted line represents limit of detection based on false-positive threshold in Rag1 -/- controls). Multiple t-test with Dunnett post-hoc correction for multiple hypothesis testing (all-vs-’Controls’) (ns, not significant, ****=p<0.0001).
Figure 3
Figure 3
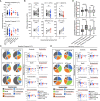
Effect of B-cell-specific MhcII on SI microbiota composition. (A) A PcoA plot of results of unweighted UniFrac analysis of β–diversity demonstrating that adoptive transfer drives shifts in phylogenetic composition of the microbiota is shown. (B) Unweighted distance boxplots depicting compositional divergence in microbial communities of experimental groups from that of controls. Multiple Kruskal-Wallis tests with Dunn’s correction for multiple hypothesis testing (all-vs-controls) (ns, not significant, *=p>0.05, ****=p<0.0001). (C) A PcoA plots of results of weighted UniFrac analysis of β–diversity that adoptive transfer drives shifts in the relative abundance of bacterial taxa is shown. (D) Weighted distance boxplots depicting compositional divergence in microbial communities of experimental groups from that of controls. Multiple Kruskal-Wallis tests with Dunn’s correction for multiple hypothesis testing (all-vs-controls) (ns, not significant, ****=p<0.0001). (E) A PcoA plot of results of unweighted UniFrac analysis of β–diversity demonstrating that B-cell-specific MhcII signaling influences the phylogenetic composition of the SI-resident microbiota is shown. (F) α-rarefaction plots demonstrating equal sampling of SI-resident microbial diversity among control animals and co-T:B transfer recipients. Multiple Kruskal-Wallis tests with Dunn’s correction for multiple hypothesis testing (all-vs-controls) (ns, not significant, **=p<0.01). (G) A PcoA plot of results of unweighted UniFrac analysis of β–diversity demonstrating that single transfer of B cells or T cells does not explain the loss of diversity in mice co-transferred with WT T cells and MhcII Δ B cells is shown. (H) An α-rarefaction plot demonstrating equal sampling of SI-resident microbial diversity among control animals and T cell or B cell only transfer groups is shown. Multiple t-tests with Dunnet correction for multiple hypothesis testing (all-vs-controls) (ns=not significant, **=p<0.01, ***=p<0.001). (I) (left panel) Pie charts depicting the relative abundance of bacteria (by Class) are shown for each treatment group. (right panel) Significant shifts in bacterial abundance between co-transfer treatment groups versus controls are shown. Multiple Kruskal-Wallis tests with Dunn’s correction for multiple hypothesis testing (all-vs-controls) (ns, not significant, *=p<0.05, **=p<0.01, ***=p<0.0001, ****=p<0.0001). (B, D) Error bars represent min-max range. (F, H) Error bars represent S.E.M.
Figure 4
Figure 4
Effect of B-cell-specific MhcII on fecal microbiota composition. (A) (upper panel) Species richness values from fecal communities for each treatment group are shown and demonstrate equivalence in species richness immediately prior to adoptive transfer (timepoint 0 (T0) samples). (lower panel) Species richness values from fecal communities for each treatment group are shown and demonstrate that observed loss of species richness is a unique consequence of co-transfer with WT T cells and MhcII Δ B cells. Multiple Kruskal-Wallis tests with Dunn’s correction for multiple hypothesis testing (all-vs-controls) (ns, not significant, **=p<0.01). (B) Paired species richness values from animals before and after adoptive cell transfers are shown demonstrating that the loss of species richness in co-transfer mice receiving WT T cells and MhcII Δ B cells is a highly repeatable phenotype. Individual paired t-tests (ns, not significant, **=p<0.01, ***=p<0.001). (C) (left panel) Pie charts depicting the relative abundance of bacteria (by Class) are shown for each treatment group at timepoint 0 (T0). (right panel) Prior to adoptive transfer, bacterial abundances are not different among treatment groups. Multiple Kruskal-Wallis tests with Dunn’s correction for multiple hypothesis testing (all-vs-controls)(ns=not significant). (D) (left panel) Pie charts depicting the relative abundance of bacteria (by Class) are shown for each treatment group at week 7 post-transfer (T1). (right panel) Significant shifts in bacterial abundance between co-transfer treatment groups versus controls are shown. Multiple Kruskal-Wallis tests with Dunn’s correction for multiple hypothesis testing (all-vs-controls) (ns, not significant, *=p<0.05, **=p<0.01, ***=p<0.0001, ****=p<0.0001). (E) Distance boxplots depicting within-group (‘controls vs. controls’) versus between-group (‘controls vs. transfers’) compositional divergence in microbial communities. (left panel) Distance boxplots based on unweighted UniFrac analysis demonstrate that phylogenetic shifts in microbiota composition are larger in SI-resident communities compared to fecal communities after adoptive transfer. (right panel) Distance boxplots based on weighted UniFrac analysis demonstrate that shifts in bacterial abundance are larger in SI-resident communities compared to fecal communities after adoptive transfer. Multiple Kruskal-Wallis tests with Dunn’s correction for multiple hypothesis testing (all-vs-controls) (***=p<0.001, ****=p<0.00001). Error bars reflect min-max range in data.
Figure 5
Figure 5
The effect of B-cell-specific MhcII on microbiota composition operates largely through an IgA-independent mechanism. (A) Experimental treatment groups are shown. Created with Biorender.com. (B) PcoA plots of weighted UniFrac analysis of β–diversity between SI-resident (left panel) and fecal (right panel) microbial communities demonstrate that loss of IgA does not appreciably impact shifts in bacterial abundance caused by co-adoptive transfer of T cells and B cells. (C) Rarefaction plots demonstrating equal sampling of SI-resident (upper panel) and fecal (lower panel) microbial diversity among experimental cohorts are shown and demonstrate that an inability to generate TD IgA does not explain the reduction in species richness observed in co-transfer mice receiving WT T cells and MhcII Δ B cells. (D) (left panel) Pie charts depicting the relative abundance of SI-resident bacteria (by Class) are shown for each treatment group versus controls. (right panel) Significant shifts in bacterial abundance between co-transfer treatment groups versus controls are shown and demonstrate that an inability to generate IgA influences SI-resident bacterial abundance after co-transfer, but does not explain shifts in abundance observed in co-transfer mice receiving WT T cells and MhcII Δ B cells. Multiple Kruskal-Wallis tests with Dunn’s correction for multiple hypothesis testing (all-vs-controls) (ns, not significant, ****=p<0.0001). (E) (left panel) Pie charts depicting the relative abundance of fecal bacteria (by Class) are shown for each treatment group versus controls at week seven post-transfer. (right panel) Significant shifts in bacterial abundance between co-transfer treatment groups versus controls are shown and demonstrate that an inability to generate IgA influences fecal bacterial abundance after co-transfer, but does not explain shifts in abundance observed in co-transfer mice receiving WT T cells and MhcII Δ B cells. Multiple Kruskal-Wallis tests with Dunn’s correction for multiple hypothesis testing (all-vs-controls) (ns, not significant, *=p<0.05, ****=p<0.0001). (F) The degree of divergence in SI-resident (upper panel) and fecal (lower panel) microbial composition in transfer recipients versus controls are shown demonstrating that IgA is a diversifying force of selection on the microbiota that exerts its strongest effect on SI-resident community composition. Multiple t-test with Dunnett post-hoc correction for multiple hypothesis testing (all-vs-controls) (ns, not significant, ****=p<0.0001). Error bars represent min-max range of data.

References

    1. Wieczorek M, Abualrous ET, Sticht J, Álvaro-Benito M, Stolzenberg S, Noé F, et al. . Major histocompatibility complex (MHC) class I and MHC class II proteins: conformational plasticity in antigen presentation. Front Immunol (2017) 8:292. doi: 10.3389/fimmu.2017.00292 - DOI - PMC - PubMed
    1. MacLennan IC. Germinal centers. Annu Rev Immunol (1994) 12:117–39. doi: 10.1146/annurev.iy.12.040194.001001 - DOI - PubMed
    1. Gray D, Siepmann K, van Essen D, Poudrier J, Wykes M, Jainandunsing S, et al. . B-T lymphocyte interactions in the generation and survival of memory cells. Immunol Rev (1996) 150:45–61. doi: 10.1111/j.1600-065x.1996.tb00695.x - DOI - PubMed
    1. Jacob J, Kelsoe G, Rajewsky K, Weiss U. Intraclonal generation of antibody mutants in germinal centres. Nature (1991) 354:389–92. doi: 10.1038/354389a0 - DOI - PubMed
    1. Berek C, Berger A, Apel M. Maturation of the immune response in germinal centers. Cell (1991) 67:1121–9. doi: 10.1016/0092-8674(91)90289-b - DOI - PubMed

Publication types