. 2023 Dec 22:14:1308539.
doi: 10.3389/fimmu.2023.1308539. eCollection 2023.

HELIOS-expressing human CD8 T cells exhibit limited effector functions

Affiliations

HELIOS-expressing human CD8 T cells exhibit limited effector functions

Damien Neyens et al. Front Immunol. .

Abstract

Introduction: The transcription factor HELIOS is primarily known for its expression in CD4 regulatory T cells, both in humans and mice. In mice, HELIOS is found in exhausted CD8 T cells. However, information on human HELIOS+ CD8 T cells is limited and conflicting.

Methods: In this study, we characterized by flow cytometry and transcriptomic analyses human HELIOS+ CD8 T cells.

Results: These T cells primarily consist of memory cells and constitute approximately 21% of blood CD8 T cells. In comparison with memory HELIOS- T-BEThigh CD8 T cells that displayed robust effector functions, the memory HELIOS+ T-BEThigh CD8 T cells produce lower amounts of IFN-γ and TNF-α and have a lower cytotoxic potential. We wondered if these cells participate in the immune response against viral antigens, but did not find HELIOS+ cells among CD8 T cells recognizing CMV peptides presented by HLA-A2 and HLA-B7. However, we found HELIOS+ CD8 T cells that recognize a CMV peptide presented by MHC class Ib molecule HLA-E. Additionally, a portion of HELIOS+ CD8 T cells is characterized by the expression of CD161, often used as a surface marker for identifying TC17 cells. These CD8 T cells express TH17/TC17-related genes encoding RORgt, RORa, PLZF, and CCL20.

Discussion: Our findings emphasize that HELIOS is expressed across various CD8 T cell populations, highlighting its significance beyond its role as a transcription factor for Treg or exhausted murine CD8 T cells. The significance of the connection between HELIOS and HLA-E restriction is yet to be understood.

Keywords: CD8 T lymphocytes; HELIOS; HLA-E; Tc17; human.


Conflict of interest statement

The authors declare that the research was conducted in the absence of any commercial or financial relationships that could be construed as a potential conflict of interest. The author(s) declared that they were an editorial board member of Frontiers, at the time of submission. This had no impact on the peer review process and the final decision.

Figures
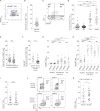
Figure 1
Figure 1
The majority of HELIOS+ CD8 T cells are antigen-experienced. Frozen PBMC were thawed and rested for 2h at 37°C with DNase. Additionally, CD38 was labeled for healthy donors and COVID-19 patients. Ovarian cancer patient samples were also labeled with CD19, CD20, CD33, and CD326. Following overnight fixation and permeabilization, intracellular staining for HELIOS was performed at 4°C. Ki-67 staining was also performed for healthy donors and COVID-19 patients. The samples were analyzed by flow cytometry. (A) Representative donor’s data showing the prevalence of HELIOS+ cells within living CD2+ CD8β+ cells (B) data for 58 donors. These data were obtained from 13 females and 45 males. The raw data are also available in Supplementary Table 1 . The mean frequencies of HELIOS+ cells were 26% and 20% respectively. These two mean frequencies are not different according to an unpaired t-test. (C) Distribution of living CD2+ CD8β+ HELIOS+ cells among T cell subsets is shown for one representative donor and (D) for 51 donors. (E) The prevalence of HELIOS+ cells in living CD2+ CD8β+ cells is compared between healthy donors and COVID-19 patients and (F) between blood and tumors from ovarian cancer patients. The average age of cancer patients was 61 years old, while the average was 55 for the blood donors. These averages are not different according to an unpaired t-test. (G) Frequency of Ki-67+ cells and (H) CD38+ cells among living CD2+ CD8β+ cells are shown in healthy donors and COVID-19 patients. (I) Percentage of Ki-67-positive cells in HELIOS+ and HELIOS- CD8 TILs from ovarian cancer samples. (J) Representative donors’ data showing the TOX expression in non-naïve CD8 T-cells from blood or tumor, and gating strategy to identify TOXhi cells. (K) Percentage of TOXhi cells in HELIOS- or HELIOS+ non-naive CD8 T-cell from tumor samples. Data from 23 donors. Mean +/- SEM are shown. P values * = < 0,05, ** = < 0,01, *** = < 0,001 (one-way ANOVA).
Figure 2
Figure 2
Association of HELIOS expression in CD8 T cells with impaired effector functions. PBMCs were thawed for 2h at 37°C with DNase. The cells were then stimulated with coated anti-CD3 (1μg/ml) or PMA (1ng/ml) and ionomycin (1μg/ml) for 5h at 37°C., Brefeldin A was added after the first hour of stimulation to block cytokine secretion. At the end of the 5h stimulation, cells were stained for viability, CD2, CD8β, CCR7 and CD45RA. Subsequently, the cells were fixed and permeabilized overnight, followed by intracellular staining for T-BET, HELIOS and IFN-γ. The samples were analyzed by flow cytometry. (A) Percentages of IFN-γ+ cells for resting T cells are shown (B) Representative plots for anti-CD3 activation are shown for TEM for one donor and the percentages of IFN-γ+ cells and median fluorescence intensity are shown for TEM of 12 donors. (C) Representative plots for PMA-ionomycin activation are shown for TEM for one donor and the median fluorescence intensity is shown for TEM of 12 donors. (D) Percentages of TNF-α+ cells for resting T cells are shown. (E) Representative plots for anti-CD3 activation are shown for TEM for one donor and the percentages of TNF-α+ cells are shown for TEM of 8 donors. (F) Representative plots for PMA-ionomycin activation are shown for TEM for one donor and the percentage of TNF-α+ cells and median fluorescence intensity are shown for TEM of 8 donors. (G) Representation of the membrane-bound anti-CD3 structure (inspired from (Leitner et al., 2010)). (H) Percentages of CD107a/b+ cells for resting T cells are shown. (I) Representative plots for membrane-bound anti-CD3 activation are shown for TEM for one donor and percentage of CD107a/b+ cells are shown for TEM of 12 donors. Mean +/- SEM are shown. P values *** = < 0,01, *** = < 0,001 (paired t test).
Figure 3
Figure 3
HELIOS+ CD8 T cells consist of at least two subpopulations: TC17 and T-BEThigh CD8 T cells. (A–I) Frozen MACS-sorted CD8 PBLs from 6 donors were thawed for 2h at 37°C and then activated with plate-bound anti-CD3 antibody (1μg/ml) for 5h at 37°C. Cells were labeled for viability, CD2, CD8β, CCR7 and CD45RA. Then, cells were fixed and permeabilized overnight and stained intracellularly for HELIOS in presence of RNase inhibitors at 4°C. HELIOS+ and HELIOS- CD8 TEM (CCR7- CD45RA-) were sorted by flow cytometry. RNA was then extracted to perform paired-end RNA sequencing. Data normalization and analysis were done with DESeq2. (A) The principal component analysis is shown. (B) Heatmaps for differentially expressed genes of non-activated and (C) activated samples are shown with hierarchical clustering on genes and samples. Expression values of selected transcription factors for unstimulated samples are shown for (D) HELIOS, (E) ZBTB16, RORC and RORA. Expression values for selected cytokines (F) upregulated in HELIOS+ CD8 TEM and (G) downregulated ones are shown. (H) Expression values for unstimulated samples are shown for the surface marker KLRB1/CD161. P values * = < 0,05, ** = < 0,01, *** = < 0,001 (DESeq 2 paired samples analysis). (I–N) PBMCs were thawed for 2h at 37°C. Cells were labeled for viability, CD2, CD8β, CCR7, CD45RA and CD161. Then, cells were fixed and permeabilized overnight and stained intracellularly for HELIOS. Samples were analyzed by flow cytometry. (I) Percentages of HELIOS+ cells among CD161- and CD161+ CD8 TEM (CCR7- CD45RA-) are shown for 42 donors and (J) one donor. (K) Frequency of TC1 (T-BEThigh), TC17 (CD161+) and FOXP3+ cells among HELIOS+ CD8 T cells are shown for 10 donors and (L) for one donor. (M) The intensity (MFI) of HELIOS staining is shown for one donor and (N) for 10 donors. Mean +/- SEM are shown. P values *** = < 0,001 ((I) Wilcoxon signed-rank test and (M) one-way ANOVA).
Figure 4
Figure 4
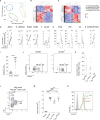
Transcriptomes of HELIOS+ and HELIOS- CD8 T cell subpopulations. Frozen MACS-sorted CD8 PBLs from 4 donors were thawed for 2h at 37°C and then activated with plate-bound anti-CD3 antibody (1μg/ml) for 5h at 37°C. Cells were labeled for viability, CD8β, CCR7, CD45RA and CD161. Then, cells were fixed and permeabilized overnight and stained intracellularly for HELIOS and T-BET in presence of RNase inhibitors at 4°C. HELIOS+ and HELIOS- T-BEThigh, T-BETint/low and CD161+ TEM/EMRA CD8 T cells (CCR7-) were sorted by flow cytometry. RNA was then extracted to perform paired-end RNA sequencing. Data normalization and analysis were done with DESeq2. (A) The principal component analysis is shown. (B) Heatmaps for differentially expressed genes of resting and (C) activated samples are shown with hierarchical clustering on genes and samples. Expression values of selected transcription factors for resting samples are shown for (D) HELIOS, (E) ZBTB16, RORC and RORA and (F) KLRB1/CD161. Expression values for selected cytokines (G) upregulated in HELIOS+ CD8 TEM and (H) downregulated ones are shown. P values * = < 0,05, *** = < 0,001 (Qlucore ANOVA analysis).
Figure 5
Figure 5
HELIOS+ CD8 T cells are found in HLA-E-restricted T cells. PBMCs were thawed and rested for 2h at 37°C. The cells were labeled with a multimer and stained for viability, CD2, CD8β, CCR7, CD45RA. Next, cells were fixed and permeabilized overnight and stained intracellularly for HELIOS at 4°C. Samples were analyzed by flow cytometry. (A) Frequency of HELIOS+ cells in living CD2+ CD8β+ multimer+ cells are shown for virus-derived peptides presented by HLA-A2, HLA-B7 and HLA-E. CMV.A2 (pp65: NLVPMVATV) and EBV.A2 (BMF-L1: GLCTLVAML) multimer+ CD8 T cells were detected in 6 out of 11 HLA-A2 donors and 5 out of 11 for Flu.A2 (M1: GILGFVFTL) multimer. CMV.B7 (pp65: RPHERNGFTVL or TPRVTGGGAM) multimer+ CD8 T cells were detected in 2 out 4 HLA-B7 donors for peptide RPHERNGFVTL and 1 out of 4 HLA-B7 donors for peptide TPRVTGGGAM. CMV.E (UL40: VMAPRTLIL) multimer+ CD8 T cells were detected in 13 out of 20 non-typed donors. EBV.E (BZF-L1: SQAPLPCVL) multimer+ CD8 T cells were detected in 1 out of 20 non-typed donors. (B) Percentages of HELIOS+ cells among multimer+ cells are shown for one donor with the CMV.E multimer. (C) Percentages of multimer+ cells among HELIOS+ CD8 T cells are shown for CMV.E and EBV.E multimers. (D) Frequency of IFN-γ+ cells among multimer+ cells is shown at resting state for 6 donors. (E) Frequency of IFN-γ+ cells among multimer+ cells is shown after 5h anti-CD3 stimulation for 6 donors and representative FACS plots are shown for 2 donors. Mean +/- SEM are shown. P values * = < 0,05, ** = < 0,01 (Kruskal-Wallis test).
Figure 6
Figure 6
HELIOS+ anti-CMV.E CD8 T cells are distinct from their HELIOS- anti-CMV counterparts and express low levels of IFN-γ. Frozen MACS-sorted CD8 PBLs from 6 donors were thawed for 2h at 37°C and then activated with plate-bound anti-CD3 antibody (1μg/ml) for 5h at 37°C. Cells were labeled for viability, CD8β, CCR7, CD45RA and CMV tetramer. Then, cells were fixed and permeabilized overnight and stained intracellularly for HELIOS in presence of RNase inhibitors at 4°C. HELIOS+ and HELIOS- anti-CMV.A2/B7/2 CD8 T cells were sorted by flow cytometry. RNA was then extracted to perform paired-end RNA sequencing. Data normalization and analysis were done with DESeq2. (A) The principal component analysis is shown. (B) Heatmaps for differentially expressed genes of resting and (C) activated samples are shown with hierarchical clustering on genes and samples. (D) Expression values for resting samples are shown for HELIOS. (E) Expression values for selected cytokines are shown. P values * = < 0,05, ** = < 0,01, *** = < 0,001 (Qlucore ANOVA analysis).

References

    1. Doering TA, Crawford A, Angelosanto JM, Paley MA, Ziegler CG, Wherry EJ. Network analysis reveals centrally connected genes and pathways involved in CD8+ T cell exhaustion versus memory. Immunity (2012) 37(6):1130−44. doi: 10.1016/j.immuni.2012.08.021 - DOI - PMC - PubMed
    1. Ju ST, Sharma R, Gaskin F, Kung JT, Fu SM. The biology of autoimmune response in the scurfy mice that lack the CD4+Foxp3+ Regulatory T-cells. Biology (2012) 1(1):18−42. doi: 10.3390/biology1010018 - DOI - PMC - PubMed
    1. Khan O, Giles JR, McDonald S, Manne S, Ngiow SF, Patel KP, et al. . TOX transcriptionally and epigenetically programs CD8+ T cell exhaustion. Nature (2019) 571(7764):211−8. doi: 10.1038/s41586-019-1325-x - DOI - PMC - PubMed
    1. Kim HJ, Barnitz RA, Kreslavsky T, Brown FD, Moffett H, Lemieux ME, et al. . Stable inhibitory activity of regulatory T cells requires the transcription factor Helios. Science (2015) 350(6258):334−9. doi: 10.1126/science.aad0616 - DOI - PMC - PubMed
    1. Mucida D. Oral tolerance in the absence of naturally occurring Tregs. J Clin Invest (2005) 115(7):1923−33. doi: 10.1172/JCI24487 - DOI - PMC - PubMed

Publication types