. 2023 Dec 19:14:1313536.
doi: 10.3389/fimmu.2023.1313536. eCollection 2023.

An integrated analysis of bulk and single-cell sequencing data reveals that EMP1+/COL3A1+ fibroblasts contribute to the bone metastasis process in breast, prostate, and renal cancers

Affiliations

An integrated analysis of bulk and single-cell sequencing data reveals that EMP1+/COL3A1+ fibroblasts contribute to the bone metastasis process in breast, prostate, and renal cancers

Haoyuan Du et al. Front Immunol. .

Abstract

Introduction: Bone metastasis (BoM) occurs when cancer cells spread from their primary sites to a bone. Currently, the mechanism underlying this metastasis process remains unclear.

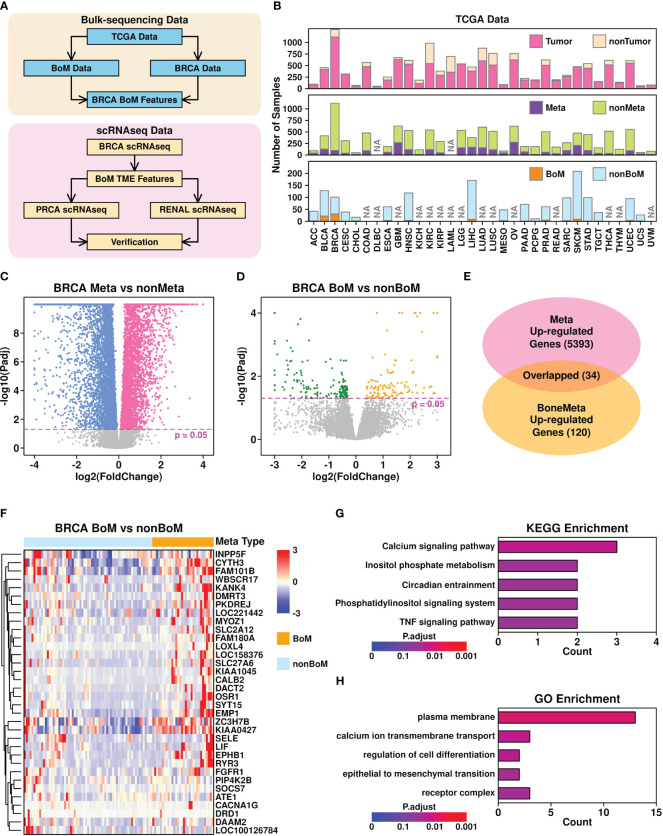
Methods: In this project, through an integrated analysis of bulk-sequencing and single-cell RNA transcriptomic data, we explored the BoM-related features in tumor microenvironments of different tumors.

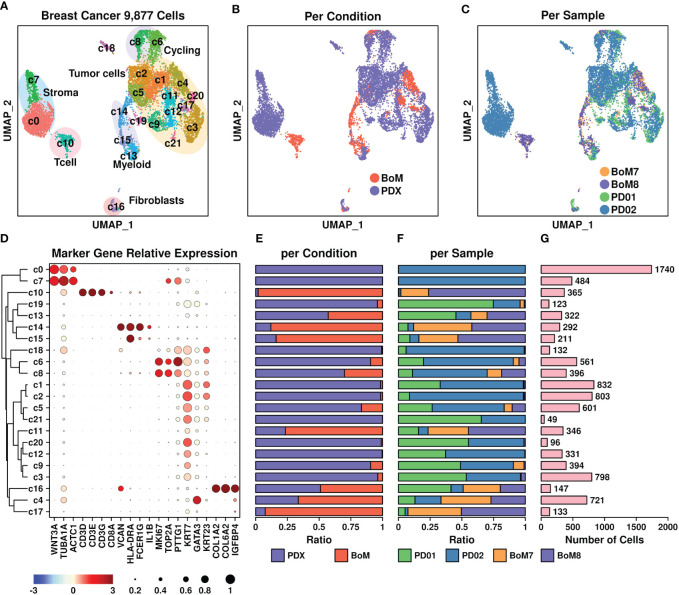
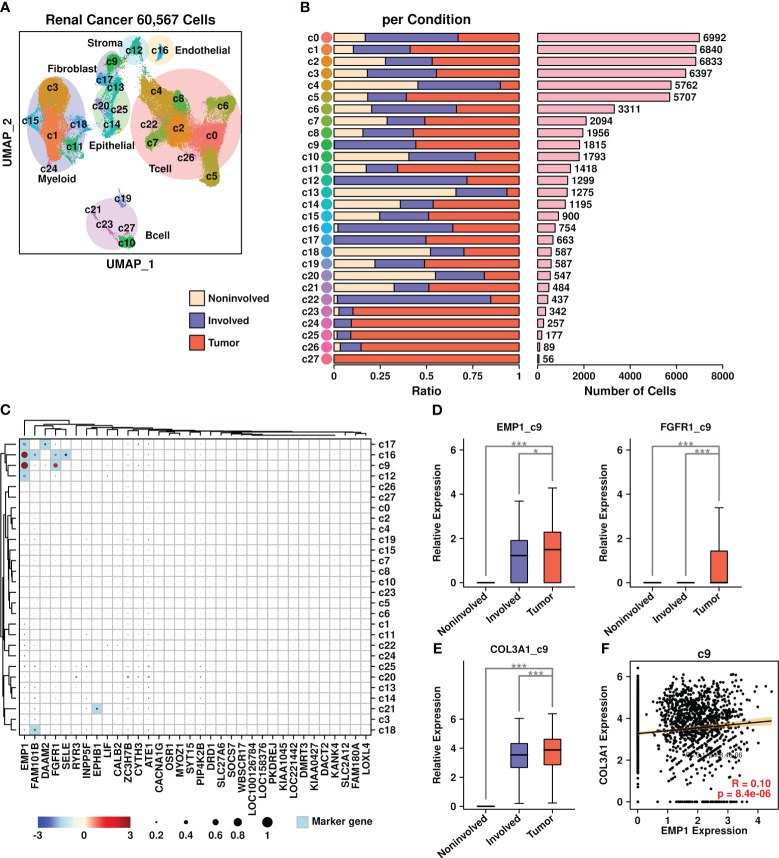
Results: We first identified 34 up-regulated genes during the BoM process in breast cancer, and further explored their expression status among different components in the tumor microenvironment (TME) of BoM samples. Enriched EMP1+ fibroblasts were found in BoM samples, and a COL3A1-ADGRG1 communication between these fibroblasts and cancer cells was identified which might facilitate the BoM process. Moreover, a significant correlation between EMP1 and COL3A1 was identified in these fibroblasts, confirming the potential connection of these genes during the BoM process. Furthermore, the existence of these EMP1+/COL3A1+ fibroblasts was also verified in prostate cancer and renal cancer BoM samples, suggesting the importance of these fibroblasts from a pan-cancer perspective.

Discussion: This study is the first attempt to investigate the relationship between fibroblasts and BoM process across multi-tumor TMEs. Our findings contribute another perspective in the exploration of BoM mechanism while providing some potential targets for future treatments of tumor metastasis.

Keywords: EMP1+/COL3A1+ fibroblasts; bone metastasis; combined analysis; multi-tumor TMEs; scRNAseq.


Conflict of interest statement

The authors declare that the research was conducted in the absence of any commercial or financial relationships that could be construed as a potential conflict of interest.

Figures

Figure 1
Figure 1
Bone metastasis-related features revealed in bulk-sequencing data. (A) Flowchart describing the research design of this study; (B) Summary of sample information from TCGA database. NA, no records; (C) Volcano plot illustrating the identification of differentially expressed genes in Meta samples (samples with metastasis records) vs non-Meta samples (samples without metastasis records); (D) Volcano plot illustrating the identification of differentially expression genes in BoM samples (metastasis samples with bone metastasis records) vs nonBoM samples (metastasis samples without bone metastasis records); (E) Overlap between upregulated genes in Meta samples and BoM samples; (F) Expression status of upregulated genes in Meta samples; (G) Boxplot representing the KEGG enrichment results of 34 upregulated genes; (H) Boxplot representing the GO enrichment results of 34 upregulated genes.
Figure 2
Figure 2
Breast cancer scRNAseq data. (A) UMAP plot showing the distribution patterns of all subgroups; (B) UMAP plot showing the distribution patterns of all subgroups per sample type; (C) UMAP plot showing the distribution patterns of all subgroups per sample; (D) Dot plot representing the relative expression status of all marker genes used in the determination of each subgroup. The relative expression levels of each gene are represented in different colors (red: high; blue: low. Z-score normalization is performed). The ratios of cells with expressions of specific genes (count > 0) are represented by the size of the circle; (E–G) Bar plots showing the basic information of all 22 subgroups including ratio per condition (E), ratio per sample (F), and number of cells (G).
Figure 3
Figure 3
Expression status of BoM-featured genes. (A) Expression status of 34 upregulated genes among all subgroups. Overlapped genes between 34 upregulated genes and subgroup marker genes were highlighted in light blue color. The relative expression levels of each gene are represented in different colors (red: high; blue: low. Z-score normalization is performed); The ratios of cells with expressions of specific genes (count > 0) are represented by the size of the circle; (B) Expression status of target genes among candidate subgroups. A Wilcoxon rank-sum test was performed. ***: p < 0.001.
Figure 4
Figure 4
Gene expression features in BoM-derived subgroups. Volcano plots showing differentially expressed genes in c16 subgroup (A), c4 subgroup (C), and c11 subgroup (E). Bar plots showing top enriched KEGG items of upregulated genes from BoM-derived cells in c16 subgroup (B), c4 subgroup (D), and c11 subgroup (F).
Figure 5
Figure 5
Ligand-receptor analysis. (A) L-R interactions between ligands from the c16 subgroup (upregulated in BoM-derived cells) and receptors from the c4 subgroup (upregulated in BoM-derived cells); (B) L-R interactions between ligands from the c4 subgroup (upregulated in BoM-derived cells) and receptors from the c16 subgroup (upregulated in BoM-derived cells); (C) L-R interactions between ligands from the c16 subgroup (upregulated in BoM-derived cells) and receptors from the c11 subgroup (upregulated in BoM-derived cells); (D) L-R interactions between ligands from the c11 subgroup (upregulated in BoM-derived cells) and receptors from the c16 subgroup (upregulated in BoM-derived cells); The relative expression levels of each gene are represented in different colors (red: high; blue: low. Z-score normalization is performed). The ratios of cells with expressions of specific genes (count > 0) are represented by the size of the circle.
Figure 6
Figure 6
Pearson correlation analysis. (A) correlations between expression levels of EMP1 and ligand genes in the c16 subgroup; (B) correlations between expression levels of CYTH3 and ligand genes in the c16 subgroup; (C) correlations between expression levels of EMP1 and receptor genes in the c4 subgroup.
Figure 7
Figure 7
Prostate cancer scRNAseq data analysis. (A) UMAP plot showing the distribution patterns of all subgroups; (B) Bar plots showing the basic information of all 28 subgroups including ratio per condition and the number of cells; (C) Expression status of 34 upregulated genes among all subgroups. Overlapped genes between 34 upregulated genes and subgroup marker genes were highlighted in light blue color. The relative expression levels of each gene are represented in different colors (red: high; blue: low. Z-score normalization is performed). The ratios of cells with expressions of specific genes (count > 0) are represented by the size of the circle; (D) Expression EMP1 among different sample types in osteoblasts and endothelial cells; (E) Expression COL3A1 among different sample types in osteoblasts. A Wilcoxon rank-sum test was performed. *: p < 0.05; **: p < 0.01; ***: p < 0.001, and a “Bonferroni” correction was performed for multiple testing; (F) Pearson correlation between expression levels of EMP1 and COL3A1 in osteoblasts.
Figure 8
Figure 8
Renal cancer scRNAseq data analysis. (A) UMAP plot showing the distribution patterns of all subgroups; (B) Bar plots showing the basic information of all 28 subgroups including ratio per condition and the number of cells; (C) Expression status of 34 upregulated genes among all subgroups. Overlapped genes between 34 upregulated genes and subgroup marker genes were highlighted in light blue color. The relative expression levels of each gene are represented in different colors (red: high; blue: low. Z-score normalization is performed). The ratios of cells with expressions of specific genes (count > 0) are represented by the size of the circle; (D) Expression EMP1 among different sample types in the c9 subgroup; (E) Expression COL3A1 among different sample types in the c9 subgroup. A Wilcoxon rank-sum test was performed. *: p < 0.05; **: p < 0.01; ***: p < 0.001, and a “Bonferroni” correction was performed for multiple testing; (F) Pearson correlation between expression levels of EMP1 and COL3A1 in the c9 subgroup.
Figure 9
Figure 9
Pearson correlation analysis. (A) Pearson correlation analysis between expression levels of COL3A1/EMP1 genes and EMT-related genes in different subgroups of breast cancer scRNAseq data; (B) Pearson correlation analysis between expression levels of COL3A1/EMP1 genes and EMT-related genes in different subgroups of prostate cancer scRNAseq data; (C) Pearson correlation analysis between expression levels of COL3A1/EMP1 genes and EMT-related genes in different subgroups of renal cancer scRNAseq data; (D) Pearson correlation analysis between expression levels of COL3A1/EMP1 genes and EMT-related genes in bulk-sequencing data of 28 different cancers from the TCGA database; Z-score normalization was performed to get the expression data of COL3A1/EMP1 genes.

Similar articles

Cited by

References

    1. Li S, Peng Y, Weinhandl ED, Blaes AH, Cetin K, Chia VM, et al. . Estimated number of prevalent cases of metastatic bone disease in the US adult population. Clin Epidemiol (2012) 4:87–93. doi: 10.2147/CLEP.S28339 - DOI - PMC - PubMed
    1. Jiang W, Rixiati Y, Zhao B, Li Y, Tang C, Liu J. Incidence, prevalence, and outcomes of systemic Malignancy with bone metastases. J Orthop Surg (Hong Kong) (2020) 28:2309499020915989. doi: 10.1177/2309499020915989 - DOI - PubMed
    1. Svensson E, Christiansen CF, Ulrichsen SP, Rørth MR, Sørensen HT. Survival after bone metastasis by primary cancer type: A Danish population-based cohort study. BMJ Open (2017) 7:1–7. doi: 10.1136/bmjopen-2017-016022 - DOI - PMC - PubMed
    1. Nørgaard M, Jensen AØChecktae, Jacobsen JB, Cetin K, Fryzek JP, Sørensen HT. Skeletal related events, bone metastasis and survival of prostate cancer: a population based cohort study in Denmark (1999 to 2007). J Urol (2010) 184:162–7. doi: 10.1016/j.juro.2010.03.034 - DOI - PubMed
    1. Sathiakumar N, Delzell E, Morrisey MA, Falkson C, Yong M, Chia V, et al. . Mortality following bone metastasis and skeletal-related events among women with breast cancer: a population-based analysis of U.S. Medicare beneficiaries, 1999-2006. Breast Cancer Res Treat (2012) 131:231–8. doi: 10.1007/s10549-011-1721-x - DOI - PubMed

Publication types