

The pacing differences in performance levels of marathon and half-marathon runners
- PMID: 38187410
- PMCID: PMC10771621
- DOI: 10.3389/fpsyg.2023.1273451
The pacing differences in performance levels of marathon and half-marathon runners
Abstract
Introduction: Many studies indicate a considerable impact of optimal pacing on long-distance running performance. Given that the amount of carbohydrates in metabolic processes increases supralinearly with the running intensity, we may observe differences between the pacing strategies of two long-distance races and different performance levels of runners. Accordingly, the present study aimed to examine the differences in pacing strategies between marathon and half-marathon races regarding the performance levels of runners.
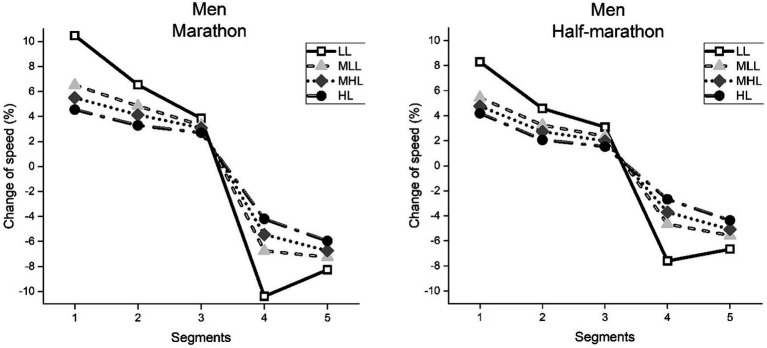
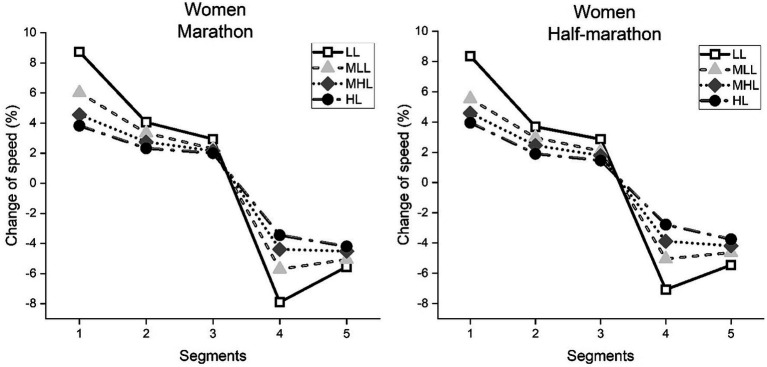
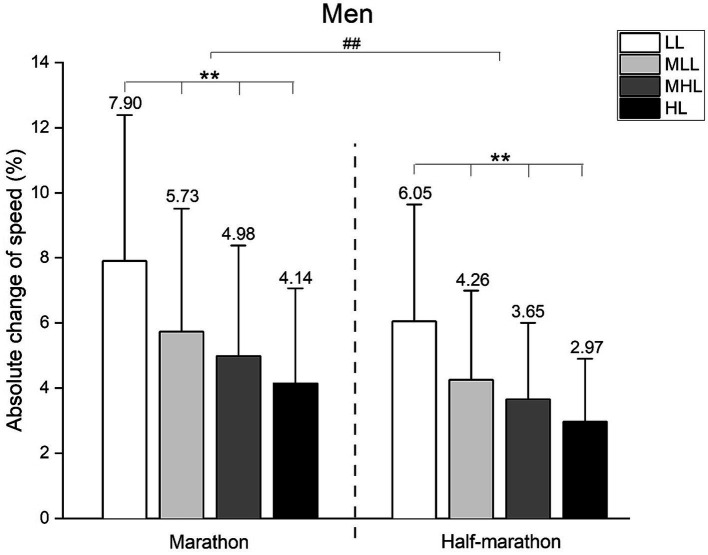
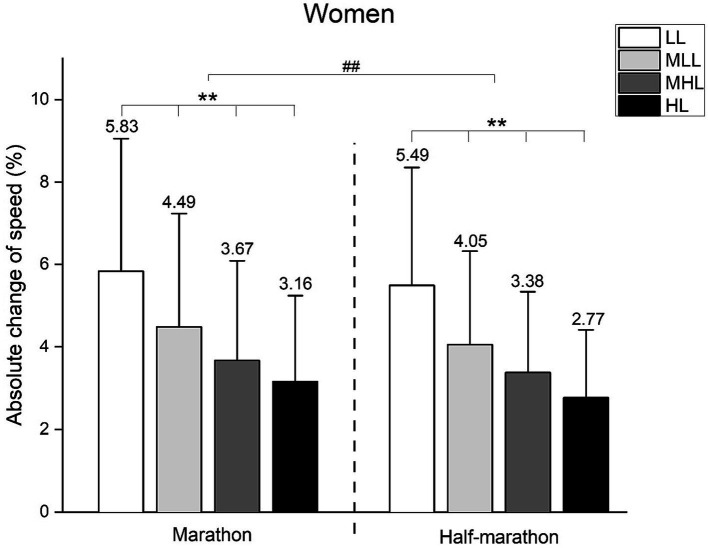
Methods: The official results and split times from a total of 208,760 (marathon, N = 75,492; half-marathon, N = 133,268) finishers in the "Vienna City Marathon" between 2006 and 2018 were analyzed. The percentage of the average change of speed for each of the five segments (CS 1-5), as well as the absolute change of speed (ACS) were calculated. The CS 1-5 for the marathon are as follows: up to the 10th km, 10th - 20th km, 20th - 30th km, 30th - 40th km, and from the 40th km to the 42.195 km. For the half-marathon, the CS 1-5 are half of the marathon values. Four performance groups were created as quartiles of placement separately for sexes and races: high-level (HL), moderate to high-level (MHL), moderate to low-level (MLL), and low-level (LL).
Results: Positive pacing strategies (i.e., decrease of speed) were observed in all performance groups of both sex and race. Across CS 1-5, significant main effects (p < 0.001) were observed for the segment, performance level, and their interaction in both sex and race groups. All LL groups demonstrated higher ACS (men 7.9 and 6.05%, as well as women 5.83 and 5.49%, in marathon and half-marathon, respectively), while the HL performance group showed significantly lower ACS (men 4.14 and 2.97%, as well as women 3.16 and 2.77%, in marathon and half-marathon, respectively). Significant main effects (p < 0.001) for the race were observed but with a low effect size in women (ŋ2 = 0.001).
Discussion: Better runners showed more even pacing than slower runners. The half-marathoners showed more even pacing than the marathoners across all performance groups but with a trivial practical significance in women.
Keywords: endurance; long-distance races; running; speed; strategy; variability.
Copyright © 2023 Ristanović, Cuk, Villiger, Stojiljković, Nikolaidis, Weiss and Knechtle.
Conflict of interest statement
The authors declare that the research was conducted in the absence of any commercial or financial relationships that could be construed as a potential conflict of interest.
Figures
Similar articles
-
Sex differences in pacing during half-marathon and marathon race.Res Sports Med. 2020 Jan-Mar;28(1):111-120. doi: 10.1080/15438627.2019.1593835. Epub 2019 Mar 21. Res Sports Med. 2020. PMID: 30897961
-
Pacing of Women and Men in Half-Marathon and Marathon Races.Medicina (Kaunas). 2019 Jan 14;55(1):14. doi: 10.3390/medicina55010014. Medicina (Kaunas). 2019. PMID: 30646638 Free PMC article.
-
Age Differences in Pacing in Endurance Running: Comparison between Marathon and Half-MarathonMen and Women.Medicina (Kaunas). 2019 Aug 14;55(8):479. doi: 10.3390/medicina55080479. Medicina (Kaunas). 2019. PMID: 31416198 Free PMC article.
-
Pacing profiles and tactical behaviors of elite runners.J Sport Health Sci. 2021 Sep;10(5):537-549. doi: 10.1016/j.jshs.2020.06.011. Epub 2020 Jun 26. J Sport Health Sci. 2021. PMID: 32599344 Free PMC article. Review.
-
Physiology and Pathophysiology in Ultra-Marathon Running.Front Physiol. 2018 Jun 1;9:634. doi: 10.3389/fphys.2018.00634. eCollection 2018. Front Physiol. 2018. PMID: 29910741 Free PMC article. Review.
Cited by
-
The physiology and psychology of negative splits: insights into optimal marathon pacing strategies.Front Physiol. 2025 Jul 16;16:1639816. doi: 10.3389/fphys.2025.1639816. eCollection 2025. Front Physiol. 2025. PMID: 40740427 Free PMC article. Review.
-
Prediction of half-marathon performance of male recreational marathon runners using nomogram.BMC Sports Sci Med Rehabil. 2024 Apr 29;16(1):97. doi: 10.1186/s13102-024-00889-3. BMC Sports Sci Med Rehabil. 2024. PMID: 38685085 Free PMC article.
-
Influence of Sex, Athletic Category and Athletic Level on Marathon Pacing Strategy: An Analysis of the Trinidad Alfonso EDP Valencia Marathon From 2014 to 2023.Eur J Sport Sci. 2025 Jul;25(7):e12329. doi: 10.1002/ejsc.12329. Eur J Sport Sci. 2025. PMID: 40531717 Free PMC article.
-
A case series of eight amateur athletes: exercise-induced pre-/syncope during the Zurich Marathon 2023.Eur Heart J Case Rep. 2024 Apr 19;8(5):ytae202. doi: 10.1093/ehjcr/ytae202. eCollection 2024 May. Eur Heart J Case Rep. 2024. PMID: 38711684 Free PMC article.
-
Mental preparation in runners: gender differences, competition levels, and psychological training effects on performance.Front Sports Act Living. 2024 Nov 15;6:1456504. doi: 10.3389/fspor.2024.1456504. eCollection 2024. Front Sports Act Living. 2024. PMID: 39620171 Free PMC article.
References
-
- Cohen J. (1988) Statistical power analysis for the behavioral sciences. 2nd. Lawrence Erlbaum Associates: Hillsdale, NJ, USA.
LinkOut - more resources
Full Text Sources