[Preprint]. 2023 Dec 23:2023.12.21.572859.
doi: 10.1101/2023.12.21.572859.

NOS2 and COX2 Provide Key Spatial Targets that Determine Outcome in ER- Breast Cancer

Affiliations

NOS2 and COX2 Provide Key Spatial Targets that Determine Outcome in ER- Breast Cancer

Lisa A Ridnour et al. bioRxiv. .

Abstract

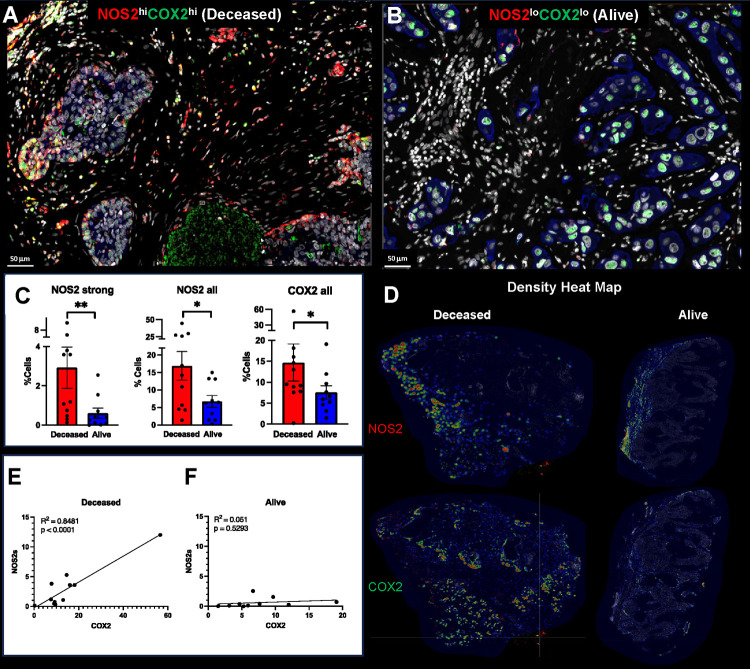
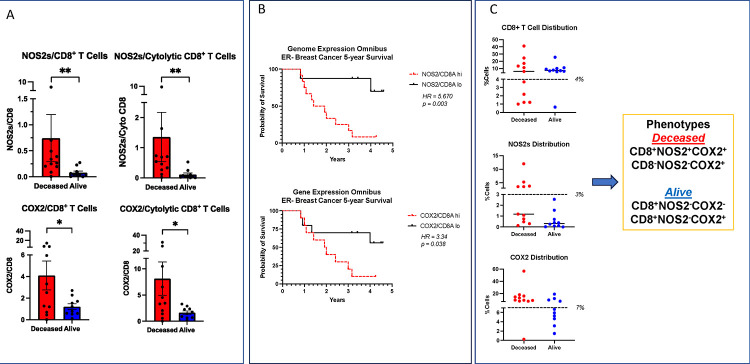
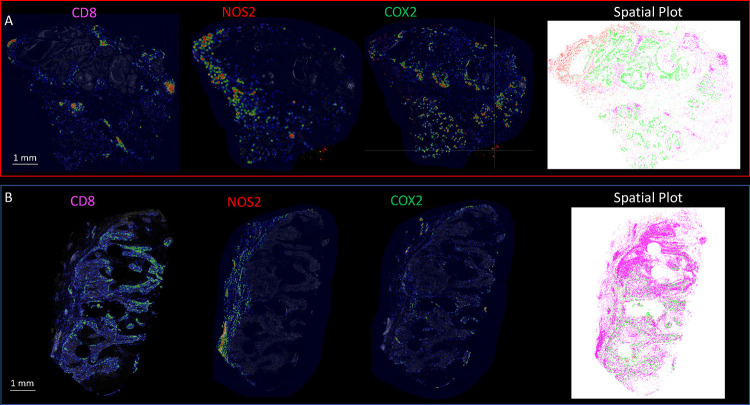
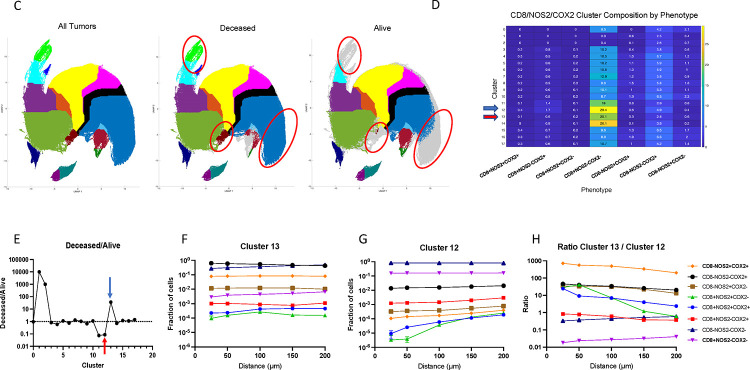
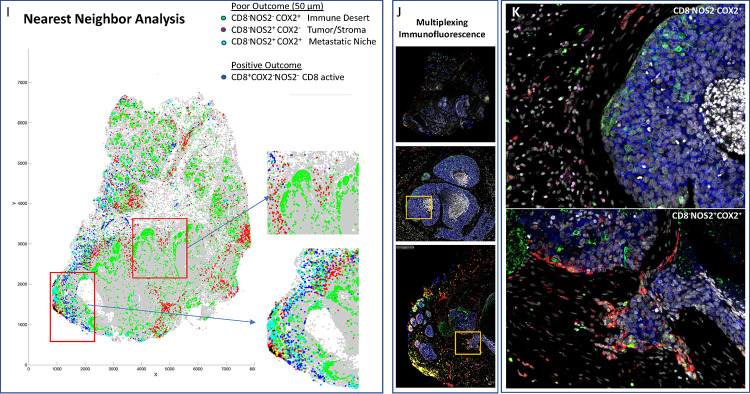
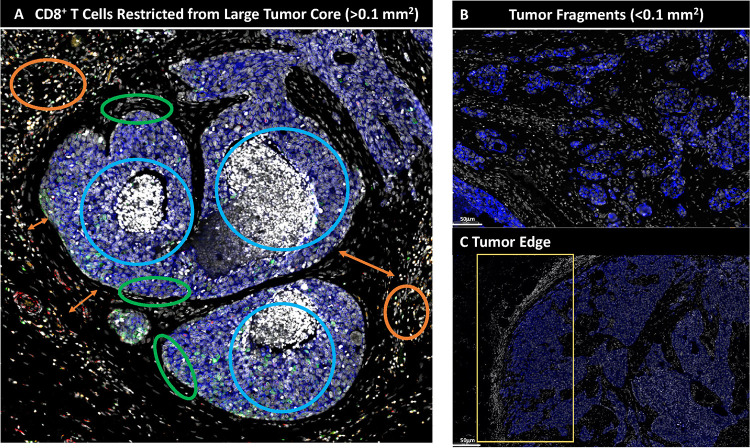
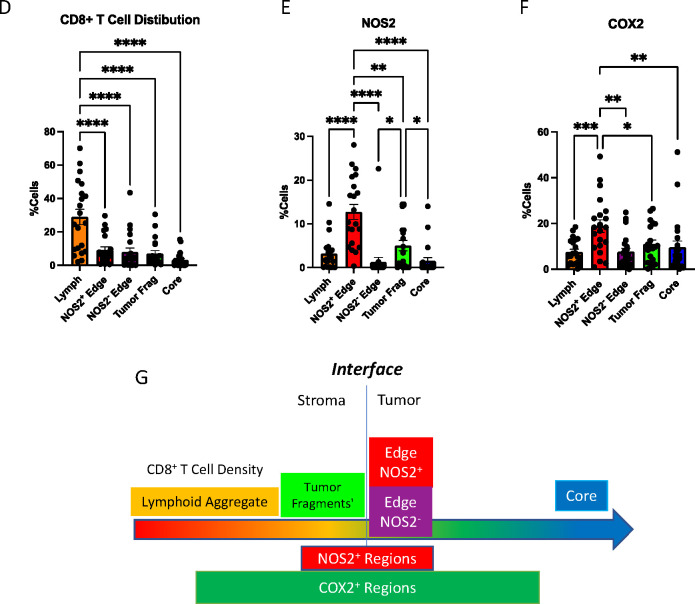
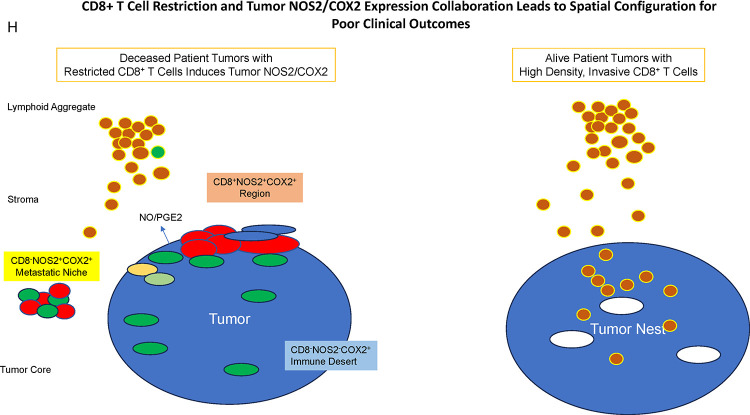
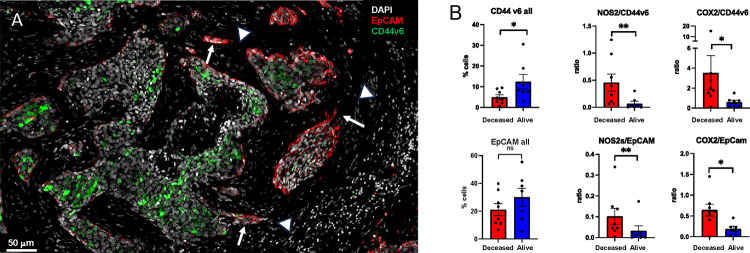
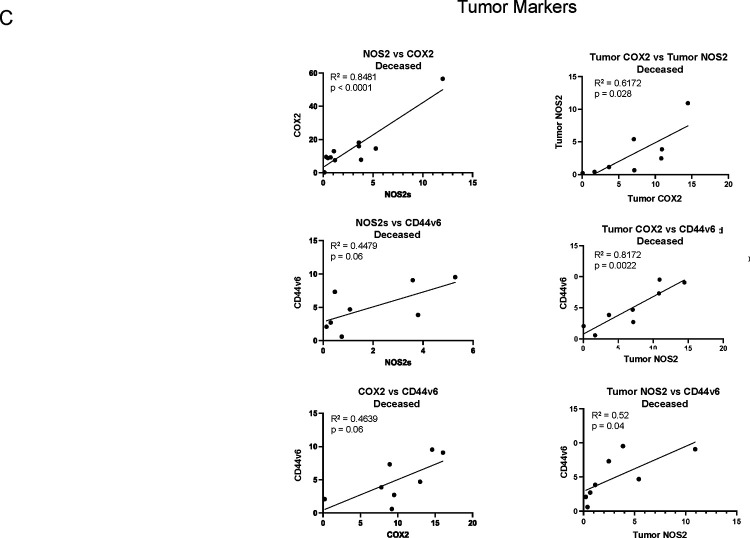
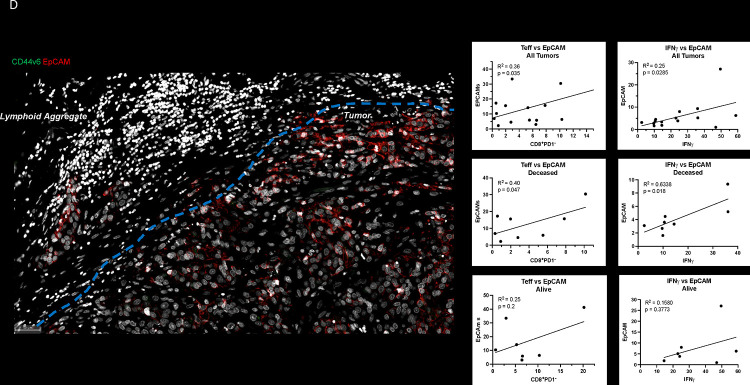
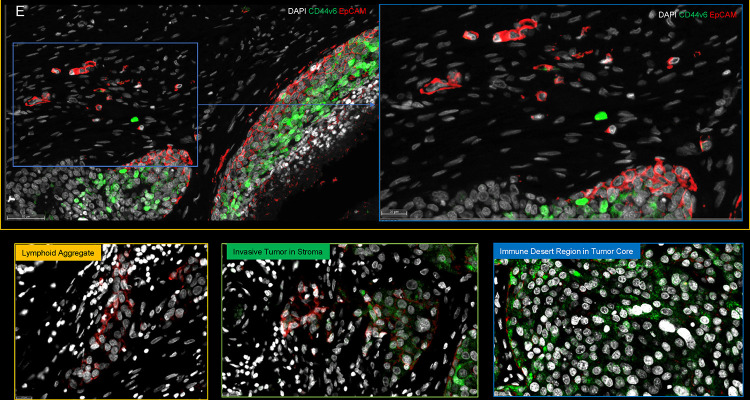
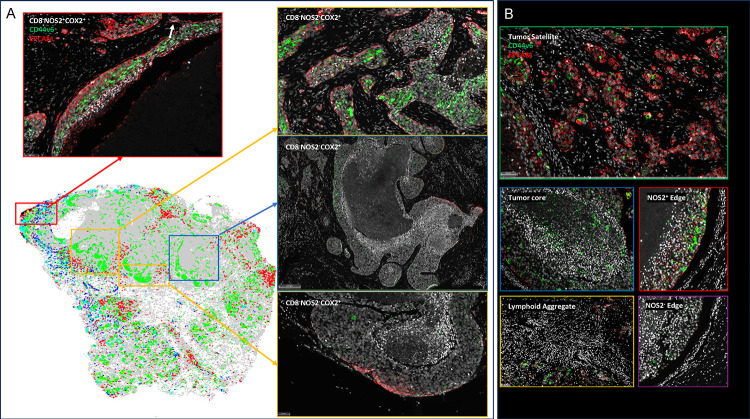
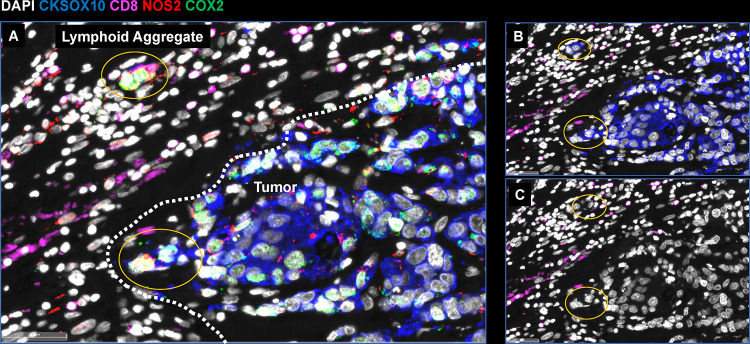
Estrogen receptor-negative (ER-) breast cancer is an aggressive breast cancer subtype with limited therapeutic options. Upregulated expression of both inducible nitric oxide synthase (NOS2) and cyclo-oxygenase (COX2) in breast tumors predicts poor clinical outcomes. Signaling molecules released by these enzymes activate oncogenic pathways, driving cancer stemness, metastasis, and immune suppression. The influence of tumor NOS2/COX2 expression on the landscape of immune markers using multiplex fluorescence imaging of 21 ER- breast tumors were stratified for survival. A powerful relationship between tumor NOS2/COX2 expression and distinct CD8+ T cell phenotypes was observed at 5 years post-diagnosis. These results were confirmed in a validation cohort using gene expression data showing that ratios of NOS2 to CD8 and COX2 to CD8 are strongly associated with poor outcomes in high NOS2/COX2-expressing tumors. Importantly, multiplex imaging identified distinct CD8+ T cell phenotypes relative to tumor NOS2/COX2 expression in Deceased vs Alive patient tumors at 5-year survival. CD8+NOS2-COX2- phenotypes defined fully inflamed tumors with significantly elevated CD8+ T cell infiltration in Alive tumors expressing low NOS2/COX2. In contrast, two distinct phenotypes including inflamed CD8+NOS2+COX2+ regions with stroma-restricted CD8+ T cells and CD8-NOS2-COX2+ immune desert regions with abated CD8+ T cell penetration, were significantly elevated in Deceased tumors with high NOS2/COX2 expression. These results were supported by applying an unsupervised nonlinear dimensionality-reduction technique, UMAP, correlating specific spatial CD8/NOS2/COX2 expression patterns with patient survival. Moreover, spatial analysis of the CD44v6 and EpCAM cancer stem cell (CSC) markers within the CD8/NOS2/COX2 expression landscape revealed positive correlations between EpCAM and inflamed stroma-restricted CD8+NOS2+COX2+ phenotypes at the tumor/stroma interface in deceased patients. Also, positive correlations between CD44v6 and COX2 were identified in immune desert regions in deceased patients. Furthermore, migrating tumor cells were shown to occur only in the CD8-NOS2+COX2+ regions, identifying a metastatic hot spot. Taken together, this study shows the strength of spatial localization analyses of the CD8/NOS2/COX2 landscape, how it shapes the tumor immune microenvironment and the selection of aggressive tumor phenotypes in distinct regions that lead to poor clinical outcomes. This technique could be beneficial for describing tumor niches with increased aggressiveness that may respond to clinically available NOS2/COX2 inhibitors or immune-modulatory agents.


Figures

Figure 1.
Figure 1.. Spatial analysis of tumor NOS2/COX2 expression with respect to survival.
Spatial landscape of NOS2 (red) and COX2 (green) with DAPI (white), the tumor marker CK-SOX10 (blue) for patient A) Deceased and B) Alive 5yr at survival. C) quantification of NOS2/COX2 tumor expression at the single cell level. D) heat density maps of tumor NOS2/COX2 expression in Deceased and Alive patient tumors. E-F) Shows Pearson’s correlations between tumor NOS2 and COX2 expression R2 = 0.8481 and p<0.0001 in tumors from Deceased patients only.
Figure 2.
Figure 2.. Analysis of tumor NOS2/COX2 expression with respect to CD8+ T cells.
A) The ratio of NOS2s/CD8 and COX2/CD8 expression in total and CD3+CD8+PD1 Teff cell populations. B) ER− breast cancer at 5yr survival stratified for NOS2/CD8 and COX2/CD8 ratios validation in GSE37751 breast cancer data from Genome Expression Omnibus (GEO) public data repository (https://www.ncbi.nlm.nih.gov/geo/info/download.html). The R software (version 4.2) was used to extract gene expression data from ER− samples for analysis of high (red) vs low (black) NOS2/CD8a and COX2/CD8a ratios dichotomized at the median. The survival data were exported to PRISM (version 9) and plotted for survival. Hazard ratios (HR) and p values were determined using Mantel-Haenszel and Gehan-Breslow-Wilcoxon test in PRISM software. C) Summarizes phenotype %Cell distributions in each tumor sample relative to survival. The dashed line denotes natural breaks in the data.
Figure 3.
Figure 3.. Spatial UMAP analysis for tumor NOS2/COX2 and CD8 expression.
Heat density map comparison for NOS2, COX2 and CD8 expression in tumors from A) Deceased and B) Alive patients. Spatial distribution plots based upon positive pixels for NOS2 (red), COX2 (green) and CD8 (magenta) expression are shown. C) A spatial UMAP tumor analysis of cellular neighborhoods identifies differential neighborhood classes (clusters, red circles) in Deceased vs Alive patient tumors. D) Table summarizes the %cluster composition by each phenotype in all tumors. E) A comparison of cluster prevalence in Deceased vs Alice patients showing differential occurrence in clusters 12 and 13 in Deceased vs Alive patient tumors. F-G) Plots of the average Fraction of cells of each phenotype as a function of distance from each cell within the clusters that reveal distinct spatial distributions or density profiles of each phenotype. H) The ratio of phenotype density profiles for clusters 13 and 12 shown in panels F and G demonstrates the predictive value of CD8NOS2+COX2+ and CD8+NOS2COX2 phenotypes due to their vast differences in Deceased vs Alive patient tumors. I) A spatial dot plot and nearest neighbor analysis at 50 μm distances of phenotypes with predictive value shown in panel H. J) Multiplex immunofluorescence of CD8 (magenta) NOS2 (red) and COX2 (green) expression in areas of interest (red square boxes) in the spatial dot plot shown in panel I. K) Enhanced magnification of areas of interest (yellow boxes) in panel J showing CD8NOS2COX2+ (immune desert, top) and metastatic niche associated with CD8NOS2+COX2+ (inflamed region, bottom) phenotypes.
Figure 4.
Figure 4.. Defined CD8 NOS2 and COX2 spatial landscape.
Five basic regions showing A) margin or stroma restricted lymphoid aggregates (orange circles) where a gap of 50 μm (double orange arrow) between CD3+ T cells aggregates and the tumor edge (green circle) was observed. Blue circles identify immune desert regions lacking CD8+ T cells. B) Tumor fragmentation or satellite region. C) Tumor edge with proximal stroma regions. Significant differences in %cell composition are shown for D) CD8+ T cells as well as E) NOS2+ and F) COX2+ tumor cells. G) Graphic summary of tumor NOS2/COX2 landscape and CD8+ T cell regional distributions with respect to Tumor-Stroma interface. H) Spatial architecture of predictive phenotypes in Deceased vs Alive patient tumors.
Figure 5.
Figure 5.. Spatial landscape of CD44v6 and EpCAM expression relative to tumor NOS2/COX2 expression and survival.
A) Enriched regions showing spatially distinct CD44v6 and EpCAM expression. B) Quantification of CD44v6 and EpCAM as well as ratios of NOS2/COX2 to CD44v6/EpCAM, respectively, in Deceased vs Alive tumors. Significance was determined using Mann Whitney test where * P < 0.05 and ** P = 0.007. C) Pearson’s correlation coefficient showing significant associations between NOS2/COX2 and CD44v6 expression in Deceased vs. Alive patient tumors. D) Pearson’s correlation coefficient showing significant associations between T effector cell or IFNγ and EpCAM expression in Deceased vs. Alive patient tumors. E) Spatial landscape of CD44v6 and EpCAM expression in different annotated regions.
Figure 6.
Figure 6.. S-UMAP and regional annotations to identify cellular neighborhoods of interest with respect to the tumor cancer stem cell markers EpCAM and CD44v6.
A) Unsupervised analysis of S-UMAP highlighting specific magnified regions; red box showing CD8NOS2+COX2+ phenotype in stroma restricted inflamed region; orange and blue boxes showing CD8NOS2COX2+ phenotypes in immune desert regions. B) Supervised analysis showing regions containing tumor satellites, tumor core, NOS2+ edge, lymphoid aggregates, and NOS2 edge.
Figure 7.
Figure 7.. Metastatic niche showing invasive tumor edge proximal to lymphoid aggregates.
A) Shows the composition of tumor marker CK-SOX10 (blue), NOS2 (red), COX2 (green) and CD8 (magenta). B) Shows the CK-SOX10 tumor marker alone relative to CD8+ T cell aggregate. C) DAPI with CD8 expression.

Similar articles

References

    1. Bauer KR, Brown M, Cress RD, Parise CA, and Caggiano V. Descriptive analysis of estrogen receptor (ER)-negative, progesterone receptor (PR)-negative, and HER2-negative invasive breast cancer, the so-called triple-negative phenotype: a population-based study from the California cancer Registry. Cancer. 2007;109(9):1721-8. - PubMed
    1. Basudhar D, Glynn SA, Greer M, Somasundaram V, No JH, Scheiblin DA, et al. Coexpression of NOS2 and COX2 accelerates tumor growth and reduces survival in estrogen receptor-negative breast cancer. Proc Natl Acad Sci U S A. 2017. - PMC - PubMed
    1. Heinecke JL, Ridnour LA, Cheng RY, Switzer CH, Lizardo MM, Khanna C, et al. Tumor microenvironment-based feed-forward regulation of NOS2 in breast cancer progression. Proceedings of the National Academy of Sciences of the United States of America. 2014. - PMC - PubMed
    1. Glynn SA, Boersma BJ, Dorsey TH, Yi M, Yfan s HG, Ridnour LA, et al. Increased NOS2 predicts poor survival in estrogen receptor-negative breast cancer patients. J Clin Invest. 2010;120(11):3843-54. - PMC - PubMed
    1. Bates JP, Derakhshandeh R, Jones L, and Webb TJ. Mechanisms of immune evasion in breast cancer. BMC Cancer. 2018;18(1):556. - PMC - PubMed

Publication types