[Preprint]. 2025 Jan 25:2023.12.22.573117.
doi: 10.1101/2023.12.22.573117.

Visualizing PIEZO1 Localization and Activity in hiPSC-Derived Single Cells and Organoids with HaloTag Technology

Affiliations

Visualizing PIEZO1 Localization and Activity in hiPSC-Derived Single Cells and Organoids with HaloTag Technology

Gabriella A Bertaccini et al. bioRxiv. .

Update in

Abstract

PIEZO1 is critical to numerous physiological processes, transducing diverse mechanical stimuli into electrical and chemical signals. Recent studies underscore the importance of visualizing endogenous PIEZO1 activity and localization to understand its functional roles. To enable physiologically and clinically relevant studies on human PIEZO1, we genetically engineered human induced pluripotent stem cells (hiPSCs) to express a HaloTag fused to endogenous PIEZO1. Combined with advanced imaging, our chemogenetic platform allows precise visualization of PIEZO1 localization dynamics in various cell types. Furthermore, the PIEZO1-HaloTag hiPSC technology facilitates the non-invasive monitoring of channel activity across diverse cell types using Ca2+-sensitive HaloTag ligands, achieving temporal resolution approaching that of patch clamp electrophysiology. Finally, we used lightsheet imaging of hiPSC-derived neural organoids to achieve molecular scale imaging of PIEZO1 in three-dimensional tissue organoids. Our advances offer a novel platform for studying PIEZO1 mechanotransduction in human cells and tissues, with potential for elucidating disease mechanisms and targeted therapeutic development.


Figures

Figure 1.
Figure 1.. Generation and validation of the PIEZO1-HaloTag hiPSC line.
A. Flowchart illustrating PIEZO1-HaloTag CRISPR knock-in in WTC-11 hiPSCs; multiple human cell types differentiated from the PIEZO1-HaloTag hiPSC line; and subsequent HaloTag-ligand probe labeling and imaging. B. Structural schematic of the trimeric PIEZO1 channel (Dark blue, PDB: 5Z10) with HaloTag (Cyan, PDB: 5UY1) attached to the cytosolic C-terminus. Dashed grey lines highlight the linker sequence (G-S-G-A-G-A) between PIEZO1 and HaloTag. C. Representative traces of cell-attached patch clamp measurements with mechanical stimulation imparted through negative suction pulses for endothelial cells derived from WTC-11, PIEZO1 KO, and PIEZO1-HaloTag hiPSCs. Blue color gradient indicates strength of negative pressure steps associated with suction pulses (light blue: lowest pressure, darkest blue: highest pressure). D. Maximal suction-evoked current amplitudes recorded in each condition from 5 independent experiments. All values are expressed as mean ± SEM (WTC-11 mean: −71 ± 12.1 pA, n = 21; PIEZO1 KO mean: −10.6 ± 7.5 pA, n = 17; PIEZO1-HaloTag mean: −60.8 ± 13.4 pA, n = 24) (*** p-value < 0.005). Cohen’s d effect sizes are −1.31 for PIEZO1 KO and as compared to WT. WTC-11 and PIEZO1-HaloTag did not show a statistically significant difference (p-value = 0.58) E. TIRF images, representative of 3 independent experiments, of a wild-type WTC-11 hiPSC without the Halo Tag introduced (left); PIEZO1-HaloTag hiPSC labeled with JF646 HTL (middle); and a PIEZO1-HaloTag Knockout hiPSC (right) showing lack of punctate labeling with the HaloTag ligand. F. TIRF images, representative of 3 independent experiments, of differentiated PIEZO1-HaloTag endothelial cell, keratinocyte, and neural stem cell labeled with JF646 HTL.See also Supplemental Figs. 1, 2, and 3 and Supplemental Videos 1, 2, and 3.
Figure 2.
Figure 2.. PIEZO1-HaloTag localization and tracking reveal populations of PIEZO1 with different motilities.
A. PIEZO1-HaloTag puncta are brighter and bleach slower than PIEZO1-tdTomato puncta. TIRF image series of PIEZO1-HaloTag and PIEZO1-tdTomato endothelial cells were acquired for 2 minutes with identical acquisition settings (see Methods). Red trace indicates the average integrated intensity of PIEZO1-HaloTag (n = 19 videos from 3 independent experiments) and grey trace indicates the average integrated intensity of PIEZO1-tdTomato (n = 20 videos from 3 independent experiments). The signals are scaled to the number of puncta in the first frame for each video. Black dashed curves represent exponential fits to the data with τHT = 38.1 ± 0.15 s and τtdT = 21.5 ± 0.13 s (p-value Mann-Whitney < 0.005 and the Cohen’s d value= −2.73). B. Distributions of localization errors, calculated as the deviation from the mean position of a trajectory, for trajectories extracted from PIEZO1-HaloTag endothelial cells labeled with JF549 HTL and PIEZO1-tdTomato mouse embryonic fibroblasts. Cells in each condition were imaged with identical acquisition settings. C. A migrating PIEZO1-HaloTag NSC imaged for 2 minutes with a frame rate of 10 fps. The cell is labeled with JF646 HTL. Top row shows the entire cell (Full FOV) and the bottom row shows a zoom-in of the inset box (red) on the rear of the cell. Note the channel enrichment at the rear of the cell throughout the 2-minute recording. D. Schematic depicting super-resolution localization, point linking, and tracking of PIEZO1-HaloTag channels labeled with JF646 HTL. Examples show two observed puncta motility behaviors: mobile (magenta) and immobile (cyan). E. Representative trajectories from 11 immobile and 11 mobile puncta. Starting positions of trajectories are scaled to the origin, with different trajectories indicated by color. F. Cumulative distribution functions (CDF) of Single Lag Displacements (SLD). Black dotted curve shows experimental data. Grey curve is a single-component exponential fit. Red curve is a two-component exponential fit. Residuals for single-component (grey) and two-component (red) fits are shown in the inset plot. G. Distribution of trajectory path lengths at 5 s (50 frames) derived from PIEZO1-HaloTag endothelial cells labeled with JF646 HTL imaged after fixation (number of tracks = 14,943 from 13 videos). Dashed red line indicates the 3 μm cutoff criterion used to define immobile trajectories. H. Corresponding distribution of trajectory path lengths for tracks at 5 s derived from live PIEZO1-HaloTag endothelial cells labeled with JF646 HTL (number of tracks = 889,971 from 40 videos). Grey curve represents a fit to a sum of two Gaussian curves; the individual Gaussian curves are shown in cyan and magenta. Dashed red line indicates cutoff to discriminate mobile and immobile trajectories I. Mean squared displacement (MSD) of immobile (cyan) and mobile puncta (magenta). Tracks that had a path length > 3 μm were characterized as mobile (magenta) and tracks which had a path length < 3 μm were characterized as immobile (cyan) in the Gaussian curve. Each gray trace represents mean MSD for all mobile puncta in a video (upper traces) and for all immobile puncta in a video (lower traces); data from 39 videos are plotted. Solid magenta (mobile) and cyan (immobile) curves are mean MSD curves across all videos. Solid black line is a linear fit to the initial MSD t < 2 s, dashed black line shows a linear extrapolation. All values are expressed as mean ± SEM. Data for panels E-I are from 4 independent experiments. See also Supplemental Video 4.
Figure 3.
Figure 3.. PIEZO1-HaloTag enables imaging of endogenous PIEZO1 activity with temporal resolution approaching that of patch-clamp electrophysiology.
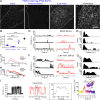
A. TIRF images of endothelial cells differentiated from i. PIEZO1-HaloTag and ii. PIEZO1-HaloTag Knockout lines. iii. PIEZO1-HaloTag treated with 2 μM Yoda1 samples. i-iii are all labeled with the Ca2+-sensitive HaloTag Ligand JF646-BAPTA HTL. iv. shows a PIEZO1-HaloTag endothelial cell labeled with the non-Ca2+-sensitive HaloTag Ligand JF646 HTL. B. Puncta densities with labeling by JF646-BAPTA HTL (blue) and JF646 (black). All values are expressed as mean ± SEM density of puncta per μm. JF646-BAPTA HTL; Basal, 0.07 ± 0.004; PIEZO1-HaloTag KO, 0.02 ± 0.002; 2 μM Yoda 1, 0.22± 0.02; JF646 HTL, 0.34± 0.01. Data are from 4 independent experiments. All groups were significantly different from one another (*** p-value Mann-Whitney < 0.005 for all conditions). Cohen’s d effect sizes of PIEZO1-HaloTag treated with 2 μM Yoda1 compared to PIEZO1-HaloTag (2.28) and of PIEZO1-HaloTag Knockout compared to PIEZO1-HaloTag (−4.46). C. Average histogram of JF646-BAPTA puncta intensity in the bright state across every frame in 32 untreated, 12 DMSO, and 13 2 μM Yoda1 videos from 3 independent experiments. D. Representative background-subtracted fluorescence intensity traces of immobile PIEZO1-HaloTag puncta from TIRF imaging of hiPSC-derived endothelial cells labeled with the Ca2+-sensitive HaloTag Ligand JF646-BAPTA HTL and treated with vehicle control, DMSO. Right, expanded traces corresponding to the red line marked on the left. E. Allpoints amplitude histograms of intensity levels from the 30 s traces in C. Counts are shown on a log10 scale. F. Representative traces, as in C, of puncta from PIEZO1-HaloTag endothelial cells treated with 2 μM Yoda1. G. An all-points amplitude histogram of intensities from the 30 s traces in F. H. An average all-points amplitude histogram (i.e. including dark and bright states) from 21 immobile puncta representing 3 independent experiments of each condition (untreated, DMSO-treated or treated with 2 μM Yoda1) of PIEZO1-HaloTag JF646-BAPTA labeled ECs. The Yoda1 distribution was significantly different from both the Untreated and DMSO distributions, using a Two-Sample Kolmogorov-Smirnov test (p < 0.001). For individual fluorescence traces and all-points amplitude histogram of each punctum, please see Supplemental Fig. 8–10. I. Representative trace of a JF646-BAPTA HTL labeled immobile PIEZO1-HaloTag punctum imaged using TIRF at a frame rate of 500 fps. Other details are the same as in panels D and F. Note the improved temporal resolution of PIEZO1-mediated Ca2+ signals illustrated by the progressively expanded traces on the right. J. Representative trajectory and fluorescence intensity profile of a mobile punctum labeled with JF 646-BAPTA. The inset Cartesian coordinate plot illustrates the trajectory with the starting position normalized to the origin, and time depicted by progressively cooler colors. The graph shows the corresponding background-subtracted fluorescence intensity trace. Data for panels D - G are from 3 independent experiments. See also Supplemental Figs. 8, 9, and 10 and Supplemental Videos 7, 8, and 9.
Figure 4.
Figure 4.. PIEZO1 activity monitored in endothelial and neural stem cells.
A. Representative TIRF images of PIEZO1-HaloTag ECs and NSCs labeled with JF646-BAPTA HTL. B. JF646-BAPTA HTL puncta density in ECs (mean = 0.23 ± 0.02 puncta per μm2) and NSCs (mean = 0.13 ± 0.02 puncta per μm2). Each dot is representative of the puncta density in a cell (see Methods), n = 16 to 18 cells from 3 independent experiments. Means are indicated by black lines. The two groups were significantly different from one another, *** p-value Mann-Whitney < 0.005. The Cohen’s d effect size was −1.20. C. Same as B, for JF646 HTL puncta density in ECs (mean = 0.45 ± 0.02 puncta per μm2) and NSCs (mean = 0.30 ± 0.02 puncta per μm2), n = 26 cells from 3 independent experiments, *** p-value Mann-Whitney < 0.0001. The Cohen’s d effect size was −1.21. D. Average histogram of puncta intensity from all detected (i.e. bright state) JF646-BAPTA puncta across every frame in EC and NSC videos, recorded at 500 fps over 10 seconds, from 3 independent experiments. E. Representative background-subtracted fluorescence intensity traces of immotile PIEZO1-HaloTag puncta from 500-fps TIRF imaging of EC (top) and NSC (bottom) labeled with JF646-BAPTA HTL. Right, expanded traces from the sections marked with a red line on the left. F. Corresponding all-points amplitude histograms of intensity levels from the 10-s traces in E. Counts are shown on a log10 scale. G. An average allpoints amplitude histogram from 46 immobile puncta representing 3 independent experiments of JF646-BAPTA-labeled PIEZO1-HaloTag ECs (black) and NSCs (red). The two distributions were significantly different from each other, using a Two-Sample Kolmogorov-Smirnov test (p < 0.01). For individual fluorescence traces and all-points amplitude histogram of each punctum, please see Supplemental Fig. 11–12.
Figure 5.
Figure 5.. Visualizing the spatial distribution and activity of PIEZO1-HaloTag puncta in micropatterned neural rosettes (MNRs).
A. Top and side view schematics of an MNR, illustrating cells organized radially around a central lumen. B. Schematic view on the left shows the confocal microscopy imaging plane parallel to the coverslip (in orange) in an MNR. Images show a representative confocal slice of a PIEZO1-HaloTag MNR labeled with JF646, fixed, and then stained with phalloidin (magenta), anti-N-cadherin antibody (yellow) and Hoechst (cyan). The section within the white square is shown zoomed in to the right for each channel. A gamma of 0.5 was applied on the zoomed-in actin image. Note the actin-rich regions at the lumen and outer edges, and the PIEZO1-HaloTag localization at the cell-cell interfaces. C. Schematic view on the left shows the orientation of the lattice light-sheet microscopy imaging plane in MNRs. Images on left show representative volumetric rendering of an actin-labeled MNR showing top-down and side views. The middle image panel shows a representative 2-μm slab projection of actin (orange) with JF635-labeled PIEZO1-HaloTag detections (cyan) and two zoomed insets at far right. D. Representative maximum intensity projection (MIP) image of 3 optical planes acquired 215 nm apart of an MNR labeled with actin (left); the same image with the lumen and outer edge masks marked for analysis (middle); and PIEZO1-HaloTag labeled with JF635 HTL (right). E. Density scatter plot of distances of JF635 HTL labeled puncta localizations to the lumen edge mask (x axis) and to the outer edge mask (y axis) of the MNR (n = 103 videos from 21 MNRs from 4 experiments). The color scale indicates the relative density of puncta at each position in the scatter plot, scaled to the total number of puncta represented in the plot. Note the enrichment of PIEZO1 channels near the lumen edge mask (red cluster). Density scatter plots for each individual MNR sample can be found in Supplemental Fig. 16. F. Top: Representative MIPs from 3-plane stacks of actin and of Ca2+-sensitive JF646-BAPTA labeled PIEZO1-HaloTag puncta in an MNR. Note how puncta along the blue line in the right panel localize with actin along the orange line in the left panel. The blue line in the PIEZO1-HaloTag panel indicates the region of interest used to generate the kymograph at the bottom. Note the flickering behavior of BAPTA-labeled puncta, indicating fluctuations in channel activity levels. G. Density scatter plot of distances of JF646-BAPTA HTL labeled active PIEZO1-HaloTag puncta localizations to the lumen edge mask (X axis) and to the outer edge mask (Y axis) of the MNR (n = 39 videos from 12 MNRs from 3 experiments). The color scale indicates the relative density of puncta at each position in the scatter plot, scaled to the total number of puncta represented in the plot. Active channels localize primarily near the actin-rich lumen, with a smaller cluster near the actin-rich outer edge of the MNR. Density scatter plots for each individual JF646-BAPTA HTL sample can be found in Supplemental Fig. 19. See also Supplemental Figs. 17, 18, 20, and 21 and Supplemental Video 10.

References

    1. Coste B. et al. Piezo1 and Piezo2 are essential components of distinct mechanically activated cation channels. Science 330, 55–60 (2010). - PMC - PubMed
    1. Murthy S. E., Dubin A. E. & Patapoutian A. Piezos thrive under pressure: mechanically activated ion channels in health and disease. Nat. Rev. Mol. Cell Biol. 18, 771–783 (2017). - PubMed
    1. Ranade S. S. et al. Piezo1, a mechanically activated ion channel, is required for vascular development in mice. Proc. Natl. Acad. Sci. U. S. A. 111, 10347–10352 (2014). - PMC - PubMed
    1. Li J. et al. Piezo1 integration of vascular architecture with physiological force. Nature 515, 279–282 (2014). - PMC - PubMed
    1. Rode B. et al. Piezo1 channels sense whole body physical activity to reset cardiovascular homeostasis and enhance performance. Nat. Commun. 8, 1–11 (2017). - PMC - PubMed

Publication types