[Preprint]. 2024 Mar 13:2023.12.20.572662.
doi: 10.1101/2023.12.20.572662.

AlphaFold2 structures template ligand discovery

Affiliations

AlphaFold2 structures template ligand discovery

Jiankun Lyu et al. bioRxiv. .

Update in

  • AlphaFold2 structures guide prospective ligand discovery.
    Lyu J, Kapolka N, Gumpper R, Alon A, Wang L, Jain MK, Barros-Álvarez X, Sakamoto K, Kim Y, DiBerto J, Kim K, Glenn IS, Tummino TA, Huang S, Irwin JJ, Tarkhanova OO, Moroz Y, Skiniotis G, Kruse AC, Shoichet BK, Roth BL. Lyu J, et al. Science. 2024 Jun 21;384(6702):eadn6354. doi: 10.1126/science.adn6354. Epub 2024 Jun 21. Science. 2024. PMID: 38753765 Free PMC article.

Abstract

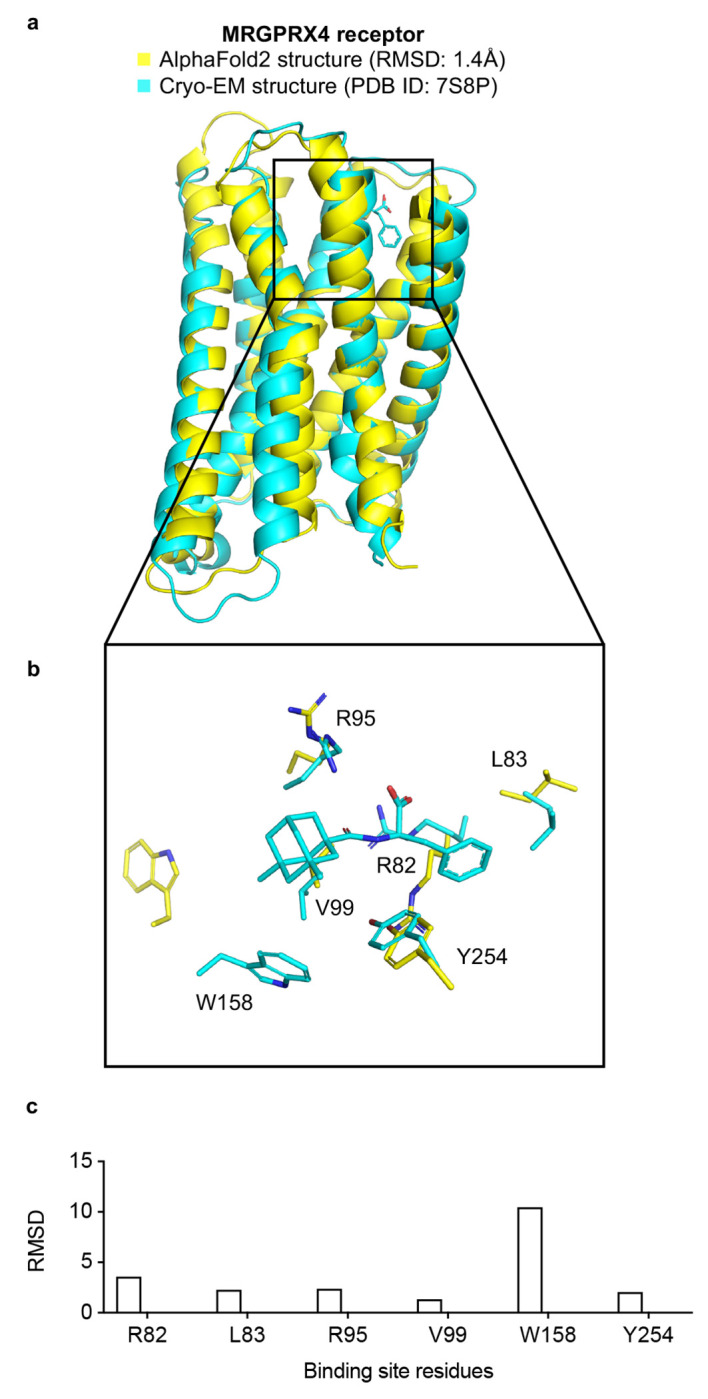
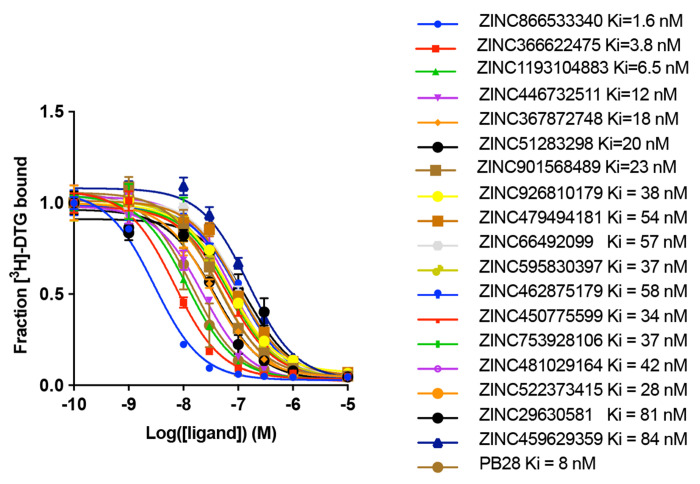
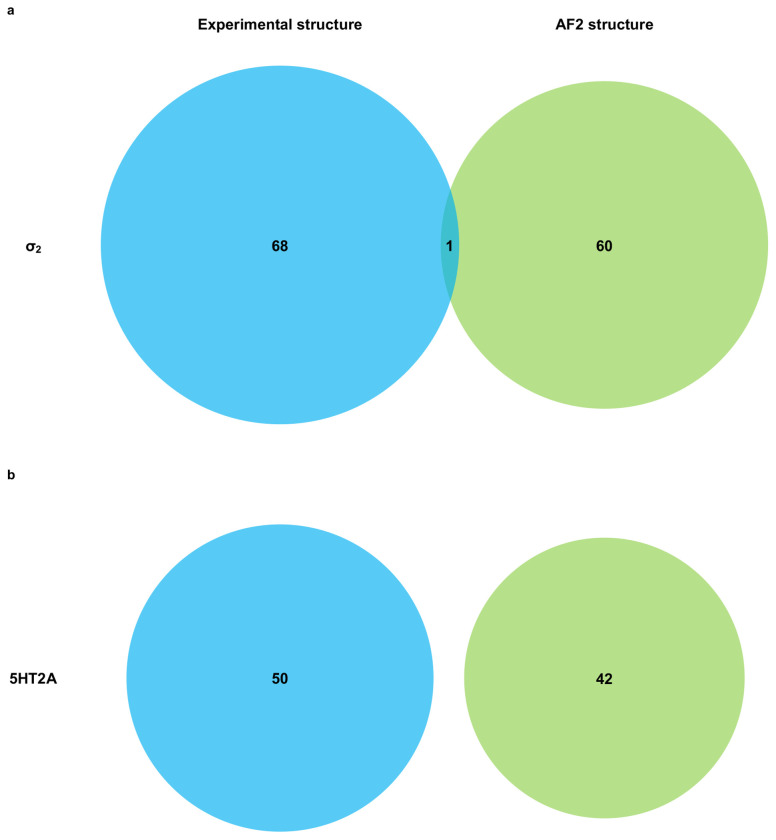
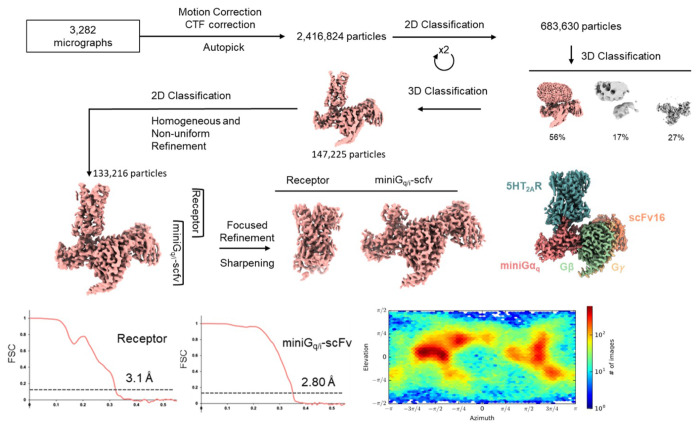
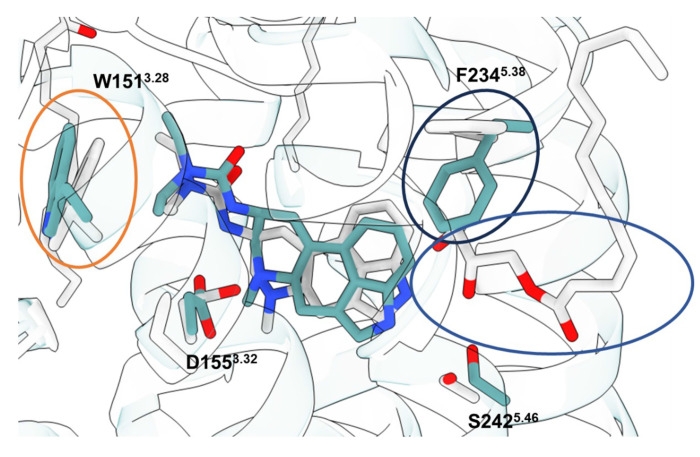
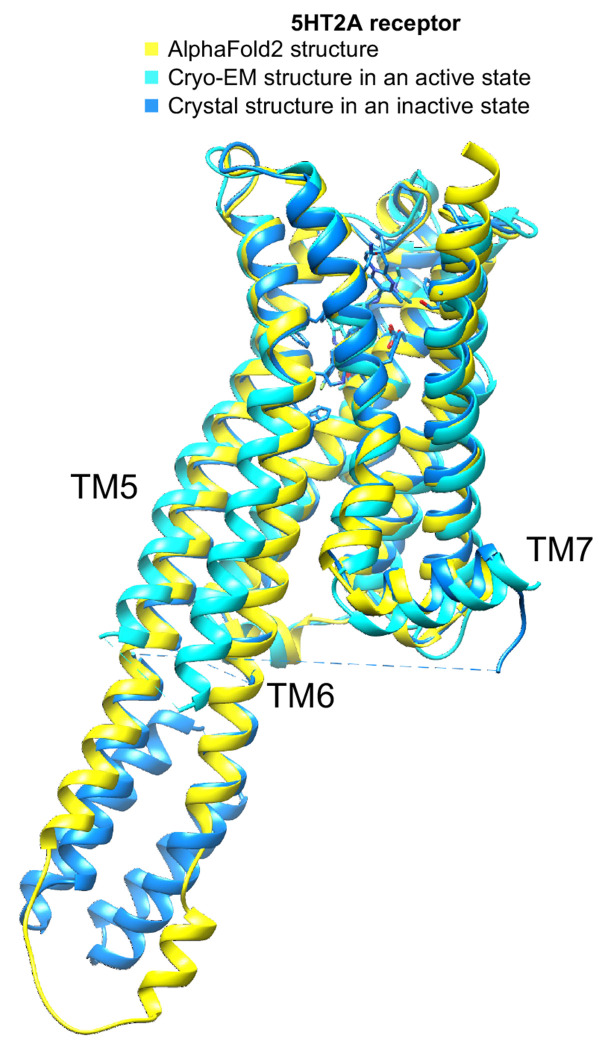
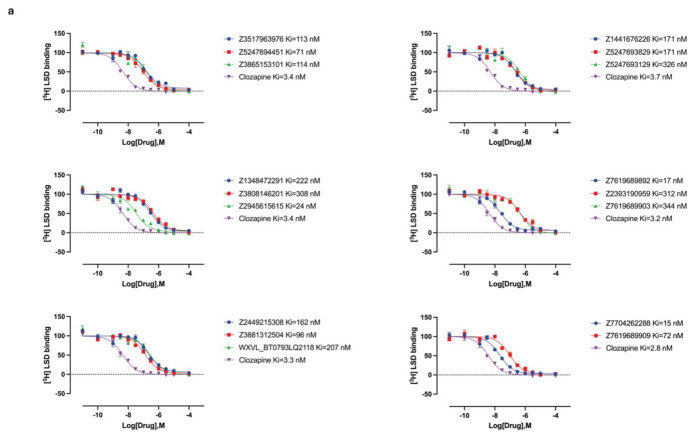
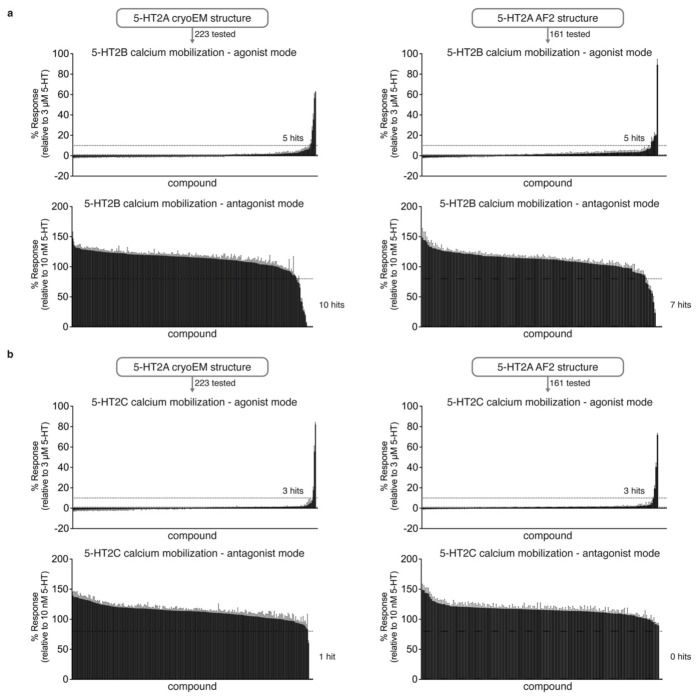
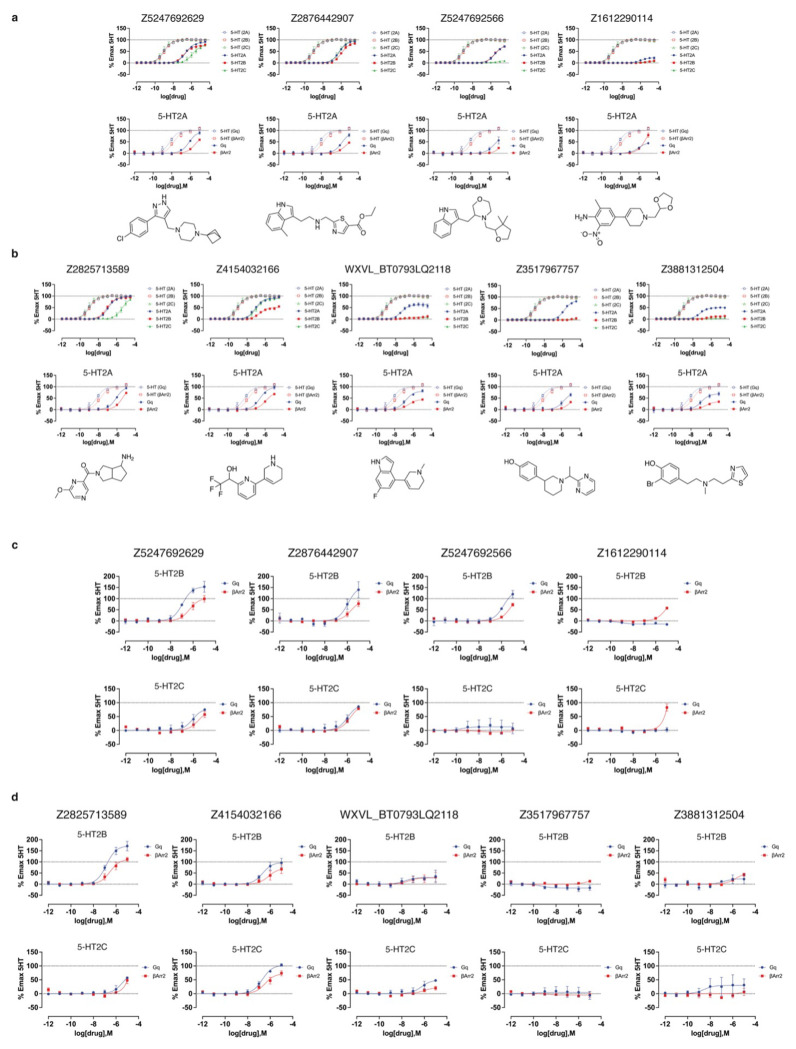
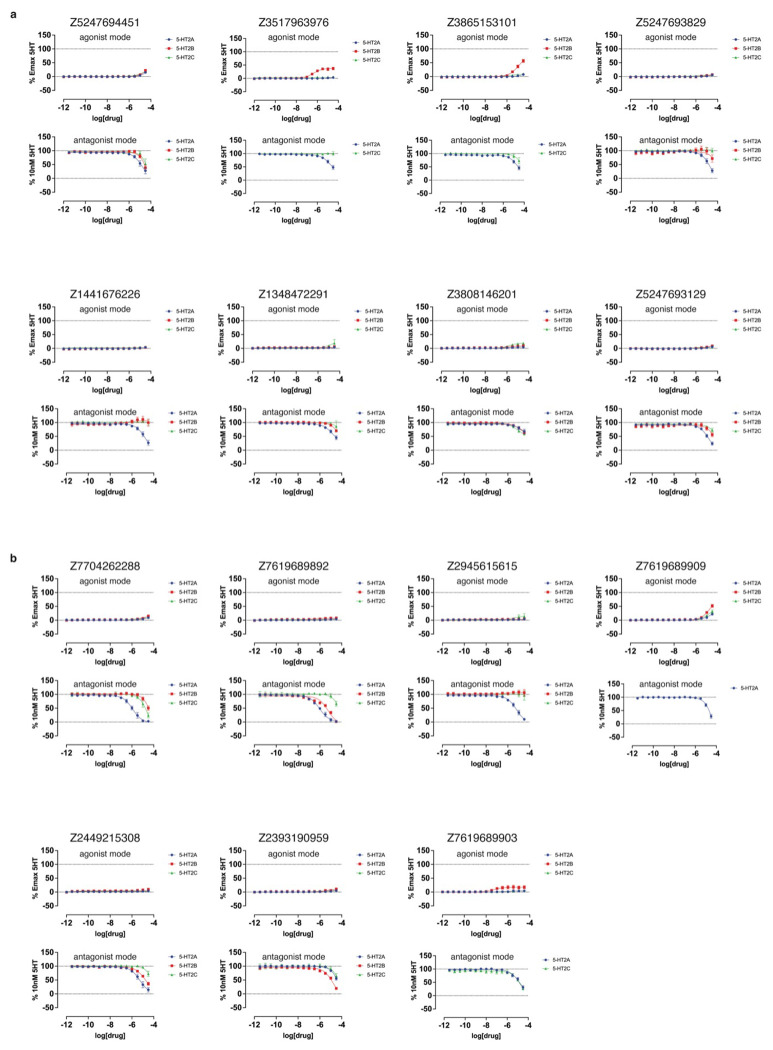
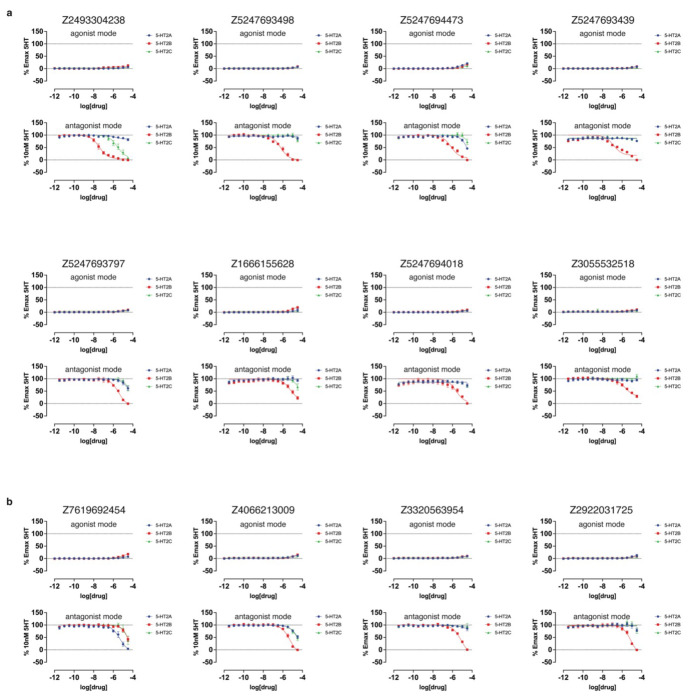
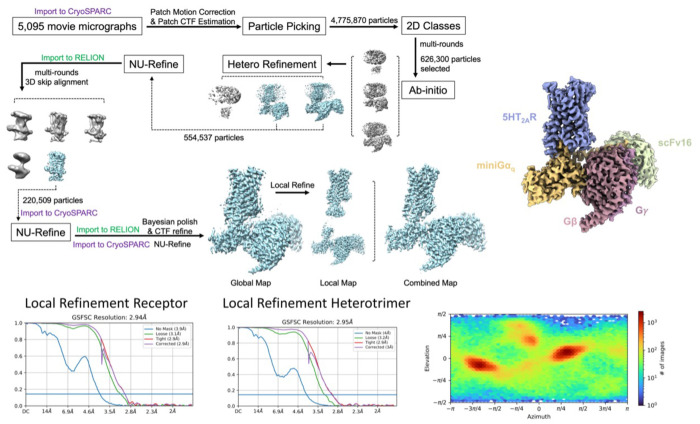
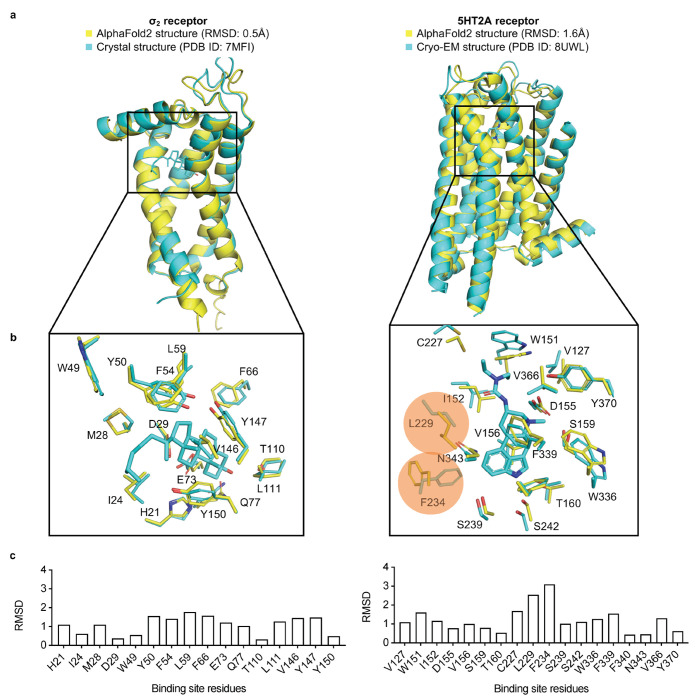
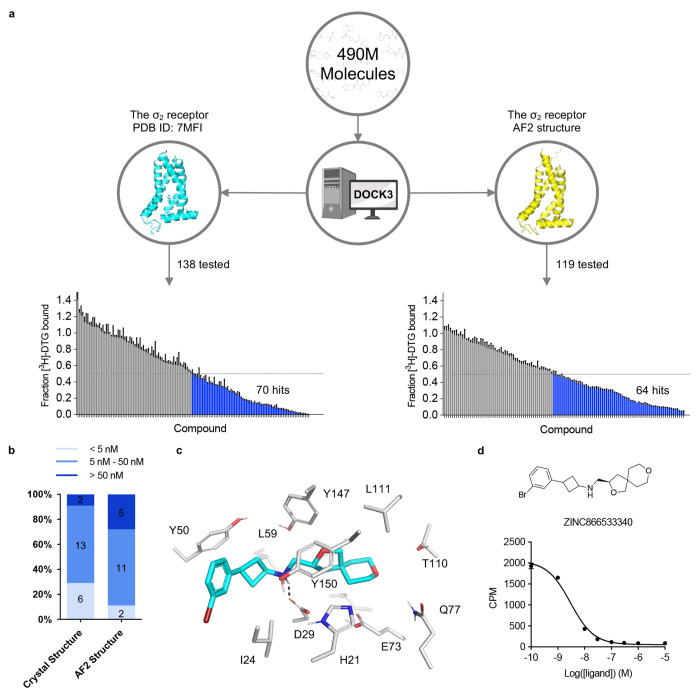
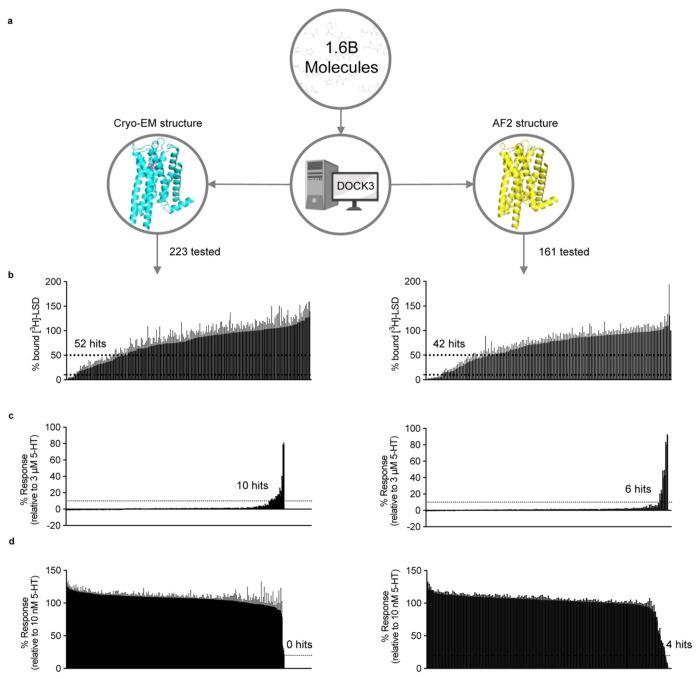
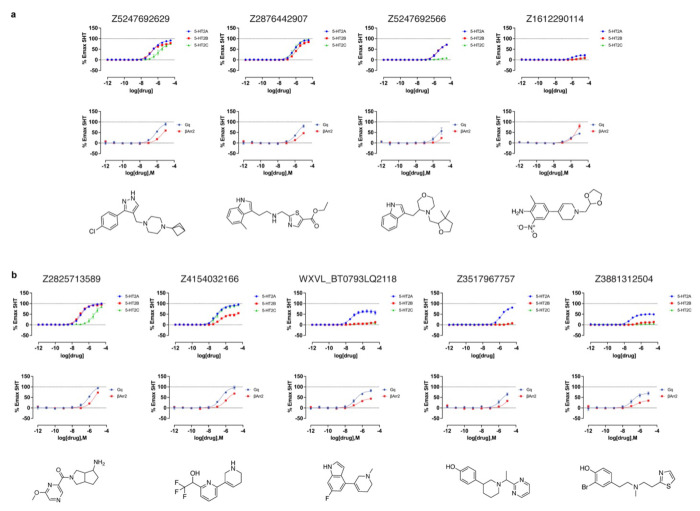
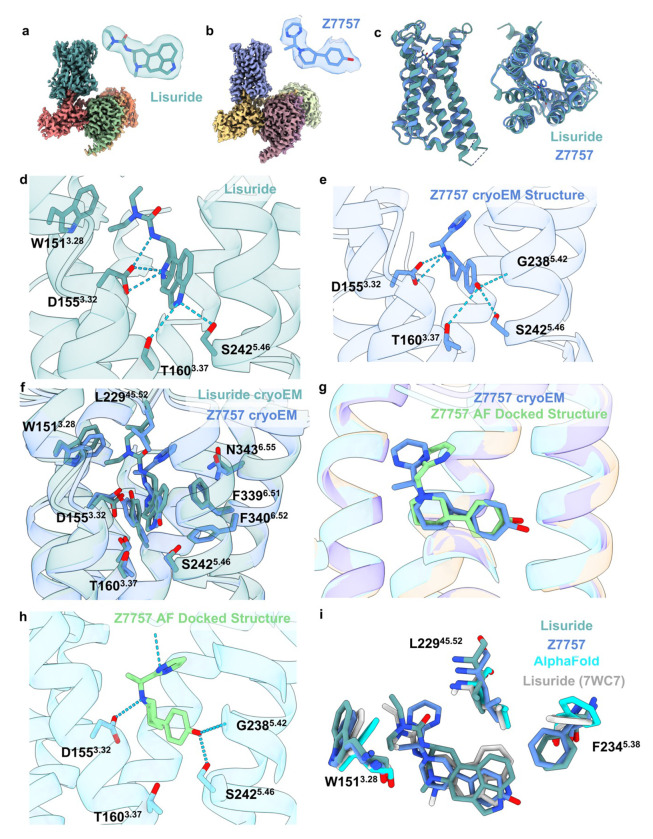
AlphaFold2 (AF2) and RosettaFold have greatly expanded the number of structures available for structure-based ligand discovery, even though retrospective studies have cast doubt on their direct usefulness for that goal. Here, we tested unrefined AF2 models prospectively, comparing experimental hit-rates and affinities from large library docking against AF2 models vs the same screens targeting experimental structures of the same receptors. In retrospective docking screens against the σ2 and the 5-HT2A receptors, the AF2 structures struggled to recapitulate ligands that we had previously found docking against the receptors' experimental structures, consistent with published results. Prospective large library docking against the AF2 models, however, yielded similar hit rates for both receptors versus docking against experimentally-derived structures; hundreds of molecules were prioritized and tested against each model and each structure of each receptor. The success of the AF2 models was achieved despite differences in orthosteric pocket residue conformations for both targets versus the experimental structures. Intriguingly, against the 5-HT2A receptor the most potent, subtype-selective agonists were discovered via docking against the AF2 model, not the experimental structure. To understand this from a molecular perspective, a cryoEM structure was determined for one of the more potent and selective ligands to emerge from docking against the AF2 model of the 5-HT2A receptor. Our findings suggest that AF2 models may sample conformations that are relevant for ligand discovery, much extending the domain of applicability of structure-based ligand discovery.


Conflict of interest statement

Competing interests B.K.S. is co-founder of BlueDolphin, LLC, Epiodyne, and Deep Apple Therapeutics, Inc., serves on the SRB of Genentech, the SAB of Schrodinger LLC and of Vilya Therapeutics, and consults for Levator Therapeutics, Hyku Therapeutics, and for Great Point Ventures. J.J.I. cofounded Deep Apple Therapeutics, Inc., and BlueDolphin, LLC. B.L.R is a co-founder of Epiodyne and Onsero and on the SAB for Onsero, Epiodyne, Levator, Escient and Septerna. A.C.K. is a cofounder and consultant for biotechnology companies Tectonic Therapeutic and Seismic Therapeutic, and also for the Institute for Protein Innovation, a nonprofit research institute. X.B.A is now a senior scientist at Tectonic Therapeutics

Figures

Extended Data Fig. 1 |
Extended Data Fig. 1 |. The MRGPRX4 receptor AF2 model is likely not a good candidate for docking.
a. The experimental structure (in cyan) is overlaid with the AF2 predicted structure (in yellow). The Root Mean Square Deviation (RMSD) value is calculated based on backbone atoms. The ligand binding site residues were selected within 4 Å distance from the ligand. b. The full-atom RMSD values of the binding site residues between the AF2 and the experimental structures.
Extended Data Fig. 2 |
Extended Data Fig. 2 |. Retrospective docking of known ligands against experimental structures (left column) outperforms that for AF2 structures (right column).
Panels a and b show log-transformed ROC plots that compare the rate of ligand identification versus property-matched decoys for the σ2 receptor and the 5-HT2A receptor, respectively. A random selection corresponds to the dashed black line. The area under this dashed line is subtracted from the reported LogAUC values. As a result, a curve above the line indicates a positive LogAUC, a curve below the line signifies a negative LogAUC, and a curve following the dashed line represents a LogAUC value of zero. In both instances, the overall LogAUC value is better when docking against experimental structures.
Extended Data Fig. 3 |
Extended Data Fig. 3 |. Competition binding curves for the top 18 hits from AF2 docking against the σ2 receptor.
The data represent the mean ± s.e.m. from three technical replicates.
Extended Data Fig. 4 |
Extended Data Fig. 4 |. Overlap of Bemis-Murcko scaffolds between hits from docking against experimental structures (blue) and hits from docking against AF2 structures (green).
Panels a and b display Venn diagrams showing scaffold overlap for hits from the σ2 receptor and the 5-HT2A receptor, respectively.
Extended Data Fig. 5 |
Extended Data Fig. 5 |. cryoEM processing Flow Lisuride.
Comprehensive processing flow for the lisuride structure. After 2D-classification and several rounds of 3D classification, a focused refinement was done on the receptor and mini-Gq heterotrimer/scFv16 separately. These were then combined in Chimera. FSC plots for the receptor and heterotrimer as well as an angular distribution plot are also shown.
Extended Data Fig. 6 |
Extended Data Fig. 6 |. Comparison of 5-HT2A lisuride cryoEM structure and crystal structure.
Overlay of the lisuride cryoEM structure solved in this work and the previously published 5-HT2A-lisuride crystal structure (PDB ID: 7WC7). There are some differences within the orthosteric pocket, but small shifts are noticed between the two structures. W151. (orange circle) shows a small shift inward, but also follows the slight shift of lisuride within the binding pocket. Additionally due to the penetration of a lipid moiety (blue circle) into the orthosteric pocket, F234. also was changed significantly (black circle). The pose found in the crystal structure more closely resembles the predicted structure from AF, indicating it may be sampling this space.
Extended Data Fig. 7 |
Extended Data Fig. 7 |. The overall AF2 structure of the 5-HT2A receptor used in this study leans more towards an inactive state.
The AF2, Cryo-EM structure in an active state (PDB ID: unpublished), and the crystal structure in an inactive state (PDB ID: 6A93) are depicted in a cartoon representation and are colored in yellow, cyan, and marine, respectively. The transmembrane helix TM6 from the AF2 structure aligns more closely with that of the crystal structure in its inactive state than with the Cryo-EM structure in its active state.
Extended Data Figure 8 |
Extended Data Figure 8 |. Competition binding curves for ligands that displace ≥ 90% [3H]-LSD at the 5-HT2A receptor.
These data represent the mean ± s.e.m. from three independent replicates.
Extended Data Figure 9 |
Extended Data Figure 9 |. Functional screening of the prioritized library against the 5-HT2B and 5-HT2C receptors.
Libraries from cryoEM (left) and AF2 (right) docking were screened at 3 μM in a calcium mobilization functional screen against the 5-HT2B (panel a) and 5-HT2C (panel b) receptors in agonist mode (top) or antagonist mode (bottom). Dashed lines indicate 10% maximal 5-HT response or 20% maximal clozapine response for agonists and antagonists, respectively. Data represent the mean ± s.e.m. from 3-4 biological replicates.
Extended Data Figure 10 |
Extended Data Figure 10 |. Signaling profiles of the top functional hits against the 5-HT2A, 5-HT2B, and 5-HT2C receptors.
a. Functional assays for the top agonists from the cryoEM docking campaign relative to 5-HT (open symbols and dotted lines). Calcium mobilization (top) against 5-HT2A (blue), 5-HT2B (red), and 5-HT2C (green) receptors. BRET assays (bottom) measuring Gαq protein dissociation (blue) or β-arrestin2 recruitment (red) at the 5-HT2A receptor. b. Functional assays for the top agonists from the AF2 docking campaign relative to 5-HT (open symbols and dotted lines). Calcium mobilization (top) against 5-HT2A (blue), 5-HT2B (red), and 5-HT2C (green) receptors. BRET assays (bottom) measuring Gαq protein dissociation (blue) or β-arrestin2 recruitment (red) at the 5-HT2A receptor. The chemical structure of each compound is displayed below its respective dose-response curve. c. BRET assays measuring Gαq protein dissociation (blue) or β-arrestin2 recruitment (red) for the top agonists from the cryoEM docking campaign for 5-HT2B (top) and 5-HT2C (bottom) receptors. d. BRET assays measuring Gαq protein dissociation (blue) or β-arrestin2 recruitment (red) for the top agonists from the AF2 docking campaign for 5-HT2B (top) and 5-HT2C (bottom) receptors. Data are normalized relative to 5-HT and presented as mean ± s.e.m. of three biological replicates.
Extended Data Figure 11.
Extended Data Figure 11.. Functional dose-response curves measuring calcium mobilization of compounds that displace ≥ 90% [3H]-LSD at the 5-HT2A receptor.
These compounds were tested at the 5-HT2A (blue), 5-HT2B (red), and 5-HT2C (green) receptors. a. Calcium mobilization assays performed in agonist mode (top) and antagonist mode (bottom) for compounds from the cryoEM docking set. b. Calcium mobilization assays performed in agonist mode (top) and antagonist mode (bottom) for compounds from the AF2 docking set. Data represent mean ± s.e.m. from three biological replicates.
Extended Data Figure 12.
Extended Data Figure 12.. Functional dose-response curves measuring calcium mobilization of compounds exhibiting antagonist activity across any of the three 5-HT2-type receptors.
These compounds were tested at the 5-HT2A (blue), 5-HT2B (red), and 5-HT2C (green) receptors. a. Calcium mobilization assays performed in agonist mode (top) and antagonist mode (bottom) for compounds from the cryoEM docking set. b. Calcium mobilization assays performed in agonist mode (top) and antagonist mode (bottom) for compounds from the AF2 docking set. Data represent mean ± s.e.m. from three biological replicates.
Extended Data Figure 13
Extended Data Figure 13. CryoEM Processing for Z7757.
Comprehensive processing flow for the Z7757 structure. After 2D-classification and several rounds of 3D classification in cryoSPARC, the particles were transferred to for no-alignment 3D-classification focused on the receptor. Once a good consensus set of particles was identified and a further NU-refinemnet carried out, Bayesian polishing was performed on the particle set. A focused refinement was done on the receptor and a consensus map generated using Chimera. FSC plots for the receptor and heterotrimer as well as an angular distribution plot are also shown.
Extended Data Figure 14
Extended Data Figure 14. Emerald Docking recapitulates Z7757 binding pose.
Shown in cornflower blue is the modeled binding pose of Z7757. The top 5 poses from Emerald, a docking algorithm that utilizes the cryoEM map as restraints, recapitulates the modeled binding pose. Below is a table of the top 5 scores output by Rosetta/Emerald.
Extended Data Figure 15
Extended Data Figure 15. Alignment of all known 5-HT2A Structures.
(a) All of the 5-HT2A structures were downloaded from the PDB and aligned via matchmaker in ChimeraX. Shown is the orthosteric pocket (and Z7757) with residues highlighted which showed the biggest differences between the two docking models. The structures are colored by method of determination AF2-model in cyan, cryoEM structures in cornflower blue, and crystal structures in grey. (b) Highlighted structural differences to show that a cryoEM structure can adopt the closed off pose of W151. exhibited by the AF2-model. Here the AF2-model is shown in cyan, Z7757 cryoEM structure is shown in cornflower blue, the Lisuride cryoEM structure is shown in dark purple, and the agonist R-69 (PDB: 7RAN) cryoEM structure is shown in salmon. (c) Showing that an antagonist crystal structure can also adopt the closed position of W151. exhibited by the AF2-model. Here the AF2-model is shown in cyan, Z7757 cryoEM structure is shown in cornflower blue, the Lisuride cryoEM structure is shown in dark purple, and the antagonist Zotepine (PDB: 6A94) cryoEM structure is shown in grey.
Figure 1 |
Figure 1 |. Structural comparisons of the σ2 receptor (left column) and the 5-HT2A receptor (right column) between the AlphaFold2 (AF2) predicted structure and the experimental structure.
a. The experimental structure (in cyan) is overlaid with the AF2 predicted structure (in yellow). The Root Mean Square Deviation (RMSD) value is calculated based on backbone atoms. The ligand binding site residues were selected within 5 Å distance from the ligand. b. The full-atom RMSD values of the binding site residues between the AF2 and the experimental structures. Two residues with large conformational differences between the AF2 and experimental structures used in docking, Leu229 and Phe234, are highlighted for the 5-HT2A receptor (right panel).
Figure 2 |
Figure 2 |. Comparison of prospective screens against the crystal and AF2 structures of the σ2 receptor.
a. The same 490 million molecules from ZINC20 were screened against both the crystal and AF2 structures of the σ2 receptor. From these, 138 molecules from the crystal docking campaign and 119 from the AF2 docking campaign were synthesized and tested in a radioligand displacement assay. The campaign involving the crystal structure has already been published. The left panel is replotted based on the previously published data set. Displacement of the radioligand [3H]-DTG by each tested molecule occurs at 1 μM (mean ± s.e.m. of three technical replicates). A dashed line indicates 50% radioligand displacement. Dots below the dashed line represent confirmed binders, which are colored in blue. b. The distribution of binding affinity levels among the hits from both the AF2 and crystal structure screens. We measured competition binding curves for the 21 top docking hits from the crystal structure screen and the 18 top hits from the AF2 structure screen. These hits are categorized into three affinity ranges: <5 nM; 5 nM–50 nM; and >50 nM. c. The docked poses of the best binder from the screen against the AF2 model. d. The competition binding curve of the best binder from c against the σ2 receptor. The data are represented as mean ± s.e.m. from three technical replicates.
Figure 3 |
Figure 3 |. Comparison of prospective screens against the cryoEM and AF2 structures of the 5-HT2A receptor.
a. The same set of 1.6 billion molecules from ZINC22 were docked against the cryoEM and AF2 structures of the 5-HT2A receptor. 223 molecules were prioritized from the cryoEM docking campaign (left) and 161 from the AF2 docking campaign (right). b. Displacement of the radioligand [3H]-LSD by each molecule at 10 μM (mean ± s.e.m. of three independent replicates). Dashed lines indicate 50% and 90% radioligand displacement respectively. c. The Ca2+ mobilization functional assay in agonist mode. Each compound was tested at a concentration of 3 μM. A dashed line indicates agonism equivalent to 10% 5-HT activity. Data are presented as mean ± s.e.m. from three biological replicates. d. The Ca2+ mobilization functional assay in antagonist mode. Each compound was tested at a concentration of 3 μM. A dashed line indicates antagonism equivalent to 20% clozapine activity. Data are presented as mean ± s.e.m. from three biological replicates.
Figure 4 |
Figure 4 |. Dose-response curves of the top agonists against 5-HT2A, 5-HT2B, and 5-HT2C.
Top agonists from both docking campaigns were tested at the 5-HT2A (blue), 5-HT2B (red), and 5-HT2C (green) receptors. a. Functional assays measuring calcium mobilization (top) and Gαq protein dissociation or β-arrestin2 recruitment (bottom) for the top4 agonists from the cryoEM docking campaign. b. Functional assays measuring calcium mobilization (top) and Gαq protein dissociation or β-arrestin2 recruitment (bottom) for the top5 agonists from the AF2 docking campaign. The chemical structure of each compound is displayed below its respective dose-response curve. Data are presented as mean ± s.e.m. of three biological replicates.
Figure 5.
Figure 5.. Structural Characterization of the 5-HT2A receptor in complex with Lisuride and Z7757.
Maps of Lisuride (a) and Z7757 (b) active state heterotrimers respectively. Models of the compounds built into the electron density are shown. (c) Overlay of the Lisuride and the Z7757 structures, which superpose to 0.78 Å Cα-RMSD. (d) Interactions between Lisuride and (e) between Z7757 and the receptor. (f) Overlay of Z7757 and Lisuride in the orthosteric pocket. (g) Comparison of the experimental Z7757 structure and the predicted structure from the AF2 docking screen. (h) Predicted interactions from the docked pose of Z7757 in the AF2 structure. (i) Aligned Lisuride cryoEM structure, AF2-model, Z7757 cryoEM structure, and the Lisuride crystal structure (7WC7) highlighting residues that showed the biggest difference between the AF2-model and Lisuride cryoEM structures and that were used in the docking studies.

References

    1. Sadybekov A. V. & Katritch V. Computational approaches streamlining drug discovery. Nature 616, 673–685 (2023). - PubMed
    1. Wang Y. et al. Structures of the entire human opioid receptor family. Cell 186, 413–427. e417 (2023). - PubMed
    1. Xu P. et al. Structural insights into the lipid and ligand regulation of serotonin receptors. Nature 592, 469–473 (2021). - PubMed
    1. Lyu J. et al. Ultra-large library docking for discovering new chemotypes. Nature 566, 224–229 (2019). - PMC - PubMed
    1. Stein R. M. et al. Virtual discovery of melatonin receptor ligands to modulate circadian rhythms. Nature 579, 609–614 (2020). - PMC - PubMed

Publication types