[Preprint]. 2023 Dec 22:2023.12.22.573057.
doi: 10.1101/2023.12.22.573057.

EGFR-dependent actomyosin patterning coordinates morphogenetic movements between tissues

Affiliations

EGFR-dependent actomyosin patterning coordinates morphogenetic movements between tissues

D Nathaniel Clarke et al. bioRxiv. .

Update in

Abstract

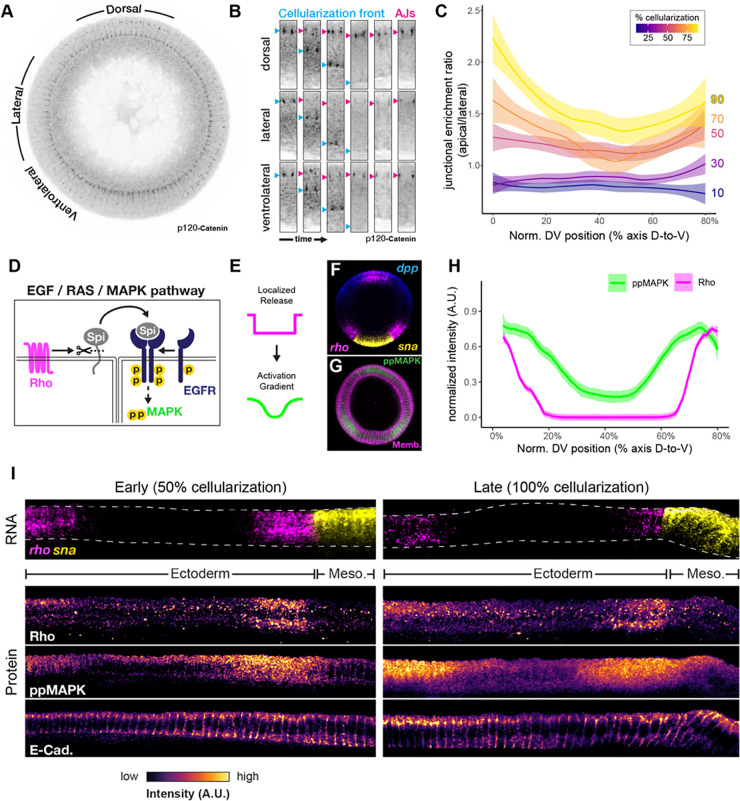
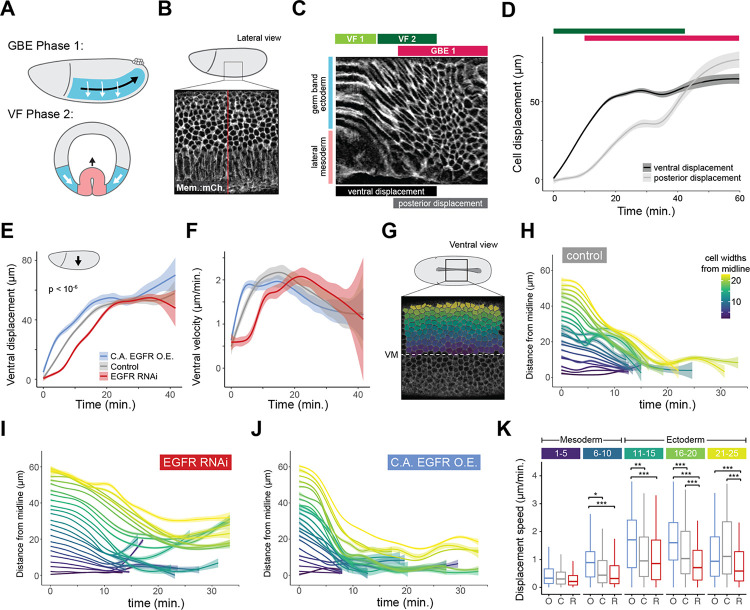
The movements that give rise to the body's structure are powered by cell shape changes and rearrangements that are coordinated at supracellular scales. How such cellular coordination arises and integrates different morphogenetic programs is unclear. Using quantitative imaging, we found a complex pattern of adherens junction (AJ) levels in the ectoderm prior to gastrulation onset in Drosophila. AJ intensity exhibited a double-sided gradient, with peaks at the dorsal midline and ventral neuroectoderm. We show that this dorsal-ventral AJ pattern is regulated by epidermal growth factor (EGF) signaling and that this signal is required for ectoderm cell movement during mesoderm invagination and axis extension. We identify AJ levels and junctional actomyosin as downstream effectors of EGFR signaling. Overall, our study demonstrates a mechanism of coordination between tissue folding and convergent extension that facilitates embryo-wide gastrulation movements.


Figures

Figure 1 -
Figure 1 -. AJ protein levels are patterned along the dorsal-ventral axis
(A,B) Schematic of the Adherens junction between two epithelial cells (A), and the Cadherin-Catenin Complex that comprises the functional core of the AJ (B). (C,D) Schematic of mesoderm invagination in the Drosophila embryo, viewed in whole-mount from a ventrolateral aspect (C) and in cross-section (D). Mesoderm is shown in green, and ectoderm in gray. (E) Representative cross-sectional view of a stage 5b embryo stained for p120-Catenin as a marker of the AJ, showing a two-sided gradient pattern from dorsal (top) to ventral (bottom) sides of the embryo. (F, F’) Unwrapped projection of p120-Catenin antibody staining from E (F), and a fluorescent in situ hybridization for mRNA of the same gene (F’). (G) Quantification of junctional enrichment (ratio of junctional intensity to lateral intensity) of p120-Catenin protein (orange, left axis), and total cytoplasmic p120-catenin mRNA levels (black, right axis). n=5 or more embryos; line represents mean junctional enrichment, plus or minus standard error. (H-K) Unwrapped projections of antibody stains for ⍺-Catenin (H), β-Catenin (I), E-Cadherin (J), and Neurotactin (K). (L) Quantification of junctional enrichment of AJ factors shown in H-J, in comparison to a general membranal marker. For all quantifications, n=5 or more embryos; line represents mean junctional enrichment, plus or minus standard error.
Figure 2 –
Figure 2 –. The AJ pattern arises during cellularization and correlates with zygotic EGF signaling activity
(A) Early stage 5 embryo stained for p120-Catenin. Dorsal-ventral regions shown in B are indicated. (B) Representative images of AJ formation in dorsal, lateral, and ventrolateral regions. Basal junctions (cyan arrows) move downwards into the yolk, and AJs (magenta arrows) form in a sub-apical position. (C) Quantification of DV junctional pattern of p120-Catenin over time during junction formation. Colors correspond to percent cellularization, a morphological proxy for time. n=3 or more embryos per stage; line represents mean junctional enrichment, plus or minus standard error. (D) EGF signaling pathway in the Drosophila embryo. The integral membrane protease, Rhomboid (magenta), cleaves the membrane-tethered ligand, Spitz (gray), which can act as a short-range morphogen to activate EGFR (blue) and downstream MAPK signaling (green). (E) Schematic of diffusion gradient model for Rho/ppMAPK signaling in the embryo. (F) Fluorescent in situ hybridization for rhomboid, the dorsally expressed morphgen dpp (BMP), and the mesoderm transcription factor, snail. (G) Antibody staining for di-phospho MAPK (green) and membrane (magenta). (H) Quantification of cytoplasmic intensity of rho mRNA expression (magenta) in comparison to di-phospho MAPK antibody staining. n=3 embryos; line represents mean junctional enrichment, plus or minus standard error. (I) Unwrapped projections of rho mRNA expression patterns in comparison to localization of translated Rho protein, ppMAPK staining, and E-Cadherin, at early (left) and late (right) stages.
Figure 3 –
Figure 3 –. Disruption of EGF signaling modulates the AJ protein gradient
(A-C) Representative unwrapped projections of anti-β-Catenin staining in EGFR zygotic null mutant (B), and EGFR RNAi knockdown (C) in comparison to control, (A). Cross-sectional view of anti-ppMAPK staining is shown at left to show EGF activation state. (D) Quantification of conditions shown in A-C. For all quantifications, n=5 or more embryos; line represents mean junctional enrichment, plus or minus standard error. (E-F) Representative unwrapped projections of anti-β-Catenin staining under EGF-activating conditions: over-expression of constitutively active EGFR (E), and ubiquitous expression of Rho (F) enrich AJ proteins at sub-apical junctions. (G) Quantification of conditions shown in E-F, and H. For all quantifications, n=5 or more embryos; line represents mean junctional enrichment, plus or minus standard error. (H) Representative unwrapped projection of anti-β-Catenin staining in embryos with ubiquitous over-expression of E-Cadherin.
Figure 4 –
Figure 4 –. Disruption of EGFR inhibits cell flow during gastrulation
(A) Schematic of temporally overlapping movements of Phase 1 of germ band extension (GBE) and Phase 2 of ventral furrow formation (VF). Ectoderm and mesoderm are shown in blue and pink, respectively. Arrows indicate approximate direction and speed of cell movement. (B) Schematic of lateral imaging strategy for confocal microscopy. Live imaging marker is ubiquitously expressed Gap43:mCherry. Red line indicates the line scan used to generate the kymograph in C. (C) Annotated kymograph of the GBE process, viewed from a ventrolateral aspect. Tissue regions (left), gastrulation phases (top), and cell movement patterns (bottom) are indicated. Time moves from left to right. (D) Quantification of ventral (black) and posterior (gray) cell displacements measured from cell tracking data of wildtype embryos. Bars at top indicate gastrulation phases. N=3 embryos. Line represents mean plus or minus standard deviation. (E-F) Quantification of ventral displacement (E) and velocity (F) over time in ventrolateral aspect movies of EGFR perturbation conditions (colors same as B). Significance calculated by Kruskal-Wallace test. N=3 embryos each. Lines represents mean plus or minus standard deviation. (G) Schematic of ventral imaging strategy for confocal microscopy. Color gradient overlay shows example cell segmentation and row-wise cell identification strategy used for quantifications. Live imaging marker is Gap43:mCherry. The ventral midline (VM) is indicated. (H-J) Row-wise quantification of cell displacement towards the ventral midline over time in control embryos (H) in comparison to EGFR RNAi knockdown (I) or constitutive EGFR over-expression (J). Colors correspond to cell row, with the mesoderm-ectoderm boundary in green. N = 3 embryos per condition. Lines represents mean plus or minus standard error. (K) Quantification of cell velocity towards the midline in binned cell rows. O, C, and R refer to EGFR over-expression, control, and EGFR RNAi, respectively.
Figure 5 –
Figure 5 –. Modulation of the AJ gradient alters cellular strain in cells adjacent to the folding mesoderm
(A-D) Cross-section series of fluorescent in situ hybridizations spanning the ventral furrow formation process. snail (sna, yellow) marks the mesoderm, and single-minded (sim, cyan) marks the mesectoderm boundary between mesoderm and ectoderm. Embryos are co-stained with anti-neurotactin antibody to show cell membranes. (E) Comparison of apical views of mid-stage 6 embryos (equivalent stage to C) of wildtype, or zygotic null egfr mutant genotypes. Staining is the same as in A-D, and the cell rows used for analysis in F are indicated. (F) Quantification of apical area aspect ratio versus distance from the mesectoderm for wildtype and egfr null embryos. (G) egfr zygotic null mutant embryos fail to fully internalize mesoderm. Embryo preparation is the same as in E, but at a later, post-folding stage. Count in upper right indicates number of embryos with sna-positive cells on the surface post-folding. (H) Representative live-cell timelapse in control and EGFR RNAi embryos, showing delayed displacement and increased apical area deformation in EGFR RNAi. (I) Quantification of area strain over time from live-cell tracking data. N = 3 embryos per condition. Lines represent mean plus or minus standard deviation.
Figure 6 –
Figure 6 –. AJ protein levels modulate actomyosin recruitment in the ectoderm
(A – B) Representative unwrapped projections showing patterns of F-Actin (A), and Myosin (B) distribution during pre-gastrulation (pre-fold) and mid-gastrulation (folding) timepoints. Snail (red) and ppMAPK (green) are shown in A to indicate the mesoderm, and zones of EGF activity, respectively. (C) Quantification of junctional F-Actin and Myosin intensity at pre- and mid-gastrulation timepoints, as shown in A. N=5 embryos. Line represents mean plus or minus standard error. (D) Representative unwrapped projections of endogenous Myo-II:mCherry fluorescence in embryos expressing constitutively active EGFR or EGFR RNAi, in comparison to control. (E) Quantification of junctional F-Actin and Myosin in the EGFR perturbations shown in D. N=5 embryos. Line represents mean plus or minus standard error. (F) en face views of endogenous Myo-II:mCherry fluorescence in embryos expressing constitutively active EGFR or EGFR RNAi, in comparison to control. (G) Quantification of junctional (left) and medial (right) Myo-II:mCherry intensity, as shown in F. Statistical significance determined by wilcox-n test, p < 0.05 = *; n = 6 embryos per condition. (H) Representative unwrapped projections showing patterns of anti-β-Catenin (top) and F-Actin (bottom) staining in embryos injected with either DMSO (black) or Cytochalsin D (red). (I) Quantification of junctional F-Actin and β-Catenin intensity, as shown in H. N=3 embryos. Line represents mean plus or minus standard error.

Similar articles

References

    1. Thompson D. (1917). On Growth and Form 1st ed. (Cambridge University Press; ).
    1. Hamant O., and Saunders T.E. (2020). Shaping Organs: Shared Structural Principles Across Kingdoms. Annu Rev Cell Dev Biol 36, 385–410. 10.1146/annurev-cellbio-012820-103850. - DOI - PubMed
    1. Heisenberg C.-P., and Bellaïche Y. (2013). Forces in tissue morphogenesis and patterning. Cell 153, 948–962. 10.1016/j.cell.2013.05.008. - DOI - PubMed
    1. Burda I., Martin A.C., Roeder A.H.K., and Collins M.A. (2023). The dynamics and biophysics of shape formation: Common themes in plant and animal morphogenesis. Dev Cell 58, 2850–2866. 10.1016/j.devcel.2023.11.003. - DOI - PMC - PubMed
    1. Leptin M. (2005). Gastrulation movements: the logic and the nuts and bolts. Dev Cell 8, 305–320. 10.1016/j.devcel.2005.02.007. - DOI - PubMed

Publication types