[Preprint]. 2023 Dec 20:2023.12.20.570481.
doi: 10.1101/2023.12.20.570481.

PRDM3/16 Regulate Chromatin Accessibility Required for NKX2-1 Mediated Alveolar Epithelial Differentiation and Function

Affiliations

PRDM3/16 Regulate Chromatin Accessibility Required for NKX2-1 Mediated Alveolar Epithelial Differentiation and Function

Hua He et al. bioRxiv. .

Update in

Abstract

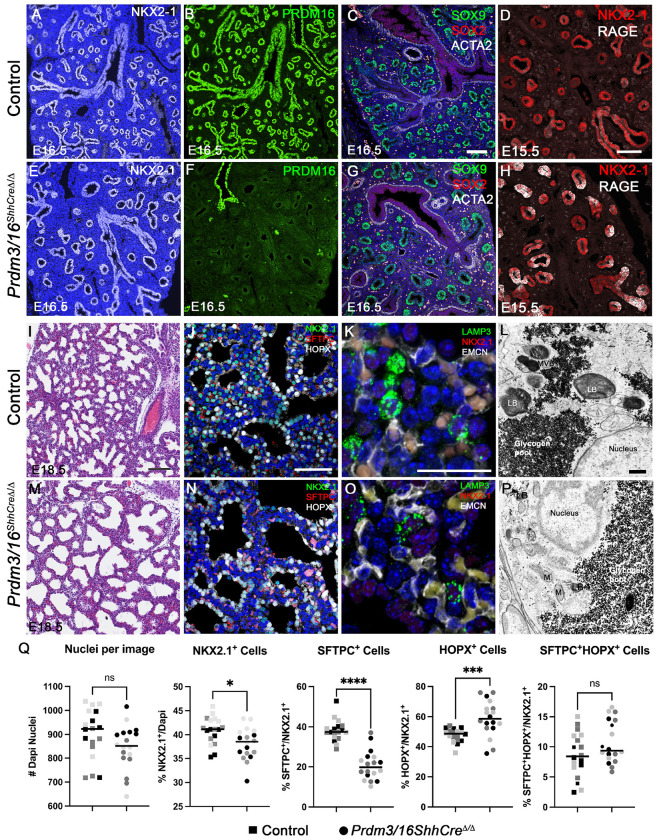
Differential chromatin accessibility accompanies and mediates transcriptional control of diverse cell fates and their differentiation during embryogenesis. While the critical role of NKX2-1 and its transcriptional targets in lung morphogenesis and pulmonary epithelial cell differentiation is increasingly known, mechanisms by which chromatin accessibility alters the epigenetic landscape and how NKX2-1 interacts with other co-activators required for alveolar epithelial cell differentiation and function are not well understood. Here, we demonstrate that the paired domain zinc finger transcriptional regulators PRDM3 and PRDM16 regulate chromatin accessibility to mediate cell differentiation decisions during lung morphogenesis. Combined deletion of Prdm3 and Prdm16 in early lung endoderm caused perinatal lethality due to respiratory failure from loss of AT2 cell function. Prdm3/16 deletion led to the accumulation of partially differentiated AT1 cells and loss of AT2 cells. Combination of single cell RNA-seq, bulk ATAC-seq, and CUT&RUN demonstrated that PRDM3 and PRDM16 enhanced chromatin accessibility at NKX2-1 transcriptional targets in peripheral epithelial cells, all three factors binding together at a multitude of cell-type specific cis-active DNA elements. Network analysis demonstrated that PRDM3/16 regulated genes critical for perinatal AT2 cell differentiation, surfactant homeostasis, and innate host defense. Lineage specific deletion of PRDM3/16 in AT2 cells led to lineage infidelity, with PRDM3/16 null cells acquiring partial AT1 fate. Together, these data demonstrate that NKX2-1-dependent regulation of alveolar epithelial cell differentiation is mediated by epigenomic modulation via PRDM3/16.

Keywords: Alveolar Epithelial Cell; Chromatin Accessibility; Differentiation; PRDM; Pulmonary Surfactant.


Conflict of interest statement

Competing interests: The Authors declare that they have no competing interests for the current work, including patents, financial holdings, advisory positions, or other interests.

Figures

Figure 1:
Figure 1:. Decreased AT2 cell numbers and differentiation after deletion of Prdm3/16.
Immunofluorescence staining of embryonic lung indicates normal expression of NKX2-1after deletion (A, E), loss of PRDM16 staining in lung epithelium in Prdm3/16ShhCreΔ/Δ fetuses and retention in vascular smooth muscle (B, F), and normal proximal (SOX2+) and distal (SOX9+) epithelial patterning (C, G). At E15.5, the AT1 cell marker RAGE is increased in Prdm3/16ShhCreΔ/Δ lung (D, H). (I, M) Hematoxylin and eosin staining of E18.5 lung demonstrating poor sacculation in Prdm3/16ShhCreΔ/Δ. (J, K, N, O) Immunofluorescence staining for SFTPC and LAMP3 identifies AT2 cells; AT1 cells are stained for HOPX demonstrating paucity of AT2 cells and reduced LAMP3 expression. (L, P). Electron microscopy of E18.5 lung demonstrates absence of mature lamellar bodies in the Prdm3/16ShhCreΔ/Δ AT2 cells. (Q) Quantification of AT2, AT1, and AT2/AT1 cell numbers at E18.5 from 3 control and 3 Prdm3/16ShhCreΔ/Δ fetuses. P-values were calculated using a 2-tailed Mann-Whitney test *p<0.0129, ***p<0.0004, ****p<0.0001, not significant (n.s.). Scale bars in C, D, I (100 mm), J (50 mm), K (25 mm), L (1 mm).
Figure 2.
Figure 2.. Single-cell RNA-seq (scRNA-seq) analysis of cellular and gene expression alterations in Prdm3/16ShhCreD/D mouse lung at E18.5.
(A) UMAP plots of mouse epithelial cell subsets. (B) Alterations in cell type proportions within all epithelial (left panel) and within distal epithelial (right panel) cells. scRNA-seq data of epithelial cells in (A) were used for the cell type proportion calculations. (C) Violin plot visualization of representative AT2 associated RNAs. (D) Violin plot visualization of representative AT1 associated RNAs. In (C&D), black dots and error bars represent mean±SD; * represents p-value of two-tailed Wilcoxon rank sum test ≤0.05, fold change ≥1.5, and expression percentage ≥20%. (E) Immunofluorescence staining of differentially expressed AT1 and AT2 genes in E18.5 lungs (F) Pseudo-bulk correlation analysis with an independent mouse lung developmental time course scRNA-seq data (GSE149563) showing that alveolar epithelial cells from Prdm3/16ShhCreΔ/Δ mouse lungs are most similar to cells from earlier time points.
Figure 3.
Figure 3.. Loss of Prdm3/16 influences cell differentiation and chromatin accessibility, leading to skewed AT1 and AT2 populations.
(A-C) Bulk RNA-Seq analysis of sorted EpCAM+ epithelial cells from E17.5 Control and Prdm3/16ShhCreΔ/Δ (Prdm3/16Δ/Δ) lungs. DESeq2 was used for differential expression analysis utilizing standard cutoffs of log2FoldChange > |0.58| and p-value <0.05. (A) Volcano plot showing 1,438 genes with decreased expression and 2,124 genes with increased expression, highlighting genes that are associated with epithelial cell development and mis-regulated in AT1 and AT2 cells, note darkly boxed genes were also observed in the scRNA-seq data. (B) Functional enrichment of gene sets with either increased expression or decreased expression using ToppFun and selecting highly enriched GO: Biological Processes. (C) Heatmaps of normalized gene expression of AT1 and AT2 associated genes, showing an increase in genes associated with AT1 cells and a decrease in genes associated with AT2 cells, a reflection of cell type population size. Asterisk (*) denotes statistical change in both bulk RNAseq and single cell RNA-seq. (D) Heatmaps of ATAC-seq data made with the R package tornado plot showing 5,067 regions with increased chromatin accessibility (left panel) or 4,577 regions with decreased chromatin accessibility (right panel) in representative individuals. Accessibility determined by differential accessibility analysis with R package DiffBind using a log2 fold change cutoff of >|0.58| and a p-value <0.05 (E) Genomic distributions of each ATAC peakset, regions with increased or decreased accessibility, as annotated by HOMER annotatePeaks.pl (F) Motif enrichment with HOMER searching either regions with increased accessibility (upper panel) or decreased accessibility (lower panel), showing the putative transcription factors binding within these regions. (G) Changes in promoter and enhancer chromatin accessibility observed in Prdm3/16ShhCreΔ/Δ epithelial cells in differentially expressed genes associated with AT2 cell maturation.
Figure 4.
Figure 4.. PRDM16, NKX2-1, and PRDM3 bind to shared sites throughout the genome and at promoters.
(A) Venn Diagram shows the average overlap of binding sites between PRDM16 CUT&RUN and NKX2-1 CUT&RUN observed in two experiments. (B) Genomic distributions of all called peaks from a representative PRDM16 binding experiment (left panel) and a representative NKX2-1 binding experiment (right panel). (C) HOMER motif enrichment for all called peaks across the genome of a representative PRDM16 CUT&RUN (upper panel) or NKX2-1 CUT&RUN (lower panel) experiments. (D) Venn diagram of the overlap of H3K4me3 marked peaks between PRDM16 and NKX2-1 CUT&RUN. (E) Genomic distributions of the overlap peaks bound by both PRDM16 and NKX2-1 that are marked by H3K4me3. (F) Immunoprecipitation showing co-binding of FLAG-tagged PRDM16 and NKX2-1 after co-transfection in HEK293T cells. (G and H) CUT&RUN analysis of selected genes is visualized with the UCSC Genome Browser for H3K4me3, PRDM16, PRDM3, and NKX2-1. AT1 cell and AT2 cell associated peaks from published data set (Little, et.al.,(12)). ENCODE cCRE peaks are annotated from the ENCODE database of cis-regulatory elements. Binding is seen in AT2 cell-associated genes (G) and AT1 cell-associated genes (H).
Figure 5:
Figure 5:. PRDM3/16 work alongside NKX2-1 to regulate gene networks critical for AT2 cell differentiation.
(A) Gene regulatory network for AT2 cells with PRDM16 and NKX2-1 at the center. Genes were selected based on being downregulated in the bulk RNA-seq (Log2 fold change > |0.58|, p-val <0.05) and either differentially expressed in the single cell DEA or single cell gene expression (>15% expression in the AT2 control cell population and Prdm3/16Δ/Δ expression > Control expression). Those genes were used as input into IPA for a Regulatory Upstream Analysis. The resulting relationships were loaded into Cytoscape. IPA predicted previously identified transcription factors known to regulate key genes in AT2 cells. (B) Predicted transcription factor binding sites (TFBSs) of PRDM TFs and co-factors near the promoter regions of canonical AT2 genes. TFBSs visualization is based on the data of “JASPAR 2022 TFBS UCSC tracks” available in the UCSC genome browser. TFBSs with prediction scores >=400 were included and the locations of PRDM16, NKX (NKX2-1, NKX2-2), FOXA1/2, SREBF1/2, CEBP (CEBPA/D/G), GATA6, and STAT3 are indicated. The predicted PRDM16 binding motif from the CIS-BP database was also included using HOMER scanMotifGenomeWide.pl to scan reference sequences in the promoter regions of Abca3 and Sftpb. Nearby TFBSs of the same TF family were merged. TFBSs were colored based on TF family.
Figure 6:
Figure 6:. AT2-specific PRDM3/16 deletion leads to lineage infidelity during alveolar epithelial specification.
Dams were treated with tamoxifen at E12.5 and E13.5 to generate SftpcCreERR26R-Tdt (WT) and SftpcCreERR26R-Tdt/Prdm3/16D/D (KO) fetuses which were harvested at E18.5 for lineage analysis. WT animals (A-H) demonstrated a majority of cells in the Sftpc lineage (SftpcLineage) were marked with only SFTPC protein by IHC (white arrowheads), while KO animals (J-Q) showed significant decreases in SFTPC-only cells ®, with corresponding increases in SftpcLineage cells expressing HOPX (S), either with concomitant SFTPC expression (T) or without (U).

Similar articles

References

    1. Whitsett J.A., Kalin T.V., Xu Y., and Kalinichenko V.V., Building and Regenerating the Lung Cell by Cell. Physiol Rev, 2019. 99(1): p. 513–554. - PMC - PubMed
    1. Sun X., et al., A census of the lung: CellCards from LungMAP. Dev Cell, 2022. 57(1): p. 112–145 e2. - PMC - PubMed
    1. Zepp J.A. and Morrisey E.E., Cellular crosstalk in the development and regeneration of the respiratory system. Nat Rev Mol Cell Biol, 2019. 20(9): p. 551–566. - PMC - PubMed
    1. Swarr D.T. and Morrisey E.E., Lung endoderm morphogenesis: gasping for form and function. Annu Rev Cell Dev Biol, 2015. 31: p. 553–73. - PMC - PubMed
    1. Kimura S., et al., The T/ebp null mouse: thyroid-specific enhancer-binding protein is essential for the organogenesis of the thyroid, lung, ventral forebrain, and pituitary. Genes Dev, 1996. 10(1): p. 60–9. - PubMed

Publication types