[Preprint]. 2023 Dec 21:2023.12.20.572625.
doi: 10.1101/2023.12.20.572625.

Regulation of the transcription factor CdnL promotes adaptation to nutrient stress in Caulobacter

Affiliations

Regulation of the transcription factor CdnL promotes adaptation to nutrient stress in Caulobacter

Erika L Smith et al. bioRxiv. .

Update in

Abstract

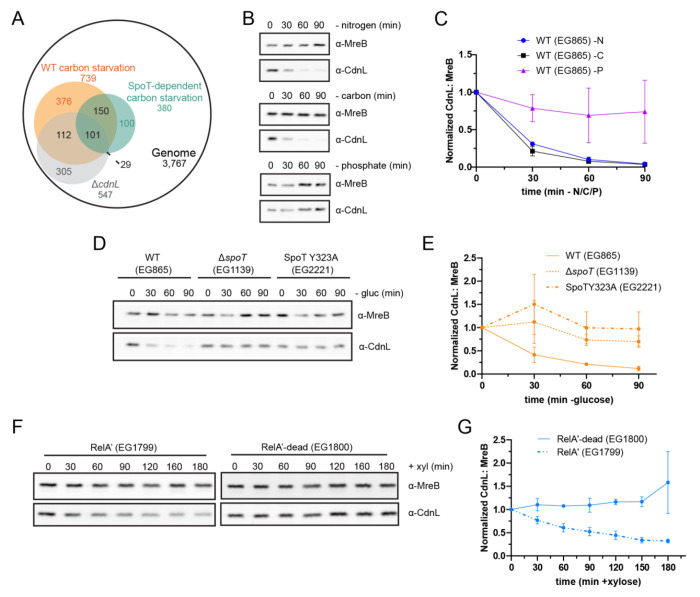
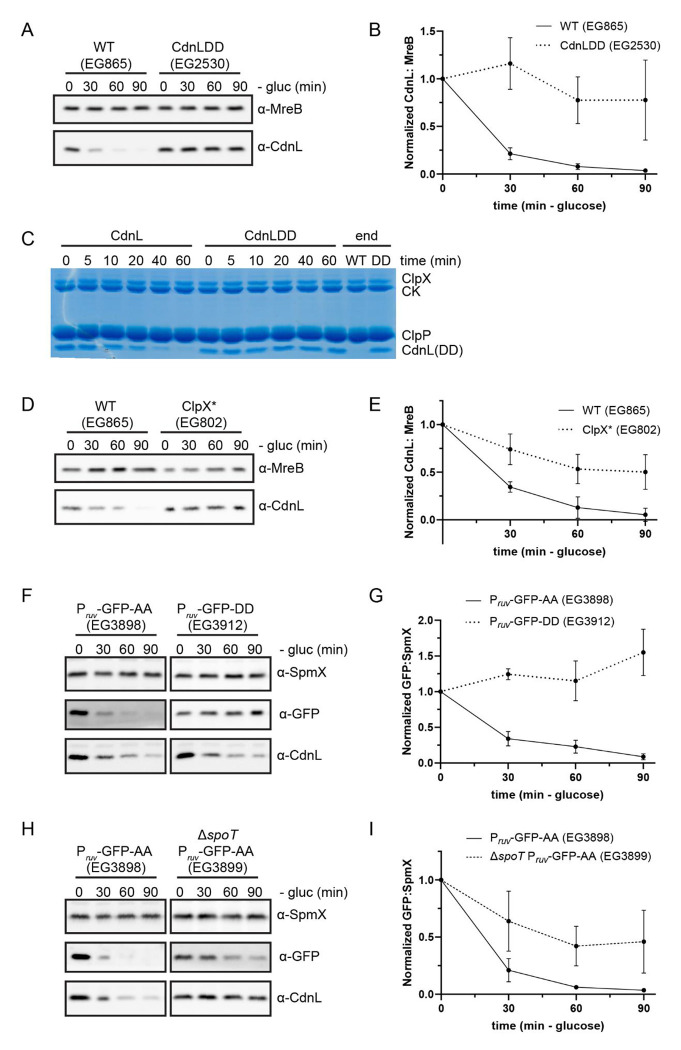
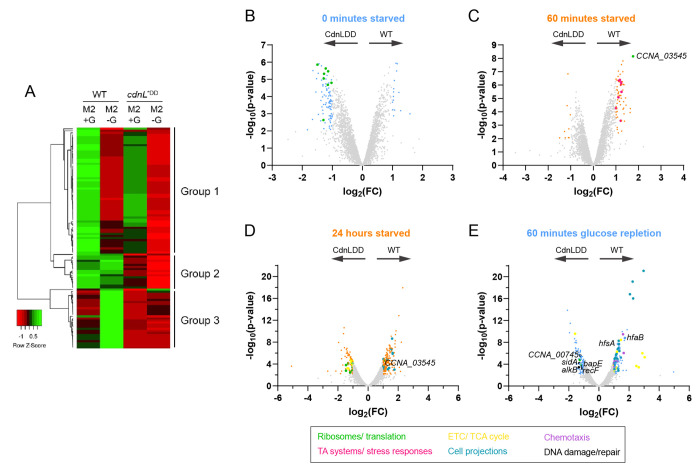
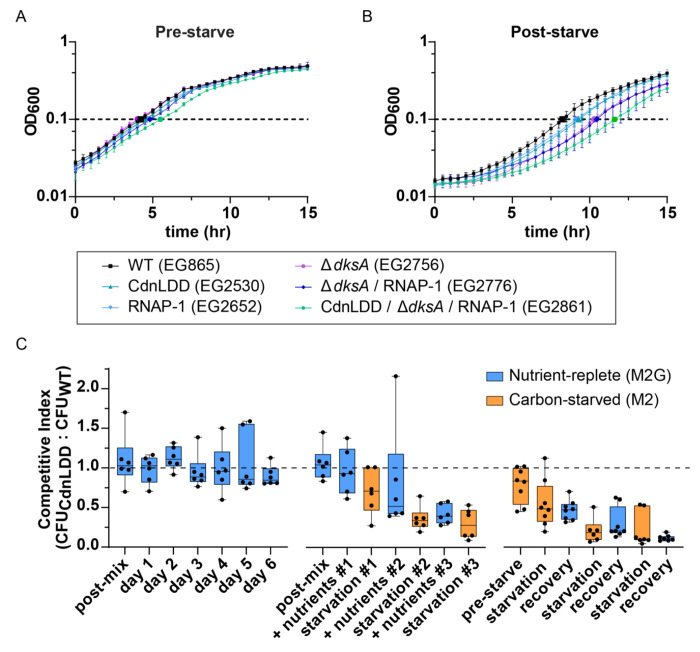
In response to nutrient deprivation, bacteria activate a conserved stress response pathway called the stringent response (SR). During SR activation in Caulobacter crescentus, SpoT synthesizes the secondary messengers (p)ppGpp, which affect transcription by binding RNA polymerase to downregulate anabolic genes. (p)ppGpp also impacts expression of anabolic genes by controlling the levels and activities of their transcriptional regulators. In Caulobacter, a major regulator of anabolic genes is the transcription factor CdnL. If and how CdnL is controlled during the SR and why that might be functionally important is unclear. Here, we show that CdnL is downregulated post-translationally during starvation in a manner dependent on SpoT and the ClpXP protease. Inappropriate stabilization of CdnL during starvation causes misregulation of ribosomal and metabolic genes. Functionally, we demonstrate that the combined action of SR transcriptional regulators and CdnL clearance allows for rapid adaptation to nutrient repletion. Moreover, cells that are unable to clear CdnL during starvation are outcompeted by wild-type cells when subjected to nutrient fluctuations. We hypothesize that clearance of CdnL during the SR, in conjunction with direct binding of (p)ppGpp and DksA to RNAP, is critical for altering the transcriptome in order to permit cell survival during nutrient stress.

Keywords: CarD; CdnL; adaptation; proteolysis; stringent response.


Figures

Figure 1:
Figure 1:. CdnL is cleared during conditions that activate the stringent response
A. Venn diagram of genes downregulated in ΔcdnL, in WT carbon starved cells, and in a SpoT-dependent manner (6, 14, 23). 213 genes overlapped between the ΔcdnL dataset and the WT carbon starved dataset (14, 23). 130 genes overlapped between the ΔcdnL dataset and the SpoT-dependent carbon starved dataset (6, 14). Both are significant enrichments (p < 0.05) as determined by hypergeometric probability. B. Representative western blots of CdnL during 90 minutes of nitrogen, carbon, and phosphate starvation. Protein samples were taken every 30 minutes. MreB was used as a loading control. C. Densitometry of CdnL levels (normalized to MreB) relative to t = 0 during nitrogen (−N), carbon (−C), and phosphate (−P) starvations from western blots as performed in B. Error bars represent +/− 1 SD of 3 biological replicates. D. Representative western blot of CdnL during 90 minutes of glucose (gluc) starvation in a WT, ΔspoT, or SpoTY323A background. Protein samples were taken every 30 minutes. MreB was used as a loading control. E. Densitometry of CdnL levels (normalized to MreB) relative to t = 0 from western blots as performed in D. Error bars represent +/− 1 SD of 3 biological replicates. F. Representative western blot of CdnL during 180 minutes of xylose (+xyl) induction of RelA’ or RelA’-dead. Protein samples were taken every 30 minutes. MreB was used as a loading control. G. Densitometry of CdnL levels (normalized to MreB) relative to t = 0 from western blots as performed in F. Error bars represent +/− 1 SD of 3 biological replicates.
Figure 2:
Figure 2:. ClpXP is implicated in CdnL clearance
A. Representative western blot of CdnL or CdnLDD during 90 minutes of glucose (gluc) starvation. Protein samples were taken every 30 minutes. MreB was used as a loading control. B. Densitometry of CdnL or CdnLDD levels (normalized to MreB) relative to t = 0 from western blots as performed in B. Error bars represent +/− 1 SD of 3 biological replicates. C. In vitro degradation of CdnL or CdnLDD. Protein samples were taken at indicated time points. CK indicated creatine kinase, which is used for ATP regeneration in the reaction. D. Representative western blot of CdnL during 90 minutes of glucose (gluc) starvation following a 2-hour induction of ClpX* (EG802) with 0.3% xylose. Protein samples were taken every 30 minutes. MreB was used as a loading control. E. Densitometry of CdnL levels (normalized to MreB) relative to t = 0 from western blots as performed in D. Error bars represent +/− 1 SD of 3 biological replicates. F. Representative western blot of GFP-AA or GFP-DD during 90 minutes of glucose (gluc) starvation. Protein samples were taken every 30 minutes. SpmX was used as a loading control. CdnL was used as a comparison. G. Densitometry of GFP-AA or GFP-DD levels (normalized to SpmX) relative to t = 0 from western blots as performed in F. Error bars represent +/− 1 SD of 3 biological replicates. H. Representative western blot of GFP-AA in a WT or ΔspoT background during 90 minutes of glucose (gluc) starvation. Protein samples were taken every 30 minutes. SpmX was used as a loading control. CdnL was used as a comparison. I. Densitometry of GFP-AA levels (normalized to SpmX) relative to t = 0 from western blots as performed in H. Error bars represent +/− 1 SD of 3 biological replicates.
Figure 3:
Figure 3:. CdnL stabilization impacts transcription of ribosome-related genes
A. Heat map of CdnL/CdnLDD binding across the chromosome in M2G and 60 minutes of glucose starvation in M2. Green indicates high relative binding, while red indicates low relative binding. Group 1 shows genomic loci with a reduction of WT CdnL binding after starvation in M2. Group 2 shows genomic loci with equal WT CdnL binding after starvation in M2. Group 2 shows genomic loci with an increase in WT CdnL binding after starvation in M2. Row Z-score = (CdnL Fold enrichment value in the sample of interest - Mean CdnL Fold enrichment across all samples) / Standard Deviation. B. Volcano plot comparing differences in gene expression between WT and CdnLDD at 0 minutes of starvation, as measured by RNAseq. Negative log10 of the p-value is plotted against log2 of the fold change mRNA counts in WT vs CdnLDD (FC = WT mRNA counts/ CdnLDD mRNA counts). Light blue points indicate transcripts with FDR < 0.05 and |log2(FC)| > 1, while gray points indicate transcripts that are not significantly different. Green points indicate transcripts associated with ribosomes and translation. Arrows indicate direction of higher expression for respective strains. C. Volcano plot comparing differences in gene expression between WT and CdnLDD at 60 minutes of starvation, as measured by RNAseq. Negative log10 of the p-value is plotted against log2 of the fold change mRNA counts in WT vs CdnLDD (FC = WT mRNA counts/ CdnLDD mRNA counts). Orange points indicate transcripts with FDR < 0.05 and |log2(FC)| > 1, while gray points indicate transcripts that are not significantly different. Pink points indicate transcripts associated with toxin-antitoxin (TA) systems and stress responses. Arrows indicate direction of higher expression for respective strains. D. Volcano plot comparing differences in gene expression between WT and CdnLDD at 24 hours of starvation, as measured by RNAseq. Negative log10 of the p-value is plotted against log2 of the fold change mRNA counts in WT vs CdnLDD (FC = WT mRNA counts/ CdnLDD mRNA counts). Orange points indicate transcripts with FDR < 0.05 and |log2(FC)| > 1, while gray points indicate transcripts that are not significantly different. Teal points indicate transcripts associated with cell projections, such as pili and flagella, while yellow points indicate transcripts associated with the electron transport chain (ETC) and tricarboxylic acid (TCA) cycle. Arrows indicate direction of higher expression for respective strains. E. Volcano plot comparing differences in gene expression between WT and CdnLDD at 0 minutes of starvation, as measured by RNAseq. Negative log10 of the p-value is plotted against log2 of the fold change mRNA counts in WT vs CdnLDD (FC = WT mRNA counts/ CdnLDD mRNA counts). Light blue points indicate transcripts with FDR < 0.05 and |log2(FC)| > 1, while gray points indicate transcripts that are not significantly different. Purple points indicate transcripts associated with chemotaxis, while black points indicate transcripts associated with DNA damage and repair. Arrows indicate direction of higher expression for respective strains.
Figure 4:
Figure 4:. Efficient outgrowth after glucose limitation requires stringent response mediated transcriptional reprogramming
A. Growth curve in M2G minimal media prior to 24 hours of starvation. Error bars represent +/− 1 SD of 3 biological replicates B. Growth curve in M2G minimal media following 24 hours of starvation. Error bars represent +/− 1 SD of 3 biological replicates C. Box-and-whisker plot of the ratio of CdnLDD to WT colony forming unit (CFU) ratio during competition. Dashed line indicates a ratio of 1, when number of CdnLDD colonies = number of WT colonies. Far left is nutrient-replete (M2G) conditions only; middle starts in nutrient-replete conditions; far right starts in carbon-starved (M2) conditions. Post-mix and pre-starve indicate time point just after mixing the strains and prior to the initial incubation. Center line in each box indicates mean of 6 biological replicates (3 mixed cultures in 2 combinations; for more detail, see Materials and Methods). Whiskers show minimum to maximum value. Box encases 25th to 75th percentile.

Similar articles

Cited by

References

    1. Boutte C. C., Crosson S., Bacterial lifestyle shapes stringent response activation. Trends Microbiol. 21, 174–180 (2013). - PMC - PubMed
    1. Boutte C. C., Henry J. T., Crosson S., ppGpp and polyphosphate modulate cell cycle progression in Caulobacter crescentus. J. Bacteriol. 194, 28–35 (2012). - PMC - PubMed
    1. England J. C., Perchuk B. S., Laub M. T., Gober J. W., Global regulation of gene expression and cell differentiation in Caulobacter crescentus in response to nutrient availability. J. Bacteriol. 192, 819–833 (2010). - PMC - PubMed
    1. Gonzalez D., Collier J., Effects of (p)ppGpp on the progression of the cell cycle of Caulobacter crescentus. J. Bacteriol. 196, 2514–2525 (2014). - PMC - PubMed
    1. Lesley J. A., Shapiro L., SpoT Regulates DnaA Stability and Initiation of DNA Replication in Carbon-Starved &lt;em&gt;Caulobacter crescentus&lt;/em&gt; J. Bacteriol. 190, 6867 LP–6880 (2008). - PMC - PubMed

Publication types