[Preprint]. 2023 Dec 21:2023.12.20.572268.
doi: 10.1101/2023.12.20.572268.

Rewriting regulatory DNA to dissect and reprogram gene expression

Affiliations

Rewriting regulatory DNA to dissect and reprogram gene expression

Gabriella E Martyn et al. bioRxiv. .

Update in

  • Rewriting regulatory DNA to dissect and reprogram gene expression.
    Martyn GE, Montgomery MT, Jones H, Guo K, Doughty BR, Linder J, Bisht D, Xia F, Cai XS, Chen Z, Cochran K, Lawrence KA, Munson G, Pampari A, Fulco CP, Sahni N, Kelley DR, Lander ES, Kundaje A, Engreitz JM. Martyn GE, et al. Cell. 2025 Jun 12;188(12):3349-3366.e23. doi: 10.1016/j.cell.2025.03.034. Epub 2025 Apr 16. Cell. 2025. PMID: 40245860

Abstract

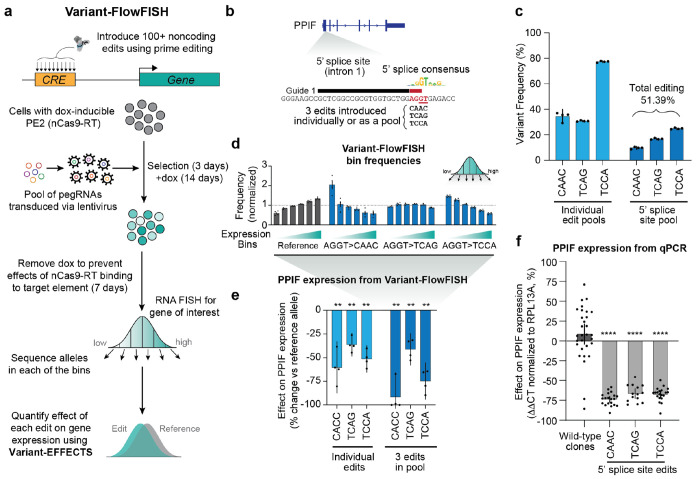
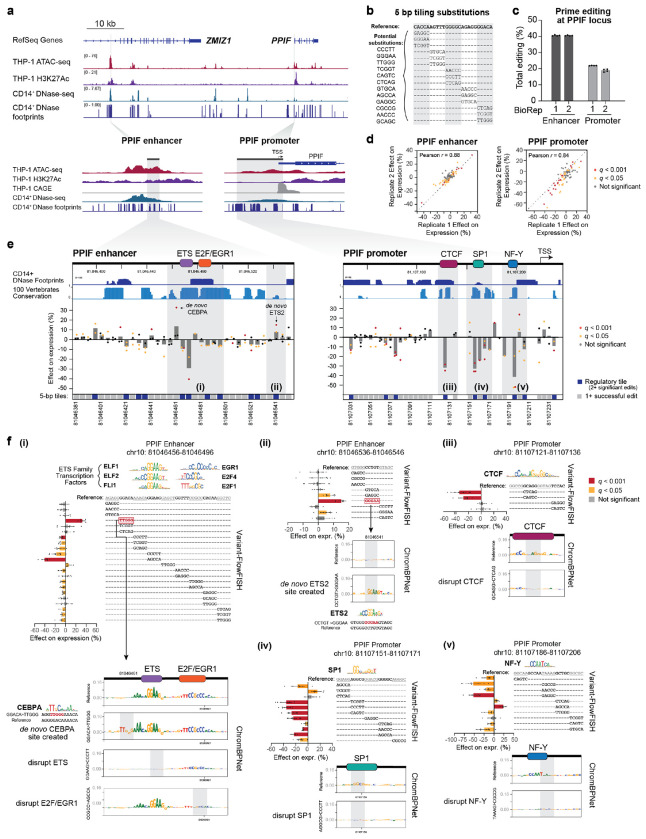
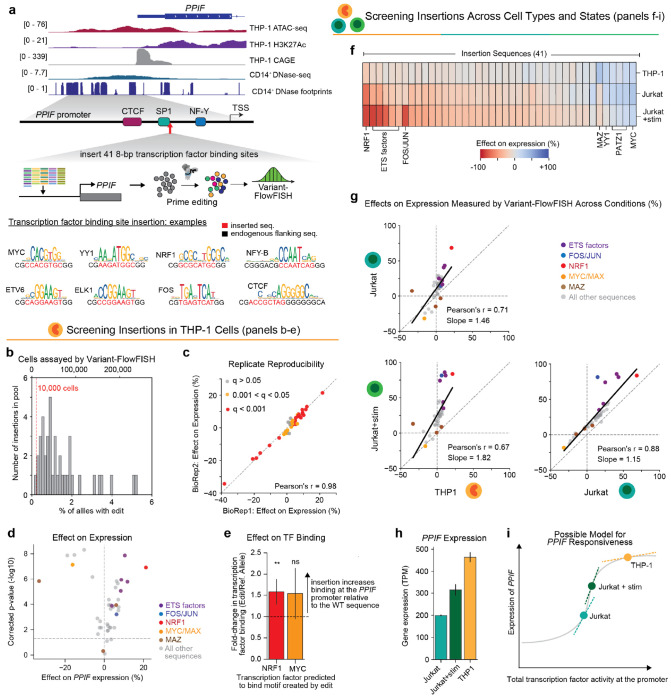
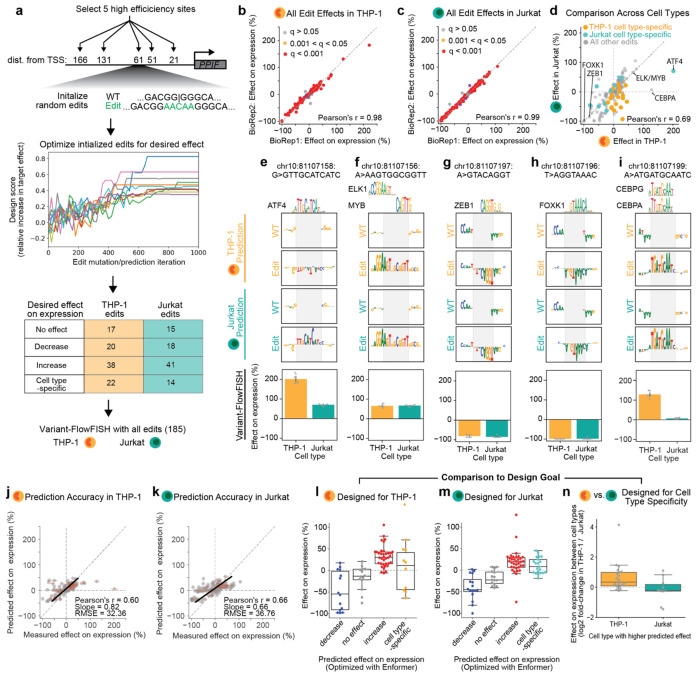
Regulatory DNA sequences within enhancers and promoters bind transcription factors to encode cell type-specific patterns of gene expression. However, the regulatory effects and programmability of such DNA sequences remain difficult to map or predict because we have lacked scalable methods to precisely edit regulatory DNA and quantify the effects in an endogenous genomic context. Here we present an approach to measure the quantitative effects of hundreds of designed DNA sequence variants on gene expression, by combining pooled CRISPR prime editing with RNA fluorescence in situ hybridization and cell sorting (Variant-FlowFISH). We apply this method to mutagenize and rewrite regulatory DNA sequences in an enhancer and the promoter of PPIF in two immune cell lines. Of 672 variant-cell type pairs, we identify 497 that affect PPIF expression. These variants appear to act through a variety of mechanisms including disruption or optimization of existing transcription factor binding sites, as well as creation of de novo sites. Disrupting a single endogenous transcription factor binding site often led to large changes in expression (up to -40% in the enhancer, and -50% in the promoter). The same variant often had different effects across cell types and states, demonstrating a highly tunable regulatory landscape. We use these data to benchmark performance of sequence-based predictive models of gene regulation, and find that certain types of variants are not accurately predicted by existing models. Finally, we computationally design 185 small sequence variants (≤10 bp) and optimize them for specific effects on expression in silico. 84% of these rationally designed edits showed the intended direction of effect, and some had dramatic effects on expression (-100% to +202%). Variant-FlowFISH thus provides a powerful tool to map the effects of variants and transcription factor binding sites on gene expression, test and improve computational models of gene regulation, and reprogram regulatory DNA.


Conflict of interest statement

Competing Interests J.M.E. is a consultant and equity holder in Martingale Labs, Inc., has received materials from 10x Genomics unrelated to this study, and has received speaking honoraria from GSK plc. J.L. and D.R.K. are employed by Calico Life Sciences LLC. C.P.F. is employed by Sanofi. A.K. is on the scientific advisory board of PatchBio, SerImmune and OpenTargets, was a consultant with Illumina, and owns shares in DeepGenomics, ImmunAI and Freenome. M.T.M., G.E.M., B.R.D., H.J., K.G., and J.M.E. are inventors on a provisional patent application related to this work.

Figures

Figure 1.
Figure 1.. Variant FlowFISH combines prime editing with RNA-FlowFISH to investigate the effects of noncoding variants on expression of its target gene.
(a) Overview of the Variant-FlowFISH pipeline. We introduce 100+ sequence variants targeting a cis-regulatory element (CRE) of interest into a pool of cells using CRISPR prime editing. Lentivirus is used to introduce pegRNAs into cells expressing PE2 prime editor from a doxycycline-inducible promoter. Successfully infected cells are selected with puromycin, and prime editing is activated with treatment with doxycycline. Cells are stained for an RNA of interest and sorted into bins based on expression (FlowFISH). We PCR amplify and sequence the edited site, measure the frequencies of each edit (allele) in each expression bin, and estimate the quantitative effect of the edit on gene expression using Variant-EFFECTS (see also Supplementary Fig. 1). (b) Prime editing strategy used to disrupt the 5’ splice site of the first intron of PPIF. Thick line: Location of the pegRNA spacer (black) and protospacer adjacent motif (PAM, red). Nucleotides to be replaced are highlighted in red, the critical ‘GT’ dinucleotide essential for splicing is underlined, and the 3 edit sequences are below in black. The 5’ splice site consensus motif is also shown. (c) Frequency of each variant in cells after 13 days of prime editing activation with doxycycline treatment, prior to cell sorting, as measured by amplicon sequencing of the edited site. Dots: 2 technical FlowFISH replicates from each of 2 biological replicates (n=4). Bars: mean +/− 95% confidence interval (c.i.). (d) Relative frequency of each allele (reference, and 3 edits) for the 3-pegRNA pool in each of 6 FlowFISH expression bins. Frequencies are normalized to the mean frequency of the reference allele across all 6 bins. Bars and dots as in c. (e) Effects of 5’ splice site edits on PPIF expression, as measured by Variant-FlowFISH (% effect versus the reference allele). Bars and dots as in c. **: p < 0.01, one-sample, two-tailed t-test. (f) Effects of 5’ splice site edits on PPIF expression, as measured by qPCR in clonalized cell lines homozygous for each edit. Dots: Clones for wild-type (n=30), AGGT>CACC (n=20), AGGT>TCAG (n=14), and AGGT>TCCA (n=20). Bars: mean effect +/− 95% c.i. ****: p < 0.0001, one-sample, two-tailed t-test.
Figure 2.
Figure 2.. Tiling mutagenesis of an enhancer and promoter for PPIF.
(a) Dissecting the regulation of PPIF via tiling mutagenesis of the promoter and a distal enhancer in THP-1 monocytic cells. Chromatin state signal tracks show data from THP-1 (ATAC-seq and H3K27ac) and the corresponding primary cell type CD14+ monocytes (DNase-seq and DNase footprints). Gray highlights show the regions for tiling mutagenesis. Cap Analysis of Gene Expression (CAGE) reads mark the TSS. Coordinates: PPIF locus (hg19 chr10:81,037,448-81,124,761), PPIF enhancer (chr10:81,045,489-81,047,143), PPIF promoter (chr10:81,106,967-81,107,535). (b) We conducted tiling mutagenesis in 5-bp windows across each regulatory element, and selected substitutions from a bank of 12 possible sequences selected for prime editing efficiency (Methods). (c) Total editing (% of sequencing reads, summed across all designed edits) for Variant-FlowFISH screens at the PPIF enhancer and PPIF promoter. Dots: technical FlowFISH replicates (n=4). Bar: mean +/− 95% c.i. (d) Variant-FlowFISH measurements of variant effects on PPIF expression (%) are highly correlated between two biological replicates. Dots: all variants passing the frequency threshold for the enhancer and promoter tiling screens. Red: q < 0.001. Yellow: q < 0.05 (Benjamini-Hochberg corrected p-value, one-sample t-test). (e) Tiling mutagenesis data at the PPIF enhancer and promoter in THP-1. Dots: Effect of each 5-bp substitution on PPIF expression, as measured by Variant-FlowFISH (mean of 2 biological replicates x 4 technical replicates). Bars: Mean of 1-3 substitutions at each position. Variants with significant effects are highlighted in yellow (q < 0.05) and red (q < 0.001). Tracks at top show CD14+ DNase footprints and evolutionary conservation across 100 vertebrates (PhastCons). Bottom: Dark blue indicates “regulatory tiles” (positions with 2 or more significant variants with the same direction of effect), gray indicates a tested tile, and white indicates a tile with no edits of sufficiently high frequency. Gray highlights show regions of interest. Colored boxes at top: Positions of transcription factor binding sites identified by Variant-FlowFISH and motif analysis. Genomic coordinates: PPIF enhancer (chr10: 81,046,381-81,046,556) and PPIF promoter (chr10: 81,107,026-81,107,246). (f) Variant-FlowFISH data and ChromBPNet predictions at selected regulatory tiles (gray highlights in e). Barplots show effects on PPIF expression as measured by Variant-FlowFISH (bars: mean +/− 95% c.i; dots: replicate experiments, n=6-8; yellow bars: q < 0.05; red bars: q < 0.001). Motifs (identified by FIMO from MEME Suite using the HOCOMOCO v11 database and JASPAR,) show potential transcription factors binding sites disrupted or created by 5-bp edits. Substitutions highlighted in red indicate the creation of a de novo binding site. ChromBPNet sequence interpretations (DeepSHAP) of the reference and edited sequences show the predicted contribution of each nucleotide for chromatin accessibility signal. Gray boxes within the ChromBPNet sequence interpretations highlight the position of selected 5-bp edits.
Figure 3.
Figure 3.. Inserting transcription factor binding sites at the PPIF promoter.
(a) We inserted a library of 41 8-bp DNA sequences at a site 58 bp upstream of the PPIF TSS in THP-1 monocytes. (b) Histogram of frequencies of each 8-bp insertion in the edited pool of cells as a percentage of alleles (bottom x-axis) and the corresponding minimum number of cells assessed by Variant-FlowFISH (top x-axis). (c) Correlation of effect sizes on gene expression between 2 Variant-FlowFISH biological replicates. (d) Variant-FlowFISH measurements of variant effects on PPIF expression (%) in THP-1 cells are highly correlated between two biological replicates. Dots (n=41): all variants passing the frequency threshold. Red: q < 0.001. Yellow: q < 0.05, gray: q > 0.05 (Benjamini-Hochberg corrected p-value, one-sample t-test). (e) Change in the binding of MYC or NRF1 relative to the reference allele for 8-bp insertions that create binding motifs for these factors, as measured by ChIP followed by amplicon sequencing. Allele-specific fold change is calculated by comparing the frequencies of the edit and reference alleles in the ChIP sample versus whole-cell genomic DNA input (Methods). **: p = 0.007, one sided t-test. ns: not significant. (f) Effects of the 8-bp sequence insertion library were measured in three cellular conditions (rows) using Variant-FlowFISH: in THP-1 monocytes, Jurkat T cells, and Jurkat T cells stimulated with PMA and anti-CD3 antibody. Heatmap color: Effect of each insertion (columns) on PPIF expression, relative to the reference allele within each condition. (g) Pairwise comparison of effects of 8-bp insertion edits among the three cellular conditions. Black line: Linear regression line of best fit. Dots (n=41): all variants passing the frequency threshold. Dots are colored if the edit creates a predicted de novo motif instance of a transcription factor binding site (see legend). (h) PPIF expression measured by RNA-seq in wild-type cells in transcripts per million (TPM). (i) A simple model that could explain the differences in the magnitude of effects observed between cell types. Dose response curve shows a hypothetical relationship between total transcription factor input to the PPIF promoter (x-axis) and PPIF expression (y-axis). Points along this curve start with different levels of transcription factor activity at the promoter (e.g., due to factors binding at the promoter or distal enhancers). Dotted tangent lines represent how gene expression might vary due to changes in total transcription factor activity from 8-bp sequence insertions, and their slopes are a theoretical representation of the effects observed across conditions (see Fig. 3g).
Figure 4.
Figure 4.. Benchmarking sequence-based predictive models of gene regulation.
(a) Schematic of approach for calculating predicted effects of variants using ChromBPNet. ChromBPNet (or ProCapNet) takes as input 2 kb of DNA sequence and predicts base pair-resolution ATAC-seq (or PRO-Cap) profiles and counts. We calculate predicted effects as the difference in predicted counts between reference and edited 1 kb sequences, centered on the variant. Enformer (not shown) takes 196 kb of DNA sequence, and predicts CAGE or DNase signal in 128-bp bins. We calculate predicted effects as the difference in predicted signal between reference and edited 768-bp sequences (6 aggregated prediction bins), centered on the variant (for edits at the promoter) or the TSS (for predicting effects of edits at the enhancer on CAGE). See Methods for details on model predictions. (b) For promoter variants, comparison of measured effects on PPIF expression (Variant-FlowFISH) with predicted effects on either gene expression (left) or chromatin accessibility (right) at the promoter. Dots: n=82 variants at the PPIF promoter with significant effects on expression in THP-1 cells. Error bars: 95% c.i. for measured effect size. Black line: Linear regression line of best fit. Legend lists Pearson’s r correlation coefficient, slope from the linear regression, and root mean squared error (RMSE) of the predicted effects on expression (%). Predictions from Enformer (top row) and CNN models (ProCapNet and ChromBPNet, bottom) use data from THP-1 or the closest available cell type (Methods). (c) Similar to b, for n=50 edits with significant effects at the PPIF enhancer in THP-1 cells. Here, Enformer predicts effects of edits in the enhancer on CAGE or DNase-seq signals around the PPIF promoter (see Methods). (d) For enhancer variants with significant effects (n=50), we compared the measured effects on gene expression (Variant-FlowFISH) to predicted effects on chromatin accessibility at the enhancer (ChromBPNet, left). We then scaled these predicted effects on the enhancer by the measured effect of the enhancer on gene expression (37%), which we previously quantified using CRISPRi-FlowFISH, as a model for how effects on accessibility might affect gene expression (right). (e-h) DeepSHAP interpretations of base-resolution sequence contribution for ChromBPNet and ProCapNet predictions on (e) insertion of an ETV6 (ETS family) motif instance at the PPIF promoter, (f) insertion of a MYC/MAX motif instance at the PPIF promoter, (g) mutagenesis of an endogenous CTCF motif instance at the PPIF promoter, and (h) insertion of a NRF1 motif instance at the PPIF promoter. Transcription factor motif position weight matrices (PWMs) in e-h are from JASPAR. Barplots show effects measured by Variant-FlowFISH (gray), effects predicted by ChromBPNet (light blue), and effects predicted by ProCapNet (green). Error bar: 95% c.i. of measured effect. For effects predicted by Enformer models, see Supplementary Table 8.
Figure 5.
Figure 5.. Designed sequence edits reprogram PPIF gene expression
(a) Overview of the design framework and Variant-FlowFISH screening of edits designed with Enformer. We selected 5 sites in the PPIF promoter that had high editing efficiency in the promoter tiling mutagenesis experiment and initialized random sequence edits ≤10 bp. We then used Simulated Annealing with a standard Metropolis acceptance criterion to optimize these sequences for specific effects on expression via 1,000 iterations of 1-bp sequence changes. We used the predicted difference between the wild-type and edited PPIF promoter CAGE signal from Enformer as the fitness predictor. We designed edits with different predicted outcomes on expression for both THP-1 and Jurkat cells, and combined these edits into a single pool of 185 pegRNAs to test in both cell types. (b) Variant-FlowFISH measurements of variant effects on PPIF expression (%) in THP-1 cells are highly correlated between two biological replicates. Dots (n=164): all variants passing the frequency threshold. Red: q < 0.001. Yellow: q < 0.05, gray: q > 0.05 (Benjamini-Hochberg corrected p-value, one-sample t-test). (c) Similar to b, but for Variant-FlowFISH measurements of variant effects on PPIF expression (%) in Jurkat cells. (d) Comparison of effects between THP-1 cells and Jurkat cells for all edits. Edits designed to increase expression specifically in THP-1 or Jurkat (cell type-specific designs) are colored orange and green, respectively. Selected edits that introduce predicted motif instances are annotated with the name of the corresponding transcription factor. (e-i) In silico mutagenesis from Enformer for select edits annotated in (d) was performed using THP-1 and Jurkat CAGE heads, revealing motif instances for the transcription factors (e) ATF4, (f) ELK/MYB, (g) ZEB1, (h) FOXK1, and (i) CEBPG/CEBPA predicted to be created by sequence edits. Edited sequences are highlighted in gray, including inserted base pairs (Edit) and deleted base pairs (WT). Transcription factor motif PWMs in e-i are from JASPAR. Barplots (bottom) are the effects of each select edit in THP-1 and Jurkat cells. Each dot is a Variant-FlowFISH replicate and the error bar represents the 95% confidence interval of the mean. In i, Enformer interpretation appears to better match the motif for CEBPG, but CEBPG is similarly expressed between both cell types (THP-1 and Jurkat) and therefore is less likely than CEBPA (differentially expressed between cell types) to explain the differential effect of this edit on expression. (j) Comparison of measured effects on PPIF expression (Variant-FlowFISH) with Enformer predicted effects on gene expression (CAGE) in THP-1 cells. Dots: n=164 variants at the PPIF promoter with significant effects on expression in THP-1 cells. Error bars: 95% c.i. for measured effect size. Black line: Linear regression line of best fit. Legend lists Pearson’s r correlation coefficient, slope from the linear regression and room mean squared error (RMSE) of the predicted effects on expression (%). (k) Similar to j, for Jurkat cells. (l) Measured effects of edits designed for THP-1 cells to decrease expression (red), have no effect on expression (gray), increase expression (blue), or increase expression relative to Jurkat cells (orange). Boxplots show median, interquartile range, and whiskers show the rest of the distribution, except for points that are “outliers” from the interquartile range. (m) Measured effects of edits designed for Jurkat cells to decrease expression (red), have no effect on expression (gray), increase expression (blue), or increase expression relative to THP-1 cells (green). (n) Log2 fold-change of measured effects on PPIF expression between cell types (THP-1/Jurkat) for edits designed to increase expression in one cell type versus the other.

References

    1. Claussnitzer M., Cho J.H., Collins R., Cox N.J., Dermitzakis E.T., Hurles M.E., Kathiresan S., Kenny E.E., Lindgren C.M., MacArthur D.G., et al. (2020). A brief history of human disease genetics. Nature 577. 10.1038/s41586-019-1879-7. - DOI - PMC - PubMed
    1. Nasser J., Bergman D.T., Fulco C.P., Guckelberger P., Doughty B.R., Patwardhan T.A., Jones T.R., Nguyen T.H., Ulirsch J.C., Lekschas F., et al. (2021). Genome-wide enhancer maps link risk variants to disease genes. Nature 593, 238–243. - PMC - PubMed
    1. Maurano M.T., Humbert R., Rynes E., Thurman R.E., Haugen E., Wang H., Reynolds A.P., Sandstrom R., Qu H., Brody J., et al. (2012). Systematic localization of common disease-associated variation in regulatory DNA. Science 337, 1190–1195. - PMC - PubMed
    1. Frangoul H., Altshuler D., Domenica Cappellini M., Chen Y.-S., Domm J., Eustace B.K., Foell J., de la Fuente J., Grupp S., Handgretinger R., et al. (2020). CRISPR-Cas9 Gene Editing for Sickle Cell Disease and β-Thalassemia. N. Engl. J. Med. 10.1056/NEJMoa2031054. - DOI - PubMed
    1. Canver M.C., Smith E.C., Sher F., Pinello L., Sanjana N.E., Shalem O., Chen D.D., Schupp P.G., Vinjamur D.S., Garcia S.P., et al. (2015). BCL11A enhancer dissection by Cas9-mediated in situ saturating mutagenesis. Nature 527. 10.1038/nature15521. - DOI - PMC - PubMed

Publication types