[Preprint]. 2023 Dec 19:2023.12.18.571720.
doi: 10.1101/2023.12.18.571720.

Interferon signaling in the nasal epithelium distinguishes among lethal and common cold respiratory viruses and is critical for viral clearance

Affiliations

Interferon signaling in the nasal epithelium distinguishes among lethal and common cold respiratory viruses and is critical for viral clearance

Clayton J Otter et al. bioRxiv. .

Update in

Abstract

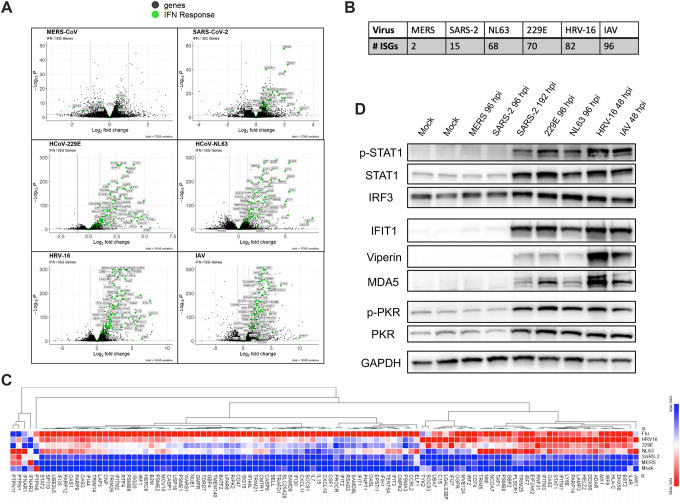
All respiratory viruses establish primary infections in the nasal epithelium, where efficient innate immune induction may prevent dissemination to the lower airway and thus minimize pathogenesis. Human coronaviruses (HCoVs) cause a range of pathologies, but the host and viral determinants of disease during common cold versus lethal HCoV infections are poorly understood. We model the initial site of infection using primary nasal epithelial cells cultured at air-liquid interface (ALI). HCoV-229E, HCoV-NL63 and human rhinovirus-16 are common cold-associated viruses that exhibit unique features in this model: early induction of antiviral interferon (IFN) signaling, IFN-mediated viral clearance, and preferential replication at nasal airway temperature (33°C) which confers muted host IFN responses. In contrast, lethal SARS-CoV-2 and MERS-CoV encode antagonist proteins that prevent IFN-mediated clearance in nasal cultures. Our study identifies features shared among common cold-associated viruses, highlighting nasal innate immune responses as predictive of infection outcomes and nasally-directed IFNs as potential therapeutics.

Keywords: common cold; coronavirus; interferon signaling; nasal epithelium; virus, temperature.


Conflict of interest statement

Competing Interest / Disclosures Statement: Susan R Weiss is on the Scientific Advisory Board of Ocugen, Inc. and consults for Powell Gilbert LLP. Noam A Cohen consults for GSK, AstraZeneca, Novartis, Sanofi/Regeneron; has US Patent “Therapy and Diagnostics for Respiratory Infection” (10,881,698 B2, WO20913112865) and a licensing agreement with GeneOne Life Sciences.

Figures

Figure 1
Figure 1. Respiratory viruses exhibit two distinct replication phenotypes in primary nasal epithelial cells.
Pooled-donor nasal ALI cultures were infected at the apical surface with the indicated virus (MOI = 1 PFU/cell, 33°C). Apical surface liquid (ASL) was collected at the indicated time points post infection and quantified via plaque assay. Averaged titers from infections in six independent sets of pooled-donor ALI cultures are shown in (A) for HCoV-NL63, HCoV-229E, and HRV-16 and in (B) for SARS-CoV-2, MERS-CoV as mean ± standard deviation (SD). The dotted line indicates the plaque assay limit of detection (LOD).
Figure 2
Figure 2. Common cold-associated viruses induce robust, early IFN responses.
Nasal ALI cultures were infected with each virus (MOI = 1, 33°C), cells were lysed at 96 hpi (SARS-CoV-2, MERS-CoV, HCoV-229E, HCoV-NL63) or 48 hpi (HRV-16, IAV), RNA extracted and analyzed by RNA-seq. (A) Volcano plots for differentially expressed genes for each virus relative to mock-infected cultures. Genes involved in the IFN signaling response are indicated in green. Significance cutoffs were indicated by dotted lines for both log2 fold change values and adjested p-values (padj). (B) The number of ISGs reaching significance thresholds for each respiratory virus was quantified. (C) Heatmap generated via hierarchical clustering of IFN-related genes. Viruses were ranked in terms of degree of induction of each ISG based on DESeq2 stat values, from least upregulated (blue) to most upregulated (red). Data from mock-infected cultures was included and set to row minimum for each gene. (D) Western blot analysis of whole cell lysates collected at indicated times following infection. Time point for this analysis is matched to the time point analyzed via RNAseq, except for SARS-CoV-2, for which an additional sample at 192 hpi was included. Samples were separated via SDS-PAGE followed by transfer on to a PVDF membrane for detection using indicated antibodies.
Figure 3
Figure 3. Clearance of common cold-associated viruses is IFN-mediated.
Nasal ALI cultures were pre-treated with either ruxolitinib (RUX) or DMSO (vehicle) control at a concentration of 10 μM in the basal media for 48 hours prior to infection, followed by infection in triplicate with the indicated virus (MOI = 1, 33°C). (A) ASL was collected at the indicated time points, released virus quantified via plaque assay, and the average viral titer in each condition is shown as mean ± standard deviation (SD). (B) Trans-epithelial electrical resistance (TEER) was measured prior to infection (0 hpi) and at 48-hour intervals following infection. Average TEER values from triplicate transwells in each condition are shown as mean ± SD. Statistical significance of differences in titer (A) or TEER (B) in RUX-treated vs. control cultures was calculated by repeated measures two-way ANOVA: *, P ≤ 0.05; **, P ≤ 0.01; ***, P ≤ 0.001; ****, P ≤ 0.0001. Comparisons that were not statistically significant are not labeled. Data shown is from one experiment representative of three (A) or two (B) independent experiments, each performed in triplicate using pooled-donor nasal ALI cultures derived from four to six individual donors.
Figure 4
Figure 4. Lethal HCoVs with inactivated IFN antagonists exhibit IFN-mediated clearance.
(A–B) Western blot analysis of protein from cells lysed at indicated times post infection with (A) WT MERS-CoV and MERS-nsp15mut/ΔNS4a or (B) WT SARS-CoV-2 and SARS-CoV-2 nsp15mut. Proteins were separated via SDS-PAGE followed by transfer on to a PVDF membrane for detection using indicated antibodies. (C–D) Nasal ALI cultures were pre-treated with either ruxolitinib (RUX) or DMSO control at a concentration of 10 μM in the basal media for 48 hours prior to infection. Cultures were then infected in triplicate (MOI = 1, 33°C) with either (C) MERS-nsp15mut/ΔNS4a or WT MERS-CoV or (D) SARS-CoV-2 nsp15mut and WT SARS-CoV-2. ASL was collected at indicated time points after infection and infectious virus was quantified via plaque assay. Average viral titer for each virus/drug condition is shown as mean ± SD. Statistical significance of differences in titer between each condition was calculated by repeated measures two-way ANOVA and shown as a table: *, P ≤ 0.05; **, P ≤ 0.01; ***, P ≤ 0.001; ****, P ≤ 0.0001. Data shown is from one experiment representative of two independent experiments, each performed in triplicate using pooled-donor nasal ALI cultures derived from four to six individual donors.
Figure 5
Figure 5. Respiratory viruses are differentially sensitive to IFN pre-treatments in primary nasal epithelial cells.
IFN-β or IFN-λ (100 units/ml) was added to the basal media of nasal ALI cultures or control cultures were mock-treated. 16 hours later, cultures were infected with indicated virus (MOI = 1, 33°C). ASL collected at 24-hour intervals following infection was used for quantification of infectious virus release by plaque assay. Average viral titers are shown as mean ± SD, with plaque assay limit of detection (LOD) indicated by dotted line. Statistical significance of differences in average titer in IFN-treated cultures compared to untreated cultures was calculated via repeated measures two-way ANOVA: *, P ≤ 0.05; **, P ≤ 0.01; ***, P ≤ 0.001; ****, P ≤ 0.0001. Comparisons that were not statistically significant are not labeled. Data shown is the average of two experiments performed using independent batches of donor nasal ALI cultures, each derived from four to six donors.
Figure 6
Figure 6. Enhanced IFN responses restrict replication of common cold-associated viruses at elevated temperature.
(A,B) Nasal ALI cultures were equilibrated at indicated temperature (33°C or 37°C) for 48 hours prior to infection by HCoV-NL63 (A) or SARS-CoV-2 (B). Western blot analysis was performed using lysates of cells harvested at indicated time points. Immunoblots were probed with antibodies against indicated proteins involved in the IFN signaling response. Data shown are from one experiment representative of three independent experiments conducted in separate batches of pooled-donor nasal cultures. (C,D) Cultures were pre-treated with either RUX or DMSO at 10 μM in the basal media at the start of temperature equilibration 48 hours pre-infection. Cultures were then infected with HCoV-NL63 (C) or SARS-CoV-2 (D) in triplicate (MOI = 1), ASL collected at indicated time points and infectious virus quantified by plaque assay. Average viral titer for is shown as mean ± SD. Statistical significance of differences in titer between each condition was calculated by repeated measures two-way ANOVA and shown as a table: *, P ≤ 0.05; **, P ≤ 0.01; ***, P ≤ 0.001; ****, P ≤ 0.0001. Data shown are from one experiment representative of three independent experiments, each performed in triplicate using independent batches of pooled-donor cultures.
Figure 7
Figure 7. Omicron BA.1 exhibits a unique phenotype in primary nasal epithelial cells.
(A) Nasal ALI cultures were equilibrated at the indicated temperature for 48 hours and then infected with either SARS-CoV-2 (WA-01) or omicron BA.1 (MOI = 1). ASL was collected at indicated times and released infectious virus quantified by plaque assay. Data shown are the average from three independent experiments. (B) Western blot analysis was performed using whole cell lysates collected at indicated time points after infections with SARS-CoV-2 WA-01 or omicron BA.1 (MOI = 1, 33°C). Data shown are from one representative of four experiments conducted in independent batches of pooled-donor nasal cultures. (C) Nasal ALI cultures, pre-treated with IFN-β or IFN-λ for 16 hours were infected with either SARS-CoV-2 (WA-01) or omicron BA.1 (MOI = 1, 33°C), ASL was collected at 24-hour intervals and quantified for infectious virus by plaque assay. Data shown is the average of two independent experiments. Statistical significance of differences in titer for each virus at 33°C vs. 37°C (A) or in IFN-treated vs. untreated cultures (C) was calculated via repeated measures two-way ANOVA : *, P ≤ 0.05; **, P ≤ 0.01; ***, P ≤ 0.001; ****, P ≤ 0.0001. Comparisons that were not statistically significant are not labeled.

Similar articles

Cited by

References

    1. Booth T.F., Kournikakis B., Bastien N., Ho J., Kobasa D., Stadnyk L., Li Y., Spence M., Paton S., Henry B., et al. (2005). Detection of airborne severe acute respiratory syndrome (SARS) coronavirus and environmental contamination in SARS outbreak units. Journal of Infectious Diseases 191, 1472–1477. 10.1086/429634. - DOI - PMC - PubMed
    1. Farzal Z., Basu S., Burke A., Fasanmade O.O., Lopez E.M., Bennett W.D., Ebert C.S., Zanation A.M., Senior B.A., and Kimbell J.S. (2019). Comparative study of simulated nebulized and spray particle deposition in chronic rhinosinusitis patients. Int Forum Allergy Rhinol 9, 746–758. 10.1002/alr.22324. - DOI - PMC - PubMed
    1. Gaeckle N.T., Pragman A.A., Pendleton K.M., Baldomero A.K., and Criner G.J. (2020). The oral-lung axis: The impact of oral health on lung health. Respir Care 65, 1211–1220. 10.4187/respcare.07332. - DOI - PubMed
    1. Hou Y., Okuda K., Edwards C., Martinez D., Asakura T., Randell S., Boucher R., and Baric R. (2020). SARS-CoV-2 Reverse Genetics Reveals a Variable Infection Gradient in the Respiratory Tract. Cell 182, 429–446. - PMC - PubMed
    1. Dewitte-Orr S.J., and Mossman K.L. (2010). DsRNA and the innate antiviral immune response. Future Virol 5, 325–341. 10.2217/fvl.10.18. - DOI

Publication types