[Preprint]. 2023 Dec 21:2023.12.20.572669.
doi: 10.1101/2023.12.20.572669.

CD4+ T cells are homeostatic regulators during Mtb reinfection

Affiliations

CD4+ T cells are homeostatic regulators during Mtb reinfection

Joshua D Bromley et al. bioRxiv. .

Abstract

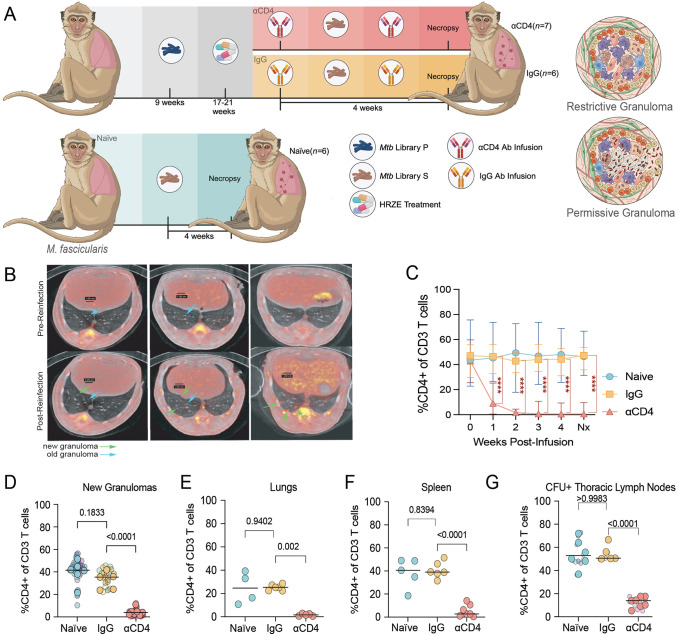
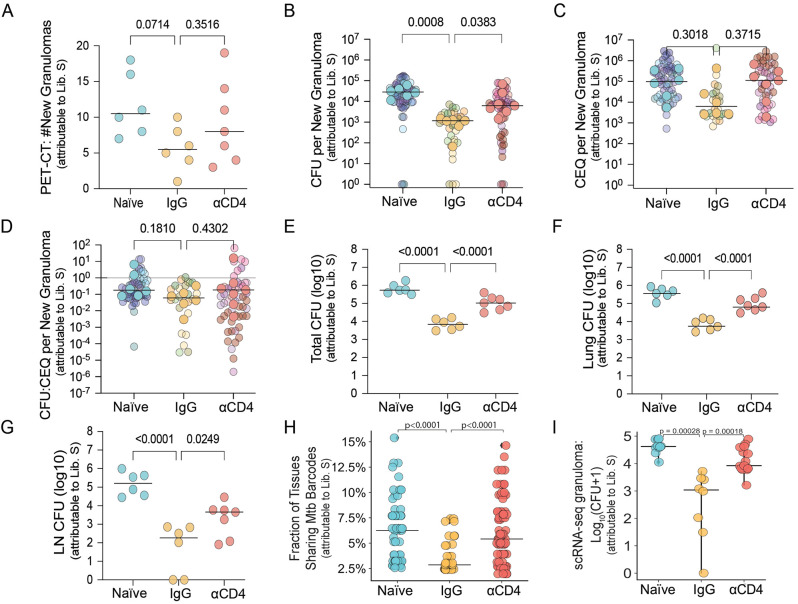
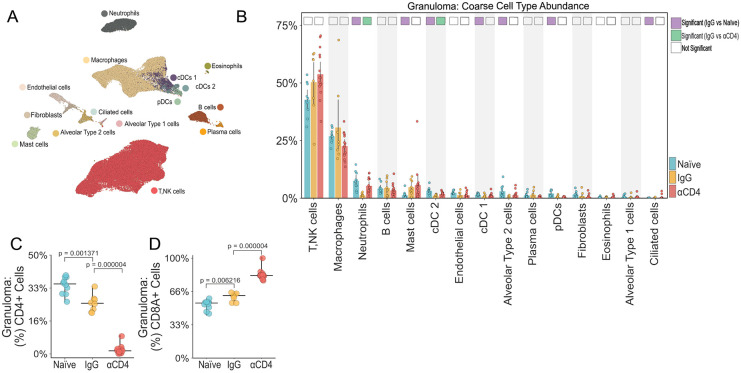
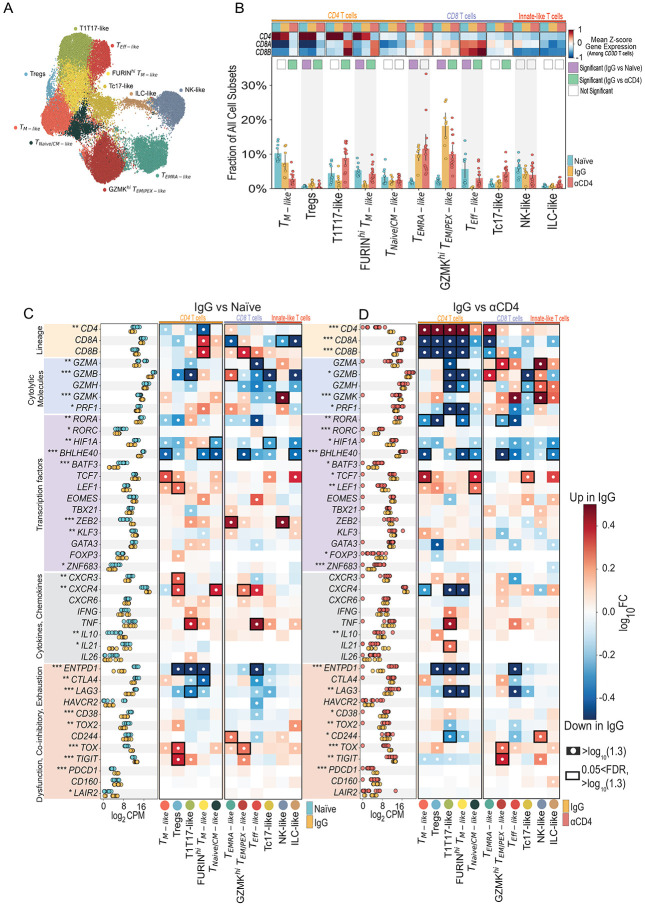
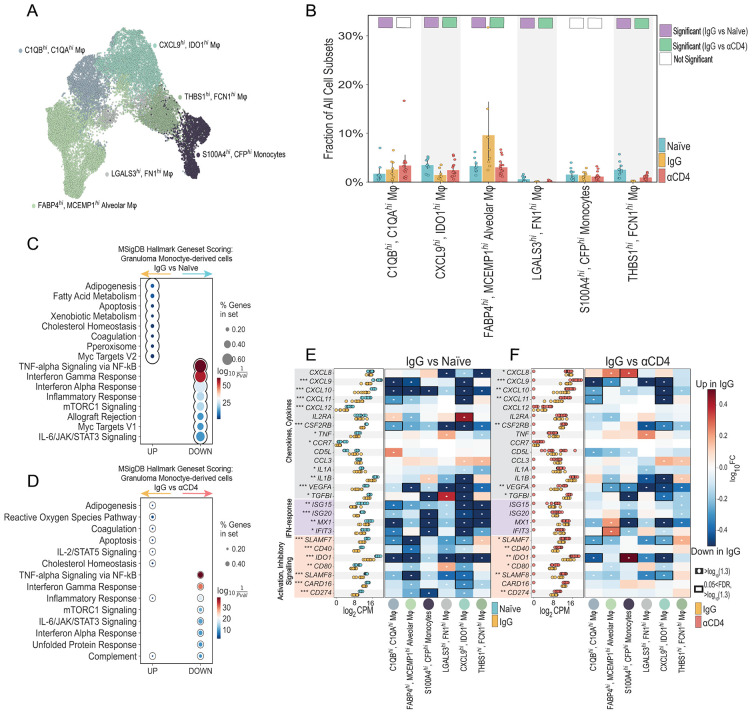
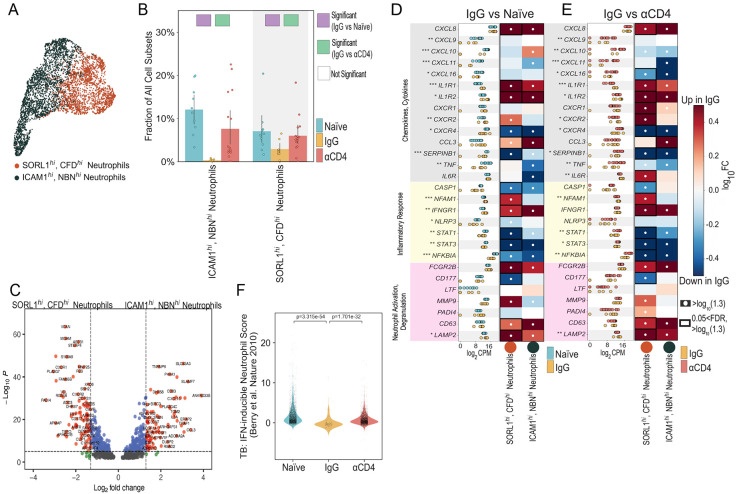
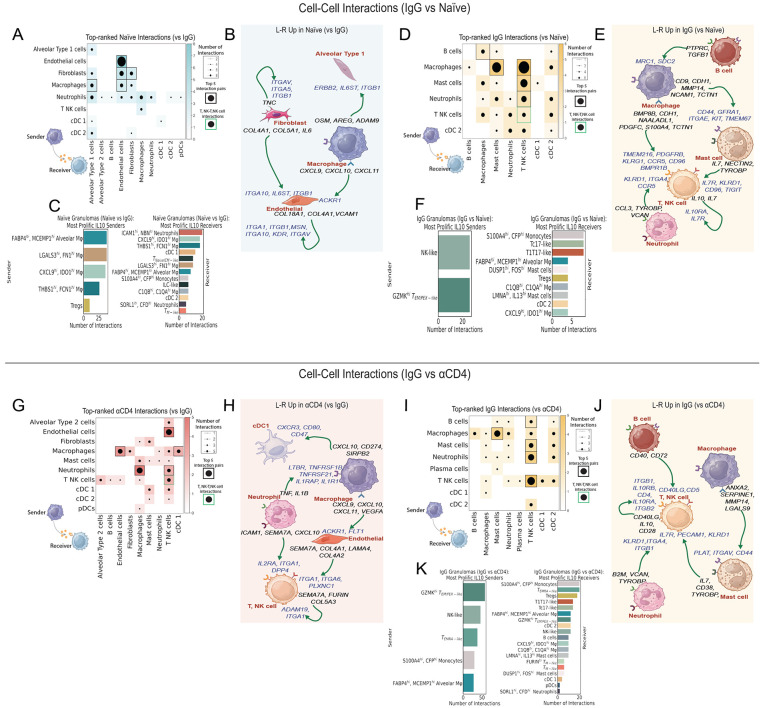
Immunological priming - either in the context of prior infection or vaccination - elicits protective responses against subsequent Mycobacterium tuberculosis (Mtb) infection. However, the changes that occur in the lung cellular milieu post-primary Mtb infection and their contributions to protection upon reinfection remain poorly understood. Here, using clinical and microbiological endpoints in a non-human primate reinfection model, we demonstrate that prior Mtb infection elicits a long-lasting protective response against subsequent Mtb exposure and that the depletion of CD4+ T cells prior to Mtb rechallenge significantly abrogates this protection. Leveraging microbiologic, PET-CT, flow cytometric, and single-cell RNA-seq data from primary infection, reinfection, and reinfection-CD4+ T cell depleted granulomas, we identify differential cellular and microbial features of control. The data collectively demonstrate that the presence of CD4+ T cells in the setting of reinfection results in a reduced inflammatory lung milieu characterized by reprogrammed CD8+ T cell activity, reduced neutrophilia, and blunted type-1 immune signaling among myeloid cells, mitigating Mtb disease severity. These results open avenues for developing vaccines and therapeutics that not only target CD4+ and CD8+ T cells, but also modulate innate immune cells to limit Mtb disease.


Conflict of interest statement

DECLARATIONS OF INTERESTS A.K.S. reports compensation for consulting and/or scientific advisory board membership from Honeycomb Biotechnologies, Cellarity, Ochre Bio, Relation Therapeutics, FL86, IntrECate Biotherapeutics, Bio-Rad Laboratories, Senda Biosciences and Dahlia Biosciences unrelated to this work. S.M.F. reports compensation for board of directors membership from Oxford Nanopore unrelated to this work.

Figures

Figure 1.
Figure 1.. Experimental design.
(A) Overview of cynomolgus macaque sample processing for clinical, microbiologic, and immunologic data (created with BioRender.com). (B) PET-CT scan of representative NHPs pre- and post-HRZE treatment. Old granulomas shown with blue arrows; new granulomas shown with green arrows. Left panel: IgG; middle panel: αCD4; right panel: naïve. (C) Fraction of CD3 expressing the cell surface marker CD4 post-antibody infusion in peripheral blood. Median and range shown (****, p<0.0001; mixed-effects model with Dunnett’s multiple comparisons test). (D) CD3+, CD4+ cells derived from TB granulomas. (E) CD3+, CD4+ cells from uninvolved lung tissue from Mtb infected macaques. (F) CD3+, CD4+ cells from the spleen of Mtb infected macaques (G) CD3+, CD4+ cells from CFU+ LNs of Mtb infected macaques. (D-G) Transparent smaller dots represent granulomas, colored by animal. Larger dots represent mean per animal and lines represent medians. One-way ANOVA with Dunnett’s multiple comparisons test.
Figure 2.
Figure 2.. Reinfection with Mtb reduces granuloma formation, as well as bacterial burden and dissemination in a CD4+ T cell dependent manner
(A) Number of new granulomas identified using PET-CT following infection with Mtb library S. Lines represent medians. One-way ANOVA with Dunnett’s multiple comparison test, adjusted p-values reported. (B) Median number of viable Mtb colony forming units (CFU) per macaque (Kruskal-Wallis with Dunn’s multiple correction). Solid dots represent the median CFU per animal; lines represent medians. Transparent dots represent the median CFU of individual granulomas. (C) Median number of chromosomal equivalents (CEQ) per macaque (Kruskal-Wallis with Dunn’s multiple correction). Solid dots represent the median CFU per animal; lines represent medians. Transparent dots represent the median CFU of individual granulomas. (D) CFU:CEQ ratio, a proxy for bactericidal activity (Kruskal-Wallis with Dunn’s multiple correction). Solid dots represent the median CFU per animal; lines represent medians. Transparent dots represent the median CFU of individual granulomas. (E) Total CFU from granuloma, uninvolved lung tissue, and thoracic lymph nodes tissue. (F) Lung CFU from granuloma and uninvolved lung tissue. (G) Thoracic lymph node CFU. (E – G) Lines represent medians. One-way ANOVA with Dunnett’s multiple comparisons test. (H) Individual granuloma Mtb CFU. Individual dots represent single granuloma subject to Seq-Well S3 scRNA-seq (Mann-Whitney U Test). (I) Fraction of tissues (lymph node, spleen, lung) sharing library S barcodes (Kruskal Wallis with Dunn’s multiple comparison test).
Figure 3.
Figure 3.. Cellular remodeling of the TB granuloma microenvironment following Mtb reinfection.
(A) UMAP embedding of Seq-Well S3 derived granuloma transcriptomes colored by coarse cell type. (B) Coarse cell type frequencies colored by experimental group. Individual dots represent single granuloma. Differentially abundant IgG vs naïve (purple) and IgG vs αCD4 (green) marked with colored square. Cell types are differentially abundant if significant using two of three methods: Mann-Whitney U test; scCODA Bayesian model, and Fishers exact test. (C) Fraction of granuloma T, NK cells expressing CD4 from Seq-Well S3 derived transcriptomes (Mann-Whitney U Test). (D) Fraction of granuloma T, NK cells expressing CD8A from Seq-Well S3 derived transcriptomes (Mann-Whitney U Test).
Figure 4.
Figure 4.. CD4+ T cells regulate T cell cellularity, cytokine flux, and immune tone in in the TB granulomas following Mtb reinfection.
(A) UMAP embedding depicting T, NK cell subpopulations identified by sub-clustering. (B) Heatmap depicts gene expression levels (mean z-score) of T cell lineage markers CD4, CD8A, and CD8B. Columns represent gene expression in individual NHP groups – Naïve (light blue), IgG (yellow), αCD4 (red). Bar plot of T, NK subpopulation frequencies among all granuloma cellular subpopulations colored by experimental group. Differentially abundant IgG vs naïve (purple) and IgG vs αCD4 (green) marked with colored square. Cell types are differentially abundant if significant using two of three methods: Mann-Whitney U test; scCODA Bayesian model, and Fishers exact test. (C-D) T, NK cell pseudobulk Log2CPM for naïve (light blue), IgG (yellow), and αCD4 (red) NHP granulomas (*** p<0.001,** p<0.01, *p<0.05; Wilcoxon rank-sum test). Heatmap depicting log10FC of lineage markers, cytolytic molecules, select transcription factors, immunoregulatory molecules, and chemokines, and cytokines (rows) for each cell type (columns) in NHP granulomas IgG vs naïve (C) or IgG vs αCD4 lesions (D). White circles indicate >log10∣1.3∣ fold change, relative to naïve or αCD4 granulomas. Black rectangles indicate 0.05 FDR and >log10∣1.3∣ fold change, relative to naïve or αCD4 granulomas.
Figure 5.
Figure 5.. Attenuated type-1 immunity among monocyte-derived transcriptomes in Mtb reinfection granulomas.
(A) UMAP embedding depicting Monocyte-derived cell identified by sub-clustering. UMAP embeddings depicting Monocyte-derived cell subpopulation densities, split by NHP cohort (B) Bar plot of Monocyte-derived progenitor frequencies, among all granuloma cell subpopulations, colored by experimental group. Individual dots represent single granuloma. Differentially abundant IgG vs naïve (purple) and IgG vs αCD4 (green) marked with colored square. Cell types are differentially abundant if significant using two of three methods: Mann-Whitney U test; scCODA Bayesian model, and Fishers exact test. (C, D) Enriched pathways from identified using differentially expressed genes (Mann-Whitney U test (Wilcoxon rank-sum) (p value<0.05)) from naïve, IgG, and αCD4 Sizes. Circles size represent to the number of genes in Hallmark Geneset, and color (Red-Blue) represents the geneset enrichment score. Genesets that are “up” (x-axis) are enriched among IgG granulomas, whereas “down” genesets are enriched among naïve (C) and αCD4 (D) granulomas, respectively. (E-F) Monocyte-derived pseudobulk Log2CPM for naïve (light blue), IgG (yellow), and αCD4 (red) NHP granulomas (*** p<0.001, ** p<0.01, *p<0.05; Wilcoxn rank-sum test). Heatmap depicting log10FC of select transcription factors, immunoregulatory molecules, and chemokines, and cytokines (rows) for each cell type (columns) in NHP granulomas IgG vs naïve (E) or IgG vs αCD4 lesions (F). White circles indicate >log10∣1.3∣ fold change, relative to naïve or αCD4 granulomas. Black rectangles indicate 0.05 FDR and >log10∣1.3∣ fold change, relative to naïve or αCD4 granulomas.
Figure 6.
Figure 6.. Neutrophil heterogeneity in the TB granuloma.
(A) UMAP embedding depicting neutrophil cell subpopulations identified by sub-clustering (B) Bar plot of neutrophil subset frequencies, among all granuloma cell subpopulations, colored by experimental group. Individual dots represent single granuloma. Differentially abundant IgG vs naïve (purple) and IgG vs αCD4 (green) marked with colored square. Cell types are differentially abundant if significant using two of three methods: Mann-Whitney U test; scCODA Bayesian model, and Fishers exact test. (C) Volcano plot depicting pseudobulk differential gene expression (DESeq2) ICAM1hi, NBNhi vs , SORL1hi, CFDhi neutrophils (for all NHP experimental groups). Volcano plot x-axis indicates the log2FC and y-axis indicates the −log10(pvalue). Vertical dashed lines represent log2FC threshold >∣1.3∣. Horizontal line indicates −log10(pvalue)>∣0.05∣ threshold. (D-E) Neutrophil pseudobulk Log2CPM for naïve (light blue), IgG (yellow), and αCD4 (red) NHP granulomas (*** p<0.001,** p<0.01, *p<0.05; Wilcoxon rank-sum test). Heatmap depicting log10FC of select transcription factors, immunoregulatory molecules, and chemokines, and cytokines (rows) for each cell type (columns) in NHP granulomas IgG vs naïve (D) or IgG vs αCD4 lesions (E). White circles indicate >log10∣1.3∣ fold change, relative to naïve or αCD4 granuloma. Black rectangles indicate 0.05 FDR and >log10∣1.3∣ fold change, relative to naïve or αCD4 granulomas. (F) Violin plots of IFN-inducible neutrophil module scores, split by NHP group. Significance by Mann-Whitney U test.
Figure 7.
Figure 7.. Differential cell-cell interactions in immunologically primed granulomas.
(A) Heatmap depiction of differential (naïve vs IgG) cell-cell interaction pairs among coarse cell types. Columns represent cell-cell interactions from the top-prioritized links – “sender” ligands and receptors differential L-R pairs specific to IgG or naïve granulomas. Heat map and dot size represent L-R interactions from the 50 top-prioritized links. Black rectangles indicate the top 5 interactions, based on number of interactions between two cell types, per NHP group. Green rectangles depict putative T, NK-T, NK interactions. (B) Cartoon depiction of (A) with differential L-R (i.e., top-prioritized linkages) specific to naïve granulomas. (C) Barplot depiction of differential cell-cell interactions among naïve granulomas. Left barplot depicts IL10+sender cellular subpopulations; right barplot represents IL10RA/RB+ cell subpopulations. Receptor-ligand and inferred interaction pairs are derived from the top 200 top-prioritized linkages. (D) Similar heatmap to that of (A), highlighting linkages specific to IgG (vs naïve) granulomas. (E) Schematic representation of the differential L-R pairs unique to IgG granulomas from (D). (F) Barplot representation of differential IL10-IL10RA/RB interactions among IgG lesions, similar to that of (C). (G) Heatmap of αCD4 (vs IgG) granulomas. (H) Schematic representation of the differential L-R pairs unique to αCD4 granulomas from (G). (I) Heatmap of IgG (vs αCD4) granulomas. (J) Schematic representation of the differential L-R pairs unique to IgG granulomas from (I). (K) Barplot representation of differential IL10-IL10RA/RB interactions among IgG lesions, similar to that of (C).

Similar articles

Cited by

References

    1. Abel L., Fellay J., Haas D.W., Schurr E., Srikrishna G., Urbanowski M., Chaturvedi N., Srinivasan S., Johnson D.H., Bishai W.R., 2018. Genetics of human susceptibility to active and latent tuberculosis: present knowledge and future perspectives. Lancet Infect. Dis. 18, e64–e75. 10.1016/S1473-3099(17)30623-0 - DOI - PMC - PubMed
    1. Ackerman J.E., Nichols A.E., Studentsova V., Best K.T., Knapp E., Loiselle A.E., 2019. Cell non-autonomous functions of S100a4 drive fibrotic tendon healing. eLife 8, e45342. 10.7554/eLife.45342 - DOI - PMC - PubMed
    1. Ahmed A., Rakshit S., Adiga V., Dias M., Dwarkanath P., D’Souza G., Vyakarnam A., 2021. A century of BCG: Impact on tuberculosis control and beyond. Immunol. Rev. 301, 98–121. 10.1111/imr.12968 - DOI - PubMed
    1. Ahrends T., Spanjaard A., Pilzecker B., Bąbała N., Bovens A., Xiao Y., Jacobs H., Borst J., 2017. CD4+ T Cell Help Confers a Cytotoxic T Cell Effector Program Including Coinhibitory Receptor Downregulation and Increased Tissue Invasiveness. Immunity 47, 848–861.e5. 10.1016/j.immuni.2017.10.009 - DOI - PubMed
    1. Almanzar N., Antony J., Baghel A.S., Bakerman I., Bansal I., Barres B.A., Beachy P.A., Berdnik D., Bilen B., Brownfield D., Cain C., Chan C.K.F., Chen M.B., Clarke M.F., Conley S.D., Darmanis S., Demers A., Demir K., de Morree A., Divita T., du Bois H., Ebadi H., Espinoza F.H., Fish M., Gan Q., George B.M., Gillich A., Gòmez-Sjöberg R., Green F., Genetiano G., Gu X., Gulati G.S., Hahn O., Haney M.S., Hang Y., Harris L., He M., Hosseinzadeh S., Huang A., Huang K.C., Iram T., Isobe T., Ives F., Jones R.C., Kao K.S., Karkanias J., Karnam G., Keller A., Kershner A.M., Khoury N., Kim S.K., Kiss B.M., Kong W., Krasnow M.A., Kumar M.E., Kuo C.S., Lam J., Lee D.P., Lee S.E., Lehallier B., Leventhal O., Li G., Li Q., Liu L., Lo A., Lu W.-J., Lugo-Fagundo M.F., Manjunath A., May A.P., Maynard A., McGeever A., McKay M., McNerney M.W., Merrill B., Metzger R.J., Mignardi M., Min D., Nabhan A.N., Neff N.F., Ng K.M., Nguyen P.K., Noh J., Nusse R., Pálovics R., Patkar R., Peng W.C., Penland L., Pisco A.O., Pollard K., Puccinelli R., Qi Z., Quake S.R., Rando T.A., Rulifson E.J., Schaum N., Segal J.M., Sikandar S.S., Sinha R., Sit R.V., Sonnenburg J., Staehli D., Szade K., Tan M., Tan W., Tato C., Tellez K., Dulgeroff L.B.T., Travaglini K.J., Tropini C., Tsui M., Waldburger L., Wang B.M., van Weele L.J., Weinberg K., Weissman I.L., Wosczyna M.N., Wu S.M., Wyss-Coray T., Xiang J., Xue S., Yamauchi K.A., Yang A.C., Yerra L.P., Youngyunpipatkul J., Yu B., Zanini F., Zardeneta M.E., Zee A., Zhao C., Zhang F., Zhang H., Zhang M.J., Zhou L., Zou J., The Tabula Muris Consortium, 2020. A single-cell transcriptomic atlas characterizes ageing tissues in the mouse. Nature 583, 590–595. 10.1038/s41586-020-2496-1 - DOI - PMC - PubMed

Publication types