[Preprint]. 2023 Dec 21:2023.12.21.572788.
doi: 10.1101/2023.12.21.572788.

Cyclin A/Cdk1 promotes chromosome alignment and timely mitotic progression

Affiliations

Cyclin A/Cdk1 promotes chromosome alignment and timely mitotic progression

Sarah Y Valles et al. bioRxiv. .

Update in

Abstract

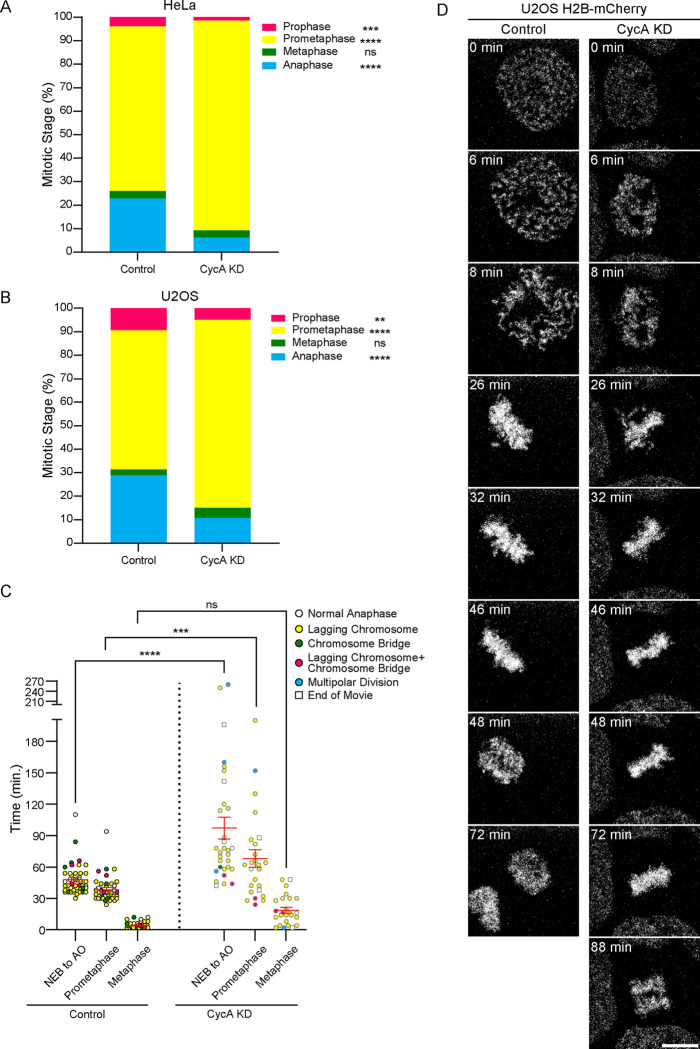
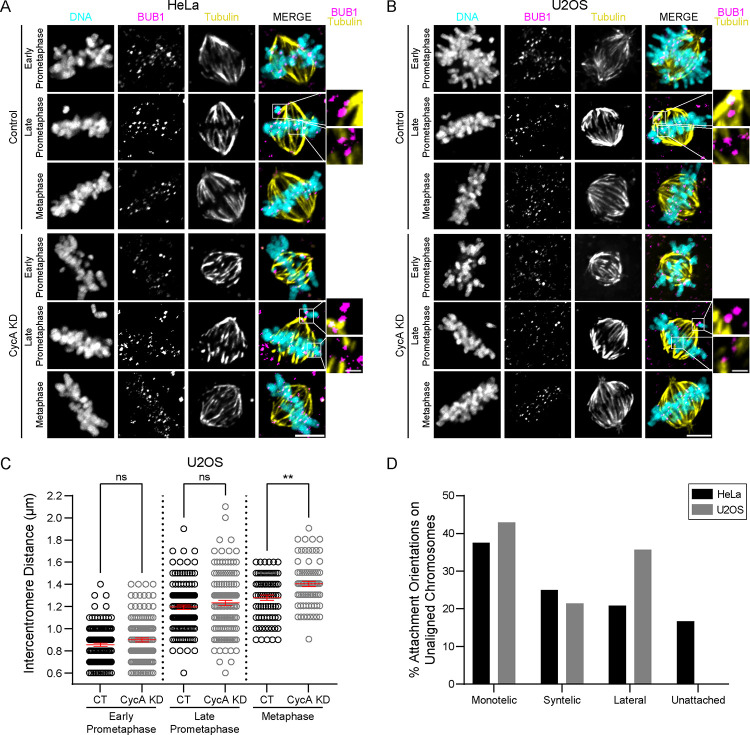
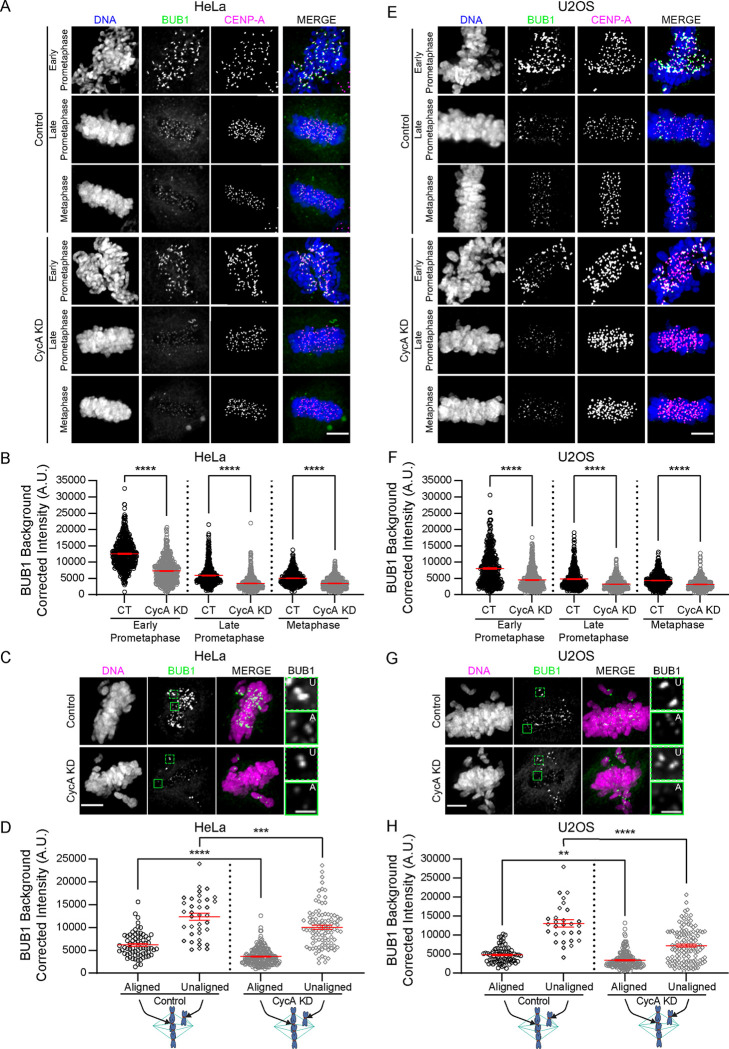
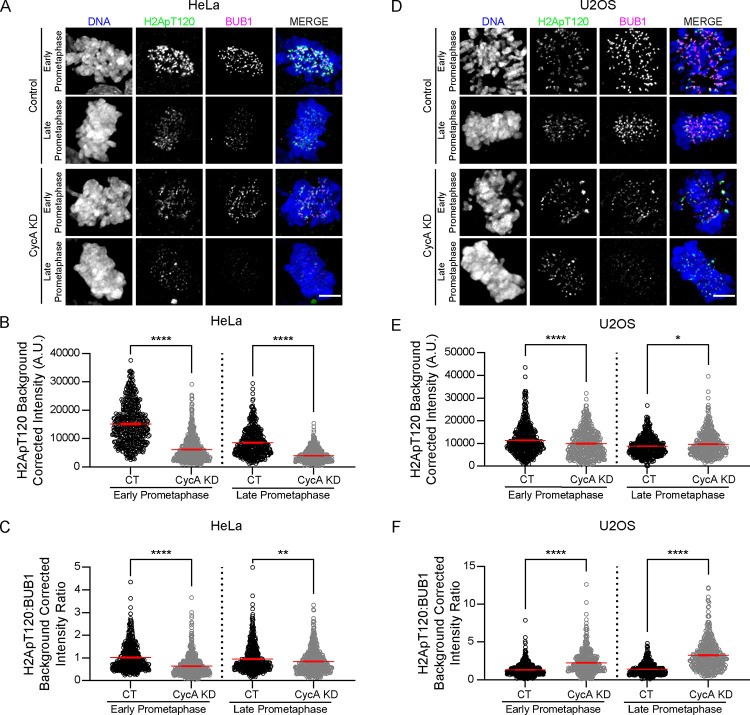
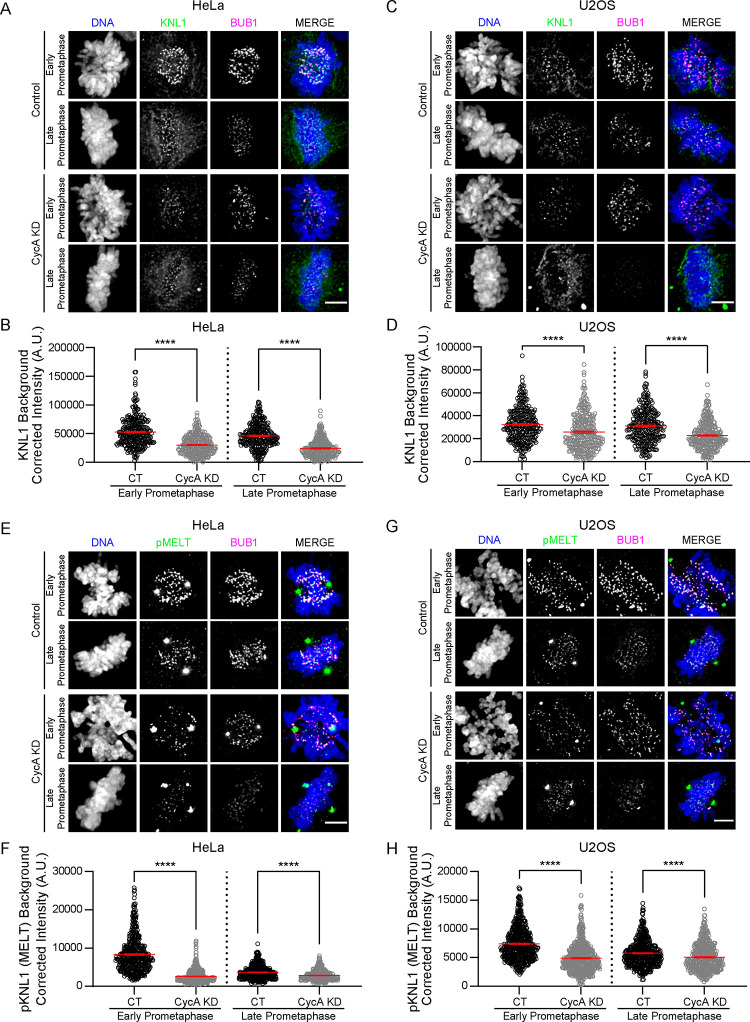
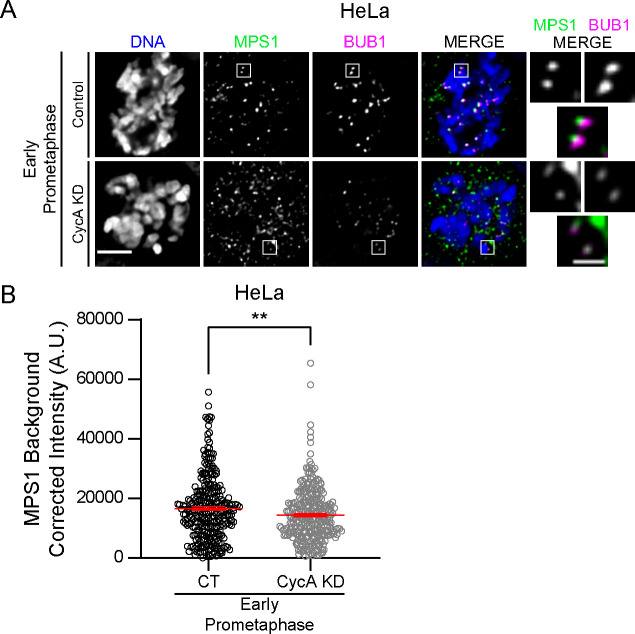
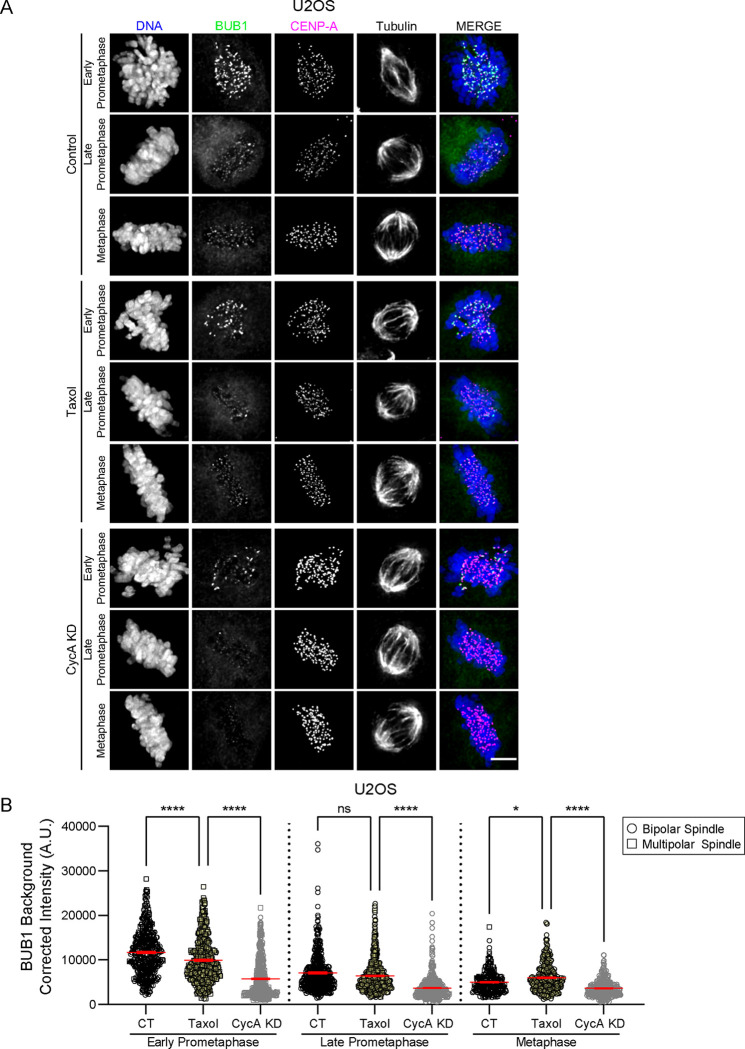
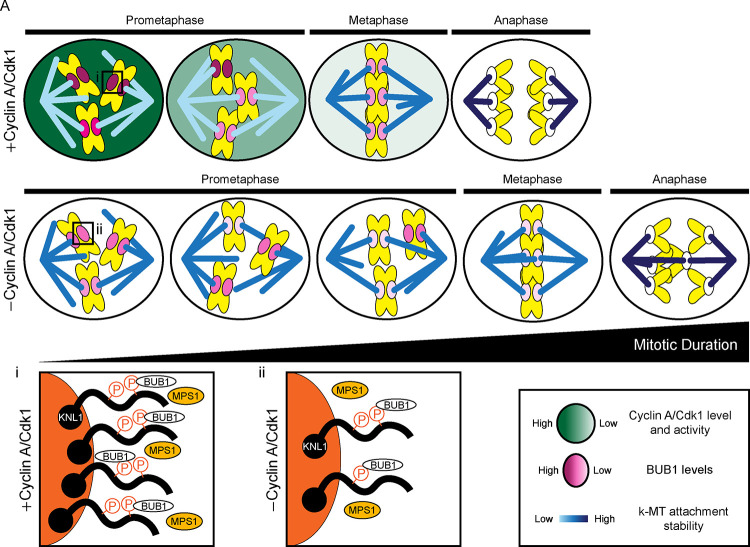
To ensure genomic fidelity a series of spatially and temporally coordinated events are executed during prometaphase of mitosis, including bipolar spindle formation, chromosome attachment to spindle microtubules at kinetochores, the correction of erroneous kinetochore-microtubule (k-MT) attachments, and chromosome congression to the spindle equator. Cyclin A/Cdk1 kinase plays a key role in destabilizing k-MT attachments during prometaphase to promote correction of erroneous k-MT attachments. However, it is unknown if Cyclin A/Cdk1 kinase regulates other events during prometaphase. Here, we investigate additional roles of Cyclin A/Cdk1 in prometaphase by using an siRNA knockdown strategy to deplete endogenous Cyclin A from human cells. We find that depleting Cyclin A significantly extends mitotic duration, specifically prometaphase, because chromosome alignment is delayed. Unaligned chromosomes display erroneous monotelic, syntelic, or lateral k-MT attachments suggesting that bioriented k-MT attachment formation is delayed in the absence of Cyclin A. Mechanistically, chromosome alignment is likely impaired because the localization of the kinetochore proteins BUB1 kinase, KNL1, and MPS1 kinase are reduced in Cyclin A-depleted cells. Moreover, we find that Cyclin A promotes BUB1 kinetochore localization independently of its role in destabilizing k-MT attachments. Thus, Cyclin A/Cdk1 facilitates chromosome alignment during prometaphase to support timely mitotic progression.


Figures

Figure 1:
Figure 1:. Cyclin A/Cdk1 promotes chromosome congression and mitotic progression.
(A, B) Percentage of mitotic cells in prophase (magenta), prometaphase (yellow), metaphase (green), and anaphase (blue) in control and Cyclin A depleted (CycA KD) HeLa (A) or U2OS cells (B). n > 600 HeLa cells or n > 500 U2OS cells from three independent experiments; ns p > 0.5, **p ≤ 0.01, ***p ≤ 0.001, and ****p ≤ 0.0001 using a two-sided Fisher’s Exact test. (C) Total mitotic duration from nuclear envelope breakdown (NEB) to anaphase onset (AO), prometaphase duration, and metaphase duration of control or CycA KD U2OS cells expressing H2B-mCherry from timelapse live-cell fluorescence imaging. Also, anaphases were categorized as normal (white circles) or with an error, including lagging chromosomes (yellow circles), lagging chromosomes and chromosome bridges (magenta circles), or multipolar divisions (blue circles). Cells with anaphases that were not observed before the end of the movie are shown as white squares. For control n = 44 cells from three independent experiments and for CycA KD n = 31 cells from five independent experiments; error bars (red) indicate SEM; ns p > 0.5; ***p ≤ 0.001 and ****p ≤ 0.0001 using a one-way ANOVA and Šídák’s multiple comparisons test. (D) Selected panels from timelapse live-cell fluorescence imaging of control or CycA KD U2OS H2B-mCherry cells. Scale bar: 10 μm. See also Supplemental Figure 1.
Figure 2:
Figure 2:. Cyclin A/Cdk1 facilitates the formation of bioriented kinetochore microtubule attachments.
(A, B) Representative images of microtubule attachments in early prometaphase, late prometaphase (with one unaligned chromosome), and metaphase in control and Cyclin A depleted (CycA KD) HeLa (A) or U2OS cells (B). Shown is DNA (cyan), BUB1 (magenta), and microtubules (yellow). For HeLa cells (A), insets show a syntelic k-MT attachment (top) and bioriented k-MT attachment (bottom) in control cells and a monotelic k-MT attachment (top) and a bioriented k-MT attachment (bottom) in CycA KD cells. For U2OS cells (B), insets show monotelic k-MT attachments (top) and bioriented k-MT attachments (bottom) in both the control and CycA KD U2OS cells. Scale bars: 5 μm or 1 μm for insets. (C) Quantification of intercentromere distance in early prometaphase, late prometaphase, and metaphase control (black) or CycA KD (gray) U2OS cells. n = 75–130 pairs of centromeres from 15–26 cells per mitotic phase. These measurements were performed on cells from the four independent experiments in Figure 7; multipolar cells were excluded; ns p > 0.05, **p ≤ 0.01, using a one-way ANOVA and Šídák’s multiple comparisons test; error bars (red) indicate SEM. (D) Percent of k-MT attachments on unaligned chromosomes classified as monotelic, syntelic, lateral, or unattached in CycA KD HeLa (black) and CycA KD U2OS (gray) cells. HeLa n = 24 unaligned chromosomes from 13 cells and U2OS n = 14 unaligned chromosomes from 6 cells.
Figure 3:
Figure 3:. Cyclin A/Cdk1 promotes BUB1 localization to kinetochores.
(A) Representative images of control or Cyclin A depleted (CycA KD) HeLa cells. Shown is DNA (blue), BUB1 (green), and CENP-A (magenta) in early prometaphase, late prometaphase, and metaphase. (B) Quantification of BUB1 protein levels at kinetochores of control (CT, black circles) and CycA KD (gray circles) HeLa cells in early prometaphase, late prometaphase, and metaphase. n > 500 kinetochores from 29–33 cells per mitotic phase. (C) Representative images of control and CycA KD HeLa cells with unaligned (U, dark green) and aligned (A, light green) chromosomes in late prometaphase. Shown is DNA (magenta) and BUB1 (green). Insets are magnified views. (D) Quantification of BUB1 protein levels at kinetochores from aligned (circles) and unaligned (diamonds) chromosomes in late prometaphase. From 7 control HeLa cells, n = 71 kinetochores from aligned chromosomes and n = 36 kinetochores from unaligned chromosomes. From 22 CycA KD HeLa cells, n = 223 kinetochores from aligned chromosomes and n = 97 kinetochores from unaligned chromosomes. (E) Representative images of control or Cyclin A depleted (CycA KD) U2OS cells. Shown is DNA (blue), BUB1 (green), and CENP-A (magenta) in early prometaphase, late prometaphase, and metaphase. (F) Quantification of BUB1 protein levels at kinetochores of control (CT, black circles) and CycA KD (gray circles) U2OS cells in early prometaphase, late prometaphase, and metaphase. n = 500 kinetochores from 30–32 cells per mitotic phase. (G) Representative images of control and CycA KD U2OS cells with unaligned (U, dark green) and aligned (A, light green) chromosomes in late prometaphase. Shown is DNA (magenta) and BUB1 (green). Insets are magnified views. (H) Quantification of BUB1 protein levels at kinetochores from aligned (circles) and unaligned (diamonds) chromosomes in late prometaphase. From 8 control U2OS cells, n = 80 kinetochores from aligned chromosomes and n = 29 kinetochores from unaligned chromosomes. From 18 CycA KD U2OS cells, n = 184 kinetochores from aligned chromosomes and n = 124 kinetochores from unaligned chromosomes. Data from (B, D, F, and H) are from three independent experiments; **p ≤ 0.01, ***p ≤ 0.001, and ****p ≤ 0.0001 using a one-way ANOVA and Šídák’s multiple comparisons test; error bars (red) indicate SEM. Scale bars (A, C, E, and G): 5 μm or 1 μm for insets. See also Supplemental Figure 2.
Figure 4:
Figure 4:. Cyclin A/Cdk1 increases the BUB1 dependent phosphorylation of H2A Thr 120 at kinetochores.
(A) Representative images of control and Cyclin A depleted (CycA KD) HeLa cells. Shown is DNA (blue), H2A pT120 (green), and BUB1 (magenta) in early and late prometaphase. (B) Quantification of H2A phosphorylated on T120 at kinetochores of control (black circles) and CycA KD (gray circles) HeLa cells. n > 500 kinetochores from 30–32 cells per mitotic phase. (C) Ratio of H2A pT120 to BUB1 intensity levels at kinetochores of control (black circles) and CycA KD (gray circles) HeLa cells. n >500 kinetochores from 30–32 cells per mitotic phase. (D) Representative images of control and Cyclin A depleted (CycA KD) U2OS cells. Shown is DNA (blue), H2A pT120 (green), and BUB1 (magenta) in early and late prometaphase. (E) Quantification of H2A phosphorylated on T120 at kinetochores of control (black circles) and CycA KD (gray circles) U2OS cells. n > 450 kinetochores from 27–31 cells per mitotic phase. (F) Ratio of H2A pT120 to BUB1 intensity levels at kinetochores of control (black circles) and CycA KD (gray circles) HeLa cells. n >450 kinetochores from 27–31 cells per mitotic phase. Data from (B and C) and (E and F) are from three independent experiments; *p ≤ 0.05 and ****p ≤ 0.0001 using a one-way ANOVA and Šídák’s multiple comparisons test; error bars (red) indicate SEM. Scale bars (A and D): 5 μm.
Figure 5:
Figure 5:. Cyclin A/Cdk1 promotes KNL1 localization to kinetochores and phosphorylation of KNL1 MELT motifs.
(A) Representative images of control and Cyclin A depleted (CycA KD) HeLa cells. Shown is DNA (blue), KNL1 (green), and BUB1 (magenta) in early and late prometaphase. (B) Quantification of total KNL1 protein levels at kinetochores of control (CT, black circles) and CycA KD (gray circles) HeLa cells. n = 300 kinetochores from 30 cells per mitotic phase. (C) Representative images of control and CycA KD U2OS cells. Shown is DNA (blue), KNL1 (green), and BUB1 (magenta) in early and late prometaphase. (D) Quantification of total KNL1 protein levels at kinetochores of control (CT, black circles) and CycA KD (gray circles) U2OS cells. n = 300 kinetochores from 30 cells per mitotic phase. (E) Representative images of control and CycA KD HeLa cells in early and late prometaphase. Shown is DNA (blue), KNL1 pMELT (green), and BUB1 (magenta). (F) Quantification of KNL1 pMELT levels at kinetochores of CT (black circles) and CycA KD (gray circles) HeLa cells. n > 450 kinetochores from 30–33 cells per mitotic phase. (G) Representative images of control and CycA KD U2OS cells in early and late prometaphase. Shown in DNA (blue), KNL1 pMELT (green), and BUB1 (magenta). (H) Quantification of KNL1 pMELT levels at kinetochores of CT (black circles) and CycA KD (gray circles) U2OS cells. n > 450 kinetochores from 31–33 cells per mitotic phase. Data from (B, D, F, and H) are from three independent experiments; ****p ≤ 0.0001 using a one-way ANOVA and Šídák’s multiple comparisons test; error bars (red) indicate SEM. Scale bars (A, C, E, and G): 5 μm.
Figure 6:
Figure 6:. Cyclin A/Cdk1 enhances MPS1 localization to kinetochores.
(A) Representative images of control and Cyclin A depleted (CycA KD) HeLa cells. Shown is DNA (blue), MPS1 (green), and BUB1 (magenta) in early prometaphase. Scale bars: 5 μm and 1 μm for inset. (B) Quantification of MPS1 protein levels at kinetochores of (CT, black circles) and CycA KD (gray circles) HeLa cells. n = 300 kinetochores from 30 cells per condition. Data are from three independent experiments; **p ≤ 0.01 using a two-tailed Student’s t test; error bars (red) indicate SEM.
Figure 7:
Figure 7:. BUB1 localization to kinetochores is independent of changes to k-MT attachment stability.
(A) Representative images of U2OS cells treated with 0.1% DMSO, 5 nM Taxol for 1 hour, or Cyclin A-depleted (CycA KD). Shown is DNA (blue), BUB1 (green), CENP-A (magenta), and microtubules (greyscale). Scale bar: 5 μm. (B) Quantification of BUB1 protein levels at kinetochores of control (CT, black circles or squares), Taxol (yellow circles or squares), or CycA KD (gray circles or squares) U2OS cells. Circles = bipolar spindles and squares = multipolar spindles. n = 225–450 kinetochores from 15–30 cells per condition for each mitotic phase from four independent experiments; ns p > 0.05, *p ≤ 0.05, ****p ≤ 0.0001 using a one-way ANOVA and Šídák’s multiple comparisons test; error bars (red) indicate SEM. See also Supplemental Figure 3.
Figure 8:
Figure 8:. Model for the roles of Cyclin A/Cdk1 in mitosis.
(A) Cyclin A/Cdk1 activity regulates multiple events in prometaphase, including the establishment of bioriented k-MT attachments, k-MT attachment stability, chromosome alignment, and mitotic progression to ensure high fidelity chromosome segregation. Compared to cells with Cyclin A/Cdk1 activity (top panel), cells lacking Cyclin A/Cdk1 activity (bottom panel) exhibit hyperstable k-MT attachments and delayed prometaphase progression due to impaired formation of bioriented k-MT attachments and chromosome congression to the spindle equator. These defects lead to mitotic errors, including lagging chromosomes in anaphase as depicted in the bottom panel anaphase. Cyclin A/Cdk1 activity in part regulates these prometaphase events by promoting the kinetochore localization of MPS1 kinase, KNL1 and its phosphorylation at MELT sites, and BUB1 kinase (insets i and ii). In the diagram, Cyclin A/Cdk1 activity and levels are represented as shades of green, mitotic duration is indicated by the black triangle, k-MT attachment stability is represented as shades of blue, and BUB1 protein levels are represented by shades of magenta.

Similar articles

References

    1. Alfonso-Pérez T, Hayward D, Holder J, Gruneberg U, and Barr FA (2019). MAD1-dependent recruitment of CDK1-CCNB1 to kinetochores promotes spindle checkpoint signaling. J Cell Biol 218, 1108–1117. - PMC - PubMed
    1. Baron AP et al. (2016). Probing the catalytic functions of Bub1 kinase using the small molecule inhibitors BAY-320 and BAY-524. Elife 5, e12187. - PMC - PubMed
    1. Bekier ME, Mazur T, Rashid MS, and Taylor WR (2015). Borealin dimerization mediates optimal CPC checkpoint function by enhancing localization to centromeres and kinetochores. Nat Commun 6, 6775. - PMC - PubMed
    1. Bodor DL, Rodríguez MG, Moreno N, and Jansen LET (2012). Analysis of Protein Turnover by Quantitative SNAP-Based Pulse-Chase Imaging. Curr Protoc Cell Biology 55, 8.8.1–8.8.34. - PubMed
    1. Brito DA, and Rieder CL (2006). Mitotic Checkpoint Slippage in Humans Occurs via Cyclin B Destruction in the Presence of an Active Checkpoint. Curr Biol 16, 1194–1200. - PMC - PubMed

Publication types