[Preprint]. 2024 Jun 1:2023.10.25.564042.
doi: 10.1101/2023.10.25.564042.

A Reinterpretation of the Relationship Between Persistent and Resurgent Sodium Currents

Affiliations

A Reinterpretation of the Relationship Between Persistent and Resurgent Sodium Currents

Samuel P Brown et al. bioRxiv. .

Update in

Abstract

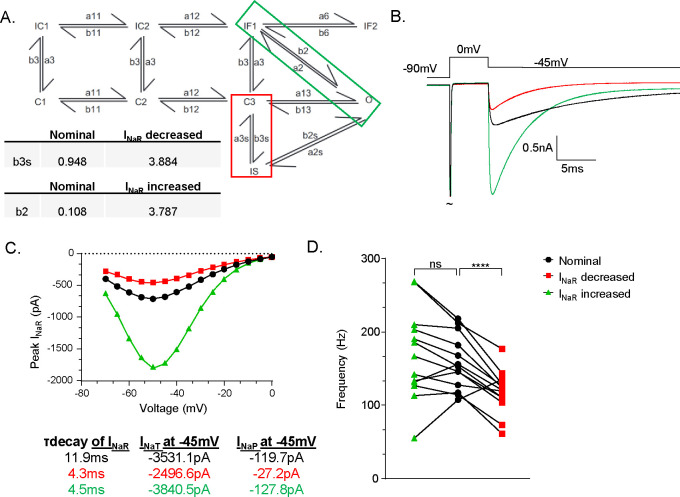
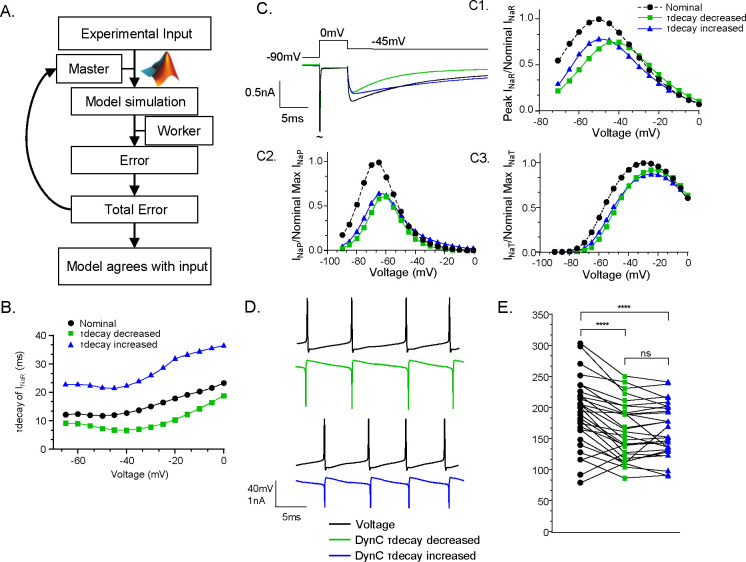
The resurgent sodium current (INaR) activates on membrane repolarization, such as during the downstroke of neuronal action potentials. Due to its unique activation properties, INaR is thought to drive high rates of repetitive neuronal firing. However, INaR is often studied in combination with the persistent or non-inactivating portion of sodium currents (INaP). We used dynamic clamp to test how INaR and INaP individually affect repetitive firing in adult cerebellar Purkinje neurons from male and female mice. We learned INaR does not scale repetitive firing rates due to its rapid decay at subthreshold voltages, and that subthreshold INaP is critical in regulating neuronal firing rate. Adjustments to the Nav conductance model used in these studies revealed INaP and INaR can be inversely scaled by adjusting occupancy in the slow inactivated kinetic state. Together with additional dynamic clamp experiments, these data suggest the regulation of sodium channel slow inactivation can fine-tune INaP and Purkinje neuron repetitive firing rates.


Conflict of interest statement

Declaration of interests The authors declare no competing interests.

Figures

Figure 1.
Figure 1.
Dynamic clamp addition of a modeled Nav conductance increases the spontaneous firing frequency of adult cerebellar Purkinje neurons A. Voltage-clamp step protocol (top) and current traces of the evoked fast-transient (INaT) and resurgent (INaR) Nav currents in an acutely dissociated Purkinje neuron (middle). The same voltage protocol was used to evoke and measure Nav currents generated by a Markov Nav conductance model. Labeled arrows depict peak INaT, INaR, and INaP on the Nav conductance model trace. B. This simulated Nav current was generated by a nine-state gating Markov matrix that includes three closed states (C1, C2, C3), two inactivated-closed states (IC1, IC2), two fast inactivated states (IF1, IF2), a slow inactivated state (IS), and an open state (O). Transition rate constant values are denoted by variables between states (see Methods). Panel C. shows a schematic of the dynamic clamp setup used to interface Nav conductance models with a current injection electrode that is patched on an adult Purkinje neuron in a sagittal brain section. A computer running SutterPatch acquisition and dynamic clamp software is interfaced with a Sutter digidata/amplifier, which is connected to the patch electrode. The computer running SutterPatch software uses voltage signals measured in the Purkinje neuron to calculate, in real-time (via the Nav conductance model) current injection values. Current injections representing the model Nav conductance are then applied to the patched cell. D. Spontaneous action potentials recorded from an adult Purkinje neuron before and after (D1) the dynamic clamp-mediated addition of the Nav conductance represented in panel B. Dynamic clamp-mediated current injections are shown in red. D2. Shows an expanded time trace of a single action potential (black) and its corresponding dynamic clamp current injection (red). E. Firing frequency of adult Purkinje neurons (open circles) was significantly (P < 0.0001, paired Student’s t-test, n = 30) increased after dynamic clamp-mediated addition of the nominal Nav conductance (closed circles). Dynamic clamp-mediated addition of Nav conductances also caused an increase in evoked repetitive firing frequencies (shown in extended data Figure 1–1). Changes in repetitive firing frequency after the addition of the nominal Nav conductance did not correlate with cell passive membrane properties (extended data Figure 1–2).
Figure 2.
Figure 2.
Adjusting peak INaR does not scale the repetitive firing frequency of Purkinje neurons A. To generate the ‘INaR decreased’ and ‘INaR increased’ models, transition rate constant values b2 (green box) and b3s (red box) were selectively adjusted. Values of the nominal and manipulated state transition variables at −45 mV are listed below the matrix. B. A simulated voltage-clamp recording of evoked INaR (at −45 mV) is shown for the nominal model (black), the ‘INaR increased’ model (green), and the ‘INaR decreased’ model (red). C. Peak INaR values were measured at various repolarizing voltage steps after a 5 ms depolarization step to 0 mV. These peak current values are plotted against voltage for the nominal model (black), ‘INaR increased’ model (green), and the ‘INaR decreased’ model (red). D. Spontaneous firing frequency of adult Purkinje neurons after dynamic clamp-mediated addition of the nominal (center, black circles), ‘INaR increased’ model (left, green triangles), and ‘INaR decreased’ model (right, red squares). Spontaneous firing frequency of the ‘INaR decreased’ model is significantly reduced compared to spontaneous firing frequencies measured during application of the nominal model. Applying the ‘INaR increased’ model resulted in no significant change in firing frequency (paired Student’s t-test, ‘INaR decreased’ vs nominal: P = 0.0042, n = 13; ‘INaR increased’ vs nominal: P = 0.21, n = 13).
Figure 3.
Figure 3.
Purkinje neuron repetitive firing rates are not affected by adjusting the time constant of INaR decay. An automated optimization procedure was used to apply targeted changes to Nav conductance models while preserving other aspects of the nominal Nav conductance model (see Methods). A schematic of this process is shown in panel A. A MATLAB script was used to apply the ‘amoeba’ algorithm, checking the difference between the simulation prediction and the target experimental values with each iteration, and ‘crawling’ through potential rate constant values in order to minimize total error. B. This amoeba method was used to generate two new Markov conductance models with targeted changes to the time constant of INaR decay. The time constant of INaR decay (τdecay) is plotted against voltage for the original nominal model and the two newly generated models, ‘τdecay decreased’ (green squares) and ‘τdecay increased’ (blue triangles). C. A simulated voltage-clamp recording of model generating INaR is shown for the nominal (black), ‘τdecay decreased’ (green), and ‘τdecay increased’ (blue) models. C1. For each model, peak INaR values are normalized to the max INaR generated by the nominal model and are plotted against voltage. Similar plots of normalized INaP and INaT are presented in panels C2. and C3., respectively. D. Representative traces showing dynamic clamp-mediated addition of the ‘τdecay reduced’ (green) and ‘τdecay increased’ (blue) conductances in the same cell. Voltage records are shown in black with the corresponding dynamic clamp current injections shown below. E. Spontaneous firing frequencies measured in Purkinje neurons after the addition of the nominal (black circles), ‘τdecay decreased’ (green squares), and ‘τdecay increased’ (blue triangles) model conductances (400 nS) are plotted with lines connecting measurements taken from the same cell. Adding the ‘τdecay decreased’ and the ‘τdecay increased’ model conductances resulted in spontaneous firing frequencies that were significantly reduced compared to firing frequencies measured after adding the nominal model conductance, however, the addition of ‘τdecay decreased’ and the ‘τdecay increased’ model conductances resulted in similar repetitive firing frequencies (paired Student’s t-test-τdecay decreased vs nominal, P < 0.0001, n = 29; τdecay increased vs nominal, P < 0.0001, n = 29; τdecay increased vs τdecay decreased, P = 0.94, n = 29).
Figure 4.
Figure 4.
Reducing the amount of INaP in the modeled conductance significantly decreases spontaneous firing frequency compared to the nominal model, while reducing INaR does not. A. Voltage-clamp simulation traces showing Nav currents generated by the nominal (black), ‘INaP reduced’ (red), and ‘INaR reduced’ (orange) models are shown with the common voltage command shown above. A1-A3. Peak INaR (A1), INaP (A2), and INaT (A3) were normalized to the peak Nav currents generated by the nominal model and are plotted against voltage. B. Representative action potential firing during dynamic clamp-mediated addition of the ‘INaR reduced’ (upper) or ‘INaP reduced’ (lower) conductance models is shown from the same Purkinje neuron. Dynamic clamp current injections are presented as orange or red traces. C. The spontaneous firing frequency of Purkinje neurons with addition of the nominal (black circles) conductance model was not significantly changed after addition of the ‘INaR reduced’ conductance model (left, orange triangles). However, this firing frequency was significantly decreased after the addition of the ‘INaP reduced’ conductance model (right, red diamonds). (Paired Student’s t-test. nominal vs ‘INaR reduced’, P = 0.21, n = 29; nominal vs ‘INaP reduced’, P < 0.0001, n = 29).
Figure 5.
Figure 5.
Applying or subtracting an isolated INaP conductance scales repetitive firing in Purkinje neurons A. A Hodgkin-Huxley (HH) modeled conductance (using 3.4 nS conductance) was used to simulate isolated INaP. The current traces presented in panel A. show voltage-clamp of this modeled conductance. B. Simulated peak INaP values versus voltage steps generated by the nominal conductance model (black, 400 nS) are compared directly to the HH model (blue, 3.4 nS). The HH model’s conductance values were adjusted so that peak INaP measurements would match the peak INaP generated by 400 nS of the nominal model. An example of applying the HH model in dynamic clamp experiments is shown to the right; the dynamic clamp current injection is presented in blue. C. Spontaneous firing frequency of Purkinje neurons with no dynamic clamp (open circles) was significantly increased after dynamic clamp addition of 3.4 nS of the HH conductance model (left, blue squares) and significantly decreased after addition of −3.4 nS of the HH conductance model (right, red triangles) (Paired Student’s t-test. no model vs 3.4 nS, P = 0.0009, n = 13; no model vs −3.4 nS, P = 0.047, n = 14). D. The percent change in repetitive firing frequency after addition (left, 3.4 nS) or subtraction (right, −3.4 nS) of the HH conductance model is plotted against the amplitude of dynamic clamp current injected during the interspike interval (see Methods) (3.4 nS, r2 = 0.68, n = 16; −3.4 nS, r2 = 0.36, n = 15).
Figure 6.
Figure 6.
Across models used for dynamic clamp, INaP is positively correlated with the changes in repetitive firing frequency. The action potential waveform shown in panel A. depicts how dynamic clamp current injection values were obtained during the interspike intervals and action potential peaks (see Methods). B. A strong correlation exists between the percent increase in spontaneous firing frequency, driven by the addition of each Markov conductance model, and the dynamic clamp current injection during the interspike interval of an action potential (r2 = 0.93). If the dynamic clamp current injection is measured at the peak of the action potential, the correlation coefficient (r2) falls to 0.004 (C.). D. There is a strong correlation between the percent increase in spontaneous firing frequency after addition of each Markov conductance model and the net INaP charge (for each model) during a −65 mV steady-state voltage-clamp step (r2 = .96; P = 0.0001). This positive correlation is absent if measurements of net INaR charge (measured at −45 mV) (E.) or net INaT charge (measured at 0 mV) (F.) are used (r2 = 0.05, P = 0.61; r2 = 0.31, P = 0.19, respectively). Pearson’s correlation tests were used to determine significance. Net charge calculations for each current component are described in Methods.
Figure 7.
Figure 7.
Simulation action potential clamp experiments were conducted using a voltage command (dashed trace, upper) that includes two action potentials that were originally recorded from a Purkinje neuron firing at ~60 Hz. The nominal (shown in black), ‘INaR reduced’ (shown in orange), and ‘INaP reduced’ (shown in red) Markov conductance models (see Figure 4) were applied to a model cell in MATLAB (see Methods). Kinetic state occupancy plots, showing occupancy in the open state, are shown below (middle traces) and are time-locked with the voltage command. The bottom traces show the time-locked evoked currents produced by the voltage command for each of these models.
Figure 8.
Figure 8.
Peak INaP and INaR can be inversely adjusted by changing rate constants responsible for slow inactivation occupancy A. To develop models with inversely scaled INaP and INaR, the state transition rate constants between the open (O) and slow inactivated (IS) states were individually altered. Decreasing the b2s (blue box) transition rate constant (in the nominal model) resulted in a conductance model with increased INaR and decreased INaP. Decreasing the a2s (red box) transition rate constant resulted in a conductance model with decreased INaR and increased INaP. These changes resulted in the simulated voltage-clamp traces that elicit the b2s reduced (blue) and a2s reduced (red) models, which are compared to the nominal model (black) in panel B. C. When compared to the nominal conductance model (black circles), spontaneous firing frequency of adult Purkinje neurons was significantly increased after addition of the a2s reduced model (red triangles, left), and significantly decreased after addition of the b2s reduced model (blue triangles, right) (paired Student’s t-test. 400 nS a2s reduced, P = 0.0004, n = 8; b2s reduced, P = 0.0029, n = 9;). D. Representative recordings of action potentials during addition of the nominal model (black, top), the a2s decreased (red, middle), and b2s decreased (blue, bottom) models (left) reveal scaling in spontaneous and evoked (see F-I plots, right) firing rates in a single Purkinje neuron. E. F. 3D plots were created in which the a2s (E.) or b2s (F.) state transition rate constants are decreased across 14 iterations and plotted as log10 against the resulting peak INaP and INaR values (measured at −45 mV).

Similar articles

References

    1. Afshari F. S., Ptak K., Khaliq Z. M., Grieco T. M., Slater N. T., McCrimmon D. R., & Raman I. M. (2004). Resurgent Na Currents in Four Classes of Neurons of the Cerebellum. Journal of Neurophysiology, 92(5), 2831–2843. 10.1152/jn.00261.2004 - DOI - PubMed
    1. Aman T. K., & Raman I. M. (2007). Subunit dependence of Na channel slow inactivation and open channel block in cerebellar neurons. Biophysical Journal, 92(6), 1938–1951. 10.1529/biophysj.106.093500 - DOI - PMC - PubMed
    1. Aman T. K., & Raman I. M. (2010). Inwardly permeating Na ions generate the voltage dependence of resurgent Na current in cerebellar Purkinje neurons. The Journal of Neuroscience: The Official Journal of the Society for Neuroscience, 30(16), 5629–5634. 10.1523/JNEUROSCI.0376-10.2010 - DOI - PMC - PubMed
    1. Carter B. C., Giessel A. J., Sabatini B. L., & Bean B. P. (2012). Transient sodium current at subthreshold voltages: Activation by EPSP waveforms. Neuron, 75(6), 1081–1093. 10.1016/j.neuron.2012.08.033 - DOI - PMC - PubMed
    1. Chen Y., Yu F. H., Surmeier D. J., Scheuer T., & Catterall W. A. (2006). Neuromodulation of Na+ channel slow inactivation via cAMP-dependent protein kinase and protein kinase C. Neuron, 49(3), 409–420. 10.1016/j.neuron.2006.01.009 - DOI - PubMed

Publication types