[Preprint]. 2024 Jan 26:2023.12.20.570816.
doi: 10.1101/2023.12.20.570816.

Neoantigen Cancer Vaccines and Different Immune Checkpoint Therapies Each Utilize Both Converging and Distinct Mechanisms that in Combination Enable Synergistic Therapeutic Efficacy

Affiliations

Neoantigen Cancer Vaccines and Different Immune Checkpoint Therapies Each Utilize Both Converging and Distinct Mechanisms that in Combination Enable Synergistic Therapeutic Efficacy

Sunita Keshari et al. bioRxiv. .

Update in

Abstract

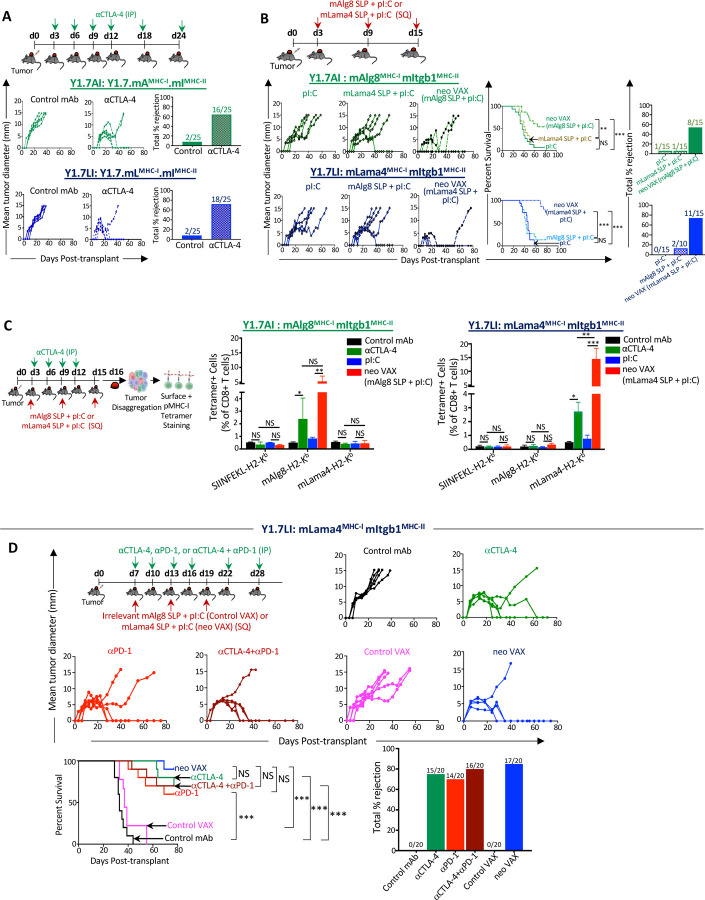
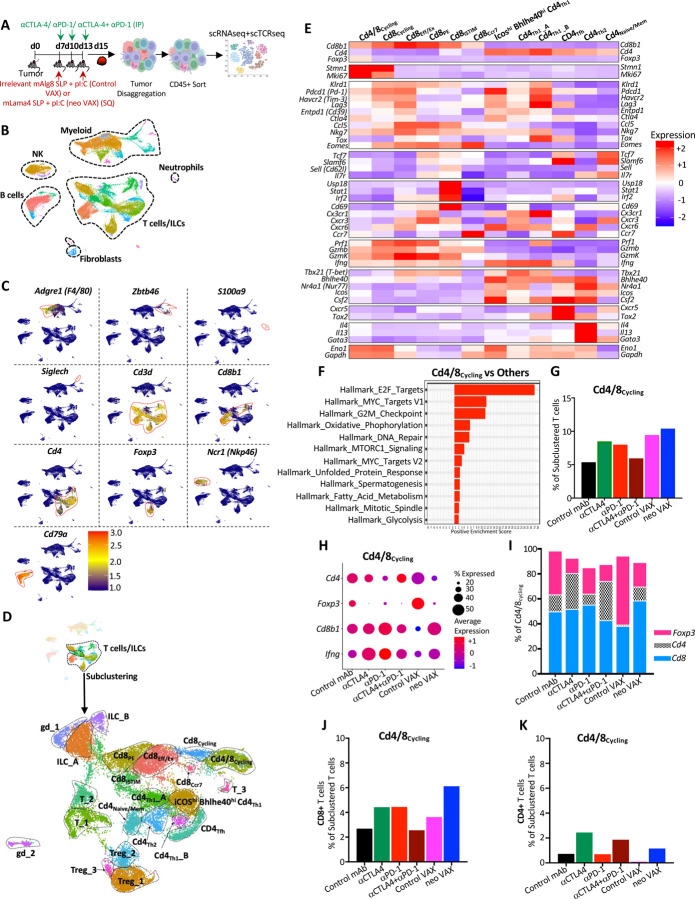
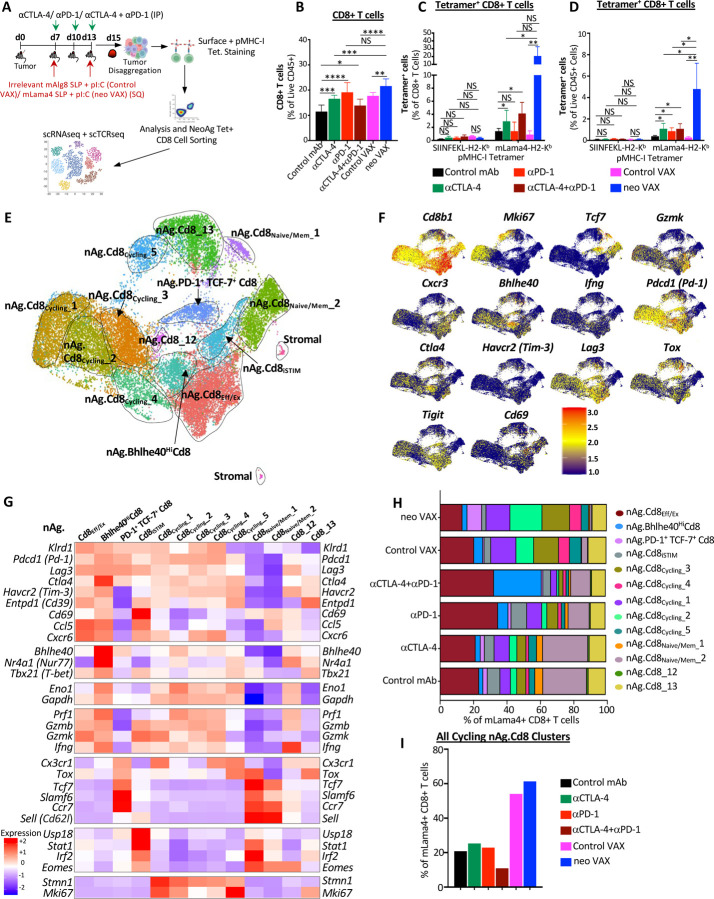
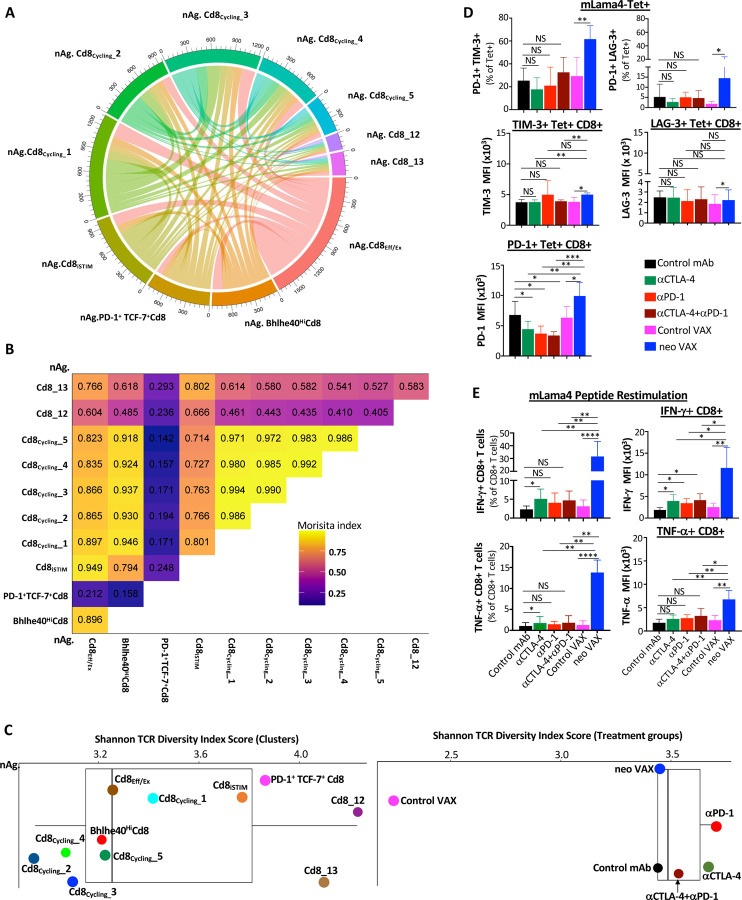
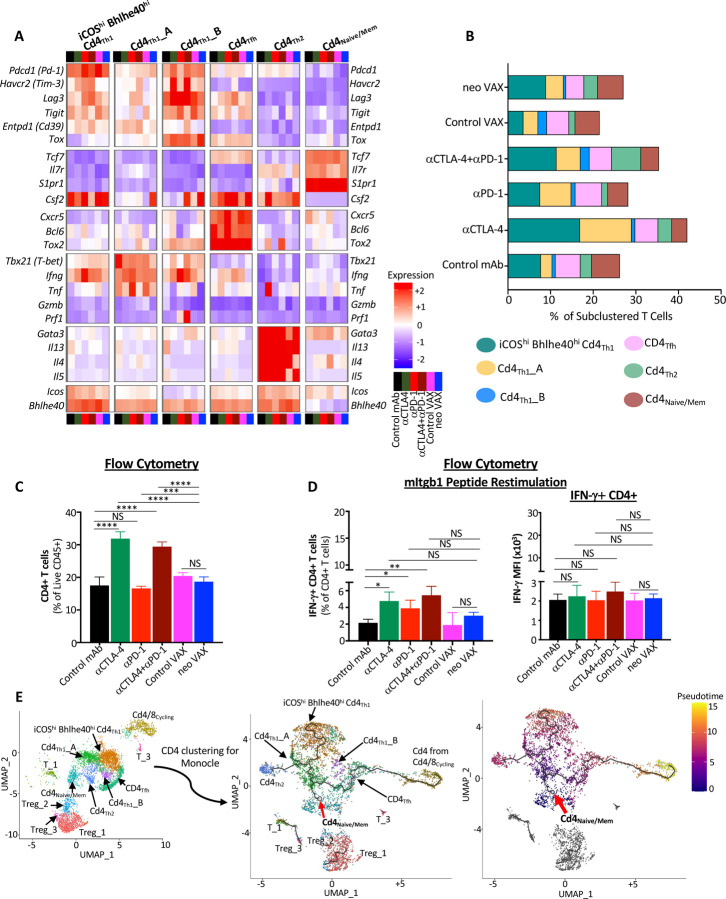
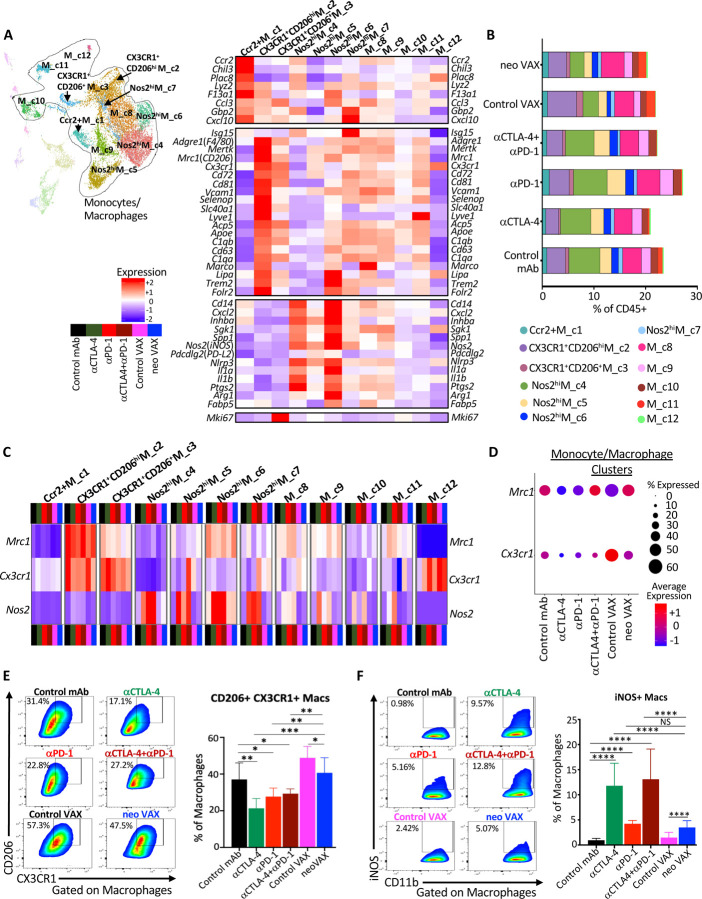
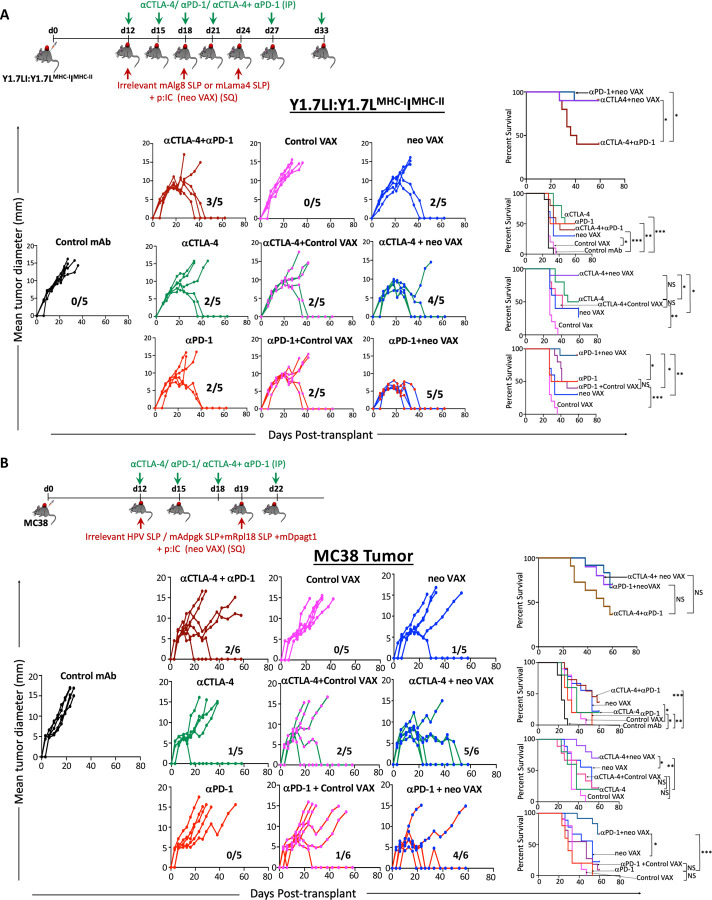
The goal of therapeutic cancer vaccines and immune checkpoint therapy (ICT) is to eliminate cancer by expanding and/or sustaining T cells with anti-tumor capabilities. However, whether cancer vaccines and ICT enhance anti-tumor immunity by distinct or overlapping mechanisms remains unclear. Here, we compared effective therapeutic tumor-specific mutant neoantigen (NeoAg) cancer vaccines with anti-CTLA-4 and/or anti-PD-1 ICT in preclinical models. Both NeoAg vaccines and ICT induce expansion of intratumoral NeoAg-specific CD8 T cells, though the degree of expansion and acquisition of effector activity was much more substantial following NeoAg vaccination. Further, we found that NeoAg vaccines are particularly adept at inducing proliferating and stem-like NeoAg-specific CD8 T cells. Single cell T cell receptor (TCR) sequencing revealed that TCR clonotype expansion and diversity of NeoAg-specific CD8 T cells relates to their phenotype and functional state associated with specific immunotherapies employed. Effective NeoAg vaccines and ICT required both CD8 and CD4 T cells. While NeoAg vaccines and anti-PD-1 affected the CD4 T cell compartment, it was to less of an extent than observed with anti-CTLA-4, which notably induced ICOS+Bhlhe40+ Th1-like CD4 T cells and, when combined with anti-PD-1, a small subset of Th2-like CD4 T cells. Although effective NeoAg vaccines or ICT expanded intratumoral M1-like iNOS+ macrophages, NeoAg vaccines expanded rather than suppressed (as observed with ICT) M2-like CX3CR1+CD206+ macrophages, associated with the vaccine adjuvant. Further, combining NeoAg vaccination with ICT induced superior efficacy compared to either therapy in isolation, highlighting the utility of combining these modalities to eliminate cancer.


Conflict of interest statement

Declaration of interests M.M. Gubin reports a personal honorarium of $1000.00 USD per year from Springer Nature Ltd for his role as an Associate Editor for the journal Nature Precision Oncology. No disclosures were reported by the other authors.

Figures

Figure 1.
Figure 1.. Therapeutic NeoAg vaccines or ICT inhibit NeoAg-expressing BrafV600E Pten−/− Cdkn2a−/− melanoma growth.
(A) Tumor growth and percent tumor rejection in wildtype (WT) C57BL/6J mice transplanted with Y1.7 mAMHC-I.mIMHC-II (Y1.7AI) and Y1.7 mLMHC-I.mIMHC-II (Y1.7LI) melanoma cells and treated with control mAb or anti-CTLA-4 immune checkpoint therapy (ICT) starting on d. 3 post tumor-transplant, and subsequently on d. 6, 9, 12, 18, 24. (B) Tumor growth, cumulative mouse survival, and percent tumor rejection in WT C57BL/6J mice transplanted with Y1.7AI and Y1.7LI melanoma cells and treated with mAlg8 or mLama4 NeoAg synthetic long peptide (SLP) plus poly I:C (pI:C) vaccines or pI:C alone starting on d. 3 post tumor-transplant and given every 6 days for 3 total doses. (C) Bar graphs displaying mAlg8 or mLama4 tetramer-specific CD8 T cells in Y1.7AI and Y1.7LI tumors treated with control mAb, anti-CTLA-4, pI:C, mAlg8 SLP + pI:C NeoAg vaccine (for Y1.7AI) or mLama4 SLP + pI:C NeoAg vaccine (for Y1.7LI) as in (A) and (B) and harvested on d. 16 post-tumor transplant. SIINFEKL-H2-Kb tetramer served as irrelevant control. (D) Tumor growth, cumulative mouse survival, and percent tumor rejection in WT C57BL/6J mice transplanted with Y1.7LI melanoma cells and treated with control mAb, anti-CTLA-4, anti-PD-1, anti-CTLA-4 + anti-PD-1, irrelevant (for Y1.7LI) mAlg8 SLP + pI:C (control VAX), or relevant mLama4 SLP + pI:C (neo VAX) starting on d. 7 post tumor-transplant, and subsequently on d. 10, 13, 16, 22, 28 for ICT and d. 13, 19 for NeoAg vaccines. Tumor growth data in (A), (B), and (D) are presented as individual mouse tumor growth as mean tumor diameter and are representative of (A) five, (B) three, or (D) four independent experiments. Tumor rejection graphs display cumulative percentage of mice with complete tumor rejection from independent experiments. Cumulative survival curves and tumor rejection graphs include mice from three independent experiments (**P < 0.01, ***P < 0.001, log-rank (Mantel–Cox) test). Bar graphs in (C), display mean ± SEM and are representative of at least three independent experiments (*P < 0.05, **P < 0.01, ***P < 0.005, NS, not significant; unpaired, two-tailed Student’s t test). See also Figure S1.
Figure 2.
Figure 2.. scRNAseq of intratumoral immune cells from Y1.7LI tumor bearing mice treated with NeoAg vaccines or ICT.
(A) Experimental setup for (B)-(K). WT C57BL/6J mice were injected with Y1.7LI melanoma cells and subsequently treated beginning on d. 7 with control mAb, anti-CTLA-4, anti-PD-1, anti-CTLA-4 + anti-PD-1, irrelevant (for Y1.7LI) mAlg8 SLP + pI:C (control VAX), or relevant mLama4 SLP + pI:C (neo VAX) and harvested on d. 15 post-tumor transplant. Intratumoral live CD45+ cells were sorted and analyzed by scRNAseq. (B) UMAP plot from scRNAseq of intratumoral CD45+ cells with annotated cell types. (C) Feature plot showing lineage-specific transcripts defining lymphoid and myeloid cell types. (D) Feature plots displaying subclustering of activated T cell-containing clusters, subclustered T cell/ILC cluster annotations (middle plot), and Cd4 and Cd8 expression (bottom plot). (E) Heat map displaying average expression of select transcripts by cluster. (F) Gene set enrichment analysis (GSEA) displaying significantly enriched gene sets in cluster Cd4/8Cycling. (G) Proliferating T cells in cluster Cd4/8Cycling by treatment condition represented as percentage of subclustered T cells. (H) Dot plot depicting expression level and percent of cells expressing Foxp3, Cd4, Cd8, Ifng in Cd4/8Cycling by treatment condition. (I) Percentage of Foxp3+ Tregs, conventional CD4 T cells, or CD8 T cells in Cd4/8Cycling by treatment condition. (J) Graph displaying CD8 T cells from cluster Cd4/8Cycling represented as percentage of total subclustered T cells. (K) Graph displaying conventional CD4 T cells from cluster Cd4/8Cycling represented as percentage of total subclustered T cells. See also Figures S4 and S5.
Figure 3.
Figure 3.. NeoAg vaccines and ICT induce shared and distinct alterations to NeoAg-specific CD8 T cells.
(A) Experimental setup for (B)-(I). WT C57BL/6J mice were injected with Y1.7LI melanoma cells and subsequently treated beginning on d. 7 with control mAb, anti-CTLA-4, anti-PD-1, anti-CTLA-4 + anti-PD-1, irrelevant (for Y1.7LI) mAlg8 SLP + pI:C (control VAX), or relevant mLama4 SLP + pI:C (neo VAX) and harvested on d. 15 post-tumor transplant. Single cell suspensions of harvested tumors were stained with SIINFEKL- or mLama4-H2-Kb PE and APC labelled tetramers and surface stained with flow antibodies for analysis or sorting of mLama4 tetramer positive CD8 T cells for scRNAseq. (B) Graph displaying CD8 T cells as a percentage of intratumoral live CD45+ cells in Y1.7LI tumors under different treatment conditions. (C) and (D) Graph displaying mLama4 tetramer-positive CD8 T cells as a percentage of (C) CD8 T cells and (D) CD45+ cells in Y1.7LI tumors under different treatment conditions. (E) UMAP plot from scRNAseq of mLama4 NeoAg-specific CD8 T cells. Cell types were annotated based on transcriptional states of NeoAg-specific CD8 T cells. (F) Feature plots displaying expression of select phenotype and lineage transcripts. (G) Heat map displaying average expression of select transcripts by cluster. (H) Bar graph displaying frequency of mLama4 NeoAg-specific CD8 T cells within each cluster by treatment condition. (I) Frequency of total mLama4 NeoAg-specific CD8 T cells within the 5 cycling clusters combined by treatment condition. See also Figures S7 and S8.
Figure 4.
Figure 4.. NeoAg-specific alpha-beta TCR clonotype expansion and diversity relates to phenotype and functional state of T cells associated with different immunotherapies.
(A) Chord diagram displaying overlapping TCR clonotypes of mLama4 NeoAg-specific CD8 T cells by cluster. (B) Morisita index values depicting overlapping TCR clonotypes of mLama4 NeoAg-specific CD8 T cells by cluster. (C) Shannon TCR diversity index by clusters and treatment groups. (D) Graphs displaying percent of PD-1+ TIM-3+/LAG-3+ or MFI of PD-1, TIM-3, or LAG-3 on PD-1+, TIM-3+, or LAG-3+ mLama4-specific CD8 T cells in Y1.7LI tumors under different treatment conditions and harvested on d. 15 post-tumor transplant. (E) Graph displaying IFN-γ+ or TNF-α+ CD8 T cells and IFN-γ or TNF-α MFI as assessed by intracellular cytokine staining of mLama4 peptide restimulated CD8 T cells isolated from Y1.7LI tumors under different treatment conditions and harvested on d. 15 post-tumor transplant. Bar graphs in (D) and (E) display mean ± SEM and are representative of at least three independent experiments (*P < 0.05, **P < 0.01, ***P < 0.005, **** P < 0.0001; NS, not significant, unpaired t test). See also Figure S10.
Figure 5.
Figure 5.. Anti-CTLA-4 induces an ICOS+ Bhlhe40+ Th1-Like subpopulation of CD4 T cells and a small Th2-Like subpopulation when combined with anti-PD-1.
(A) Heat map displaying normalized expression of select genes in each CD4 T cell cluster by treatment condition. (B) Bar graphs depicting frequency of CD4 T cells within each cluster by treatment condition. (C) Graph displaying CD4 T cells as a percentage of intratumoral live CD45+ cells as determined by flow cytometry in Y1.7LI tumors under different treatment conditions and harvested on d. 15 post-tumor transplant. (D) Graph displaying IFNγ+ CD4 T cells as assessed by intracellular cytokine staining on CD4 T cells isolated from Y1.7LI tumors under different treatment conditions and harvested on d. 15 post-tumor transplant. (E) Monocle 3-Guided Cell Trajectory of CD4 T Cell Clusters. UMAP plot displaying exclusively CD4 T cell-containing clusters (left) of all experimental conditions, CD4 T cell trajectory graph overlaid on UMAP (middle) where the origin of the inferred pseudotime is indicated by the red arrow and assigned with pseudotime score 0, and geodesic distances and pseudotime score among other CD4 T cells are calculated from there based on transcripts associated cell states. CD4 T cell clusters overlaid on Monocle3 pseudotime plot (right). Bar graphs in (C) and (D) display mean ± SEM and are representative of at least three independent experiments (*P < 0.05, **P < 0.01, ***P < 0.005, ****P < 0.0001, NS, not significant, unpaired t test). See also Figure S11.
Figure 6.
Figure 6.. NeoAg vaccines promote partially distinct macrophage remodeling from ICT.
(A) UMAP displaying sub-clustering of select myeloid clusters from CD45+ scRNAseq analysis (See Figure 2A) and heat map displaying normalized expression of select genes in each monocyte/macrophage cluster. (B) Percent monocytes/macrophages in each cluster by condition and treatment represented as percent of live CD45+ cells. (C) Heat map displaying normalized expression of Mrc1 (CD206), Cx3cr1, and Nos2 (iNOS) in each monocyte/macrophage cluster by treatment condition. (D) scRNAseq dot plot depicting expression level/percent of cells expressing Mrc1 and Cx3cr1 within all monocytes/macrophages clusters by treatment condition. (E) Representative flow cytometry plots and graph displaying CX3CR1+CD206+ macrophages in Y1.7LI tumors under different treatment conditions and harvested on d. 15 post-tumor transplant. (F) Representative flow cytometry plots and graph displaying iNOS+ macrophages in Y1.7LI tumors under different treatment conditions and harvested on d. 15 post-tumor transplant. For flow cytometry analysis in (E) and (F), dot plot displaying CX3CR1+CD206+ and iNOS+ macrophages are gated on macrophages using a gating strategy previously described. Bar graphs in (E) and (F) display mean ± SEM and are representative of at least three independent experiments (**P < 0.01, ****P < 0.0001, NS, not significant, unpaired t test). See also Figures S12 and S13.
Figure 7.
Figure 7.. NeoAg vaccines broaden the therapeutic window for anti-CTLA-4 or anti-PD-1 ICT when used in combination.
(A) Tumor growth and cumulative survival of WT C57BL/6J mice transplanted with Y1.7LI melanoma cells on d. 0 and treated beginning on d. 12 with different monotherapies: control mAb, anti-CTLA-4, anti-PD-1, irrelevant SLP + pI:C (Control VAX), or relevant mLama4 SLP + pI:C (neo VAX); or combination therapies: anti-CTLA-4 + anti-PD-1 combination ICT, anti-CTLA-4 + control VAX, anti-CTLA-4 + neo VAX, anti-PD-1 + control VAX, or anti-PD-1 + neo VAX. (B) Tumor growth and cumulative survival of WT C57BL/6J mice transplanted with MC38 cells on d. 0 and treated beginning on d. 12 with different monotherapies: control mAb, anti-CTLA-4, anti-PD-1, irrelevant HPV SLP + pI:C (Control VAX), or relevant mAdpgk SLP + mRpl18 SLP + mDpagt1 SLP + pI:C (neo VAX); or combination therapies: anti-CTLA-4 + anti-PD-1 combination ICT, anti-CTLA-4 + control VAX, anti-CTLA-4 + neo VAX, anti-PD-1 + control VAX, or anti-PD-1 + neo VAX. Tumor growth data in (A) and (B) are presented as individual mouse tumor growth as mean tumor diameter with fraction indicating (# of mice rejecting tumor)/(# of mice used in experiment) and are representative of three independent experiments. Cumulative survival curves in (A) and (B) include mice from three independent experiments (*P < 0.01, **P < 0.05, ***P < 0.001, log-rank (Mantel–Cox) test).

References

    1. Coulie P.G., Van den Eynde B.J., van der Bruggen P., and Boon T. (2014). Tumour antigens recognized by T lymphocytes: at the core of cancer immunotherapy. Nat Rev Cancer 14, 135–146. 10.1038/nrc3670. - DOI - PubMed
    1. Heemskerk B., Kvistborg P., and Schumacher T.N. (2013). The cancer antigenome. The EMBO journal 32, 194–203. 10.1038/emboj.2012.333. - DOI - PMC - PubMed
    1. Schumacher T.N., and Schreiber R.D. (2015). Neoantigens in cancer immunotherapy. Science 348, 69–74. 10.1126/science.aaa4971. - DOI - PubMed
    1. Gubin M.M., Artyomov M.N., Mardis E.R., and Schreiber R.D. (2015). Tumor neoantigens: building a framework for personalized cancer immunotherapy. J Clin Invest 125, 3413–3421. 10.1172/JCI80008. - DOI - PMC - PubMed
    1. Carreno B.M., Magrini V., Becker-Hapak M., Kaabinejadian S., Hundal J., Petti A.A., Ly A., Lie W.R., Hildebrand W.H., Mardis E.R., and Linette G.P. (2015). A dendritic cell vaccine increases the breadth and diversity of melanoma neoantigen-specific T cells. Science. 10.1126/science.aaa3828. - DOI - PMC - PubMed

Publication types