[Preprint]. 2024 Sep 16:2023.12.21.572766.
doi: 10.1101/2023.12.21.572766.

Impaired Myofibroblast Proliferation is a Central Feature of Pathologic Post-Natal Alveolar Simplification

Affiliations

Impaired Myofibroblast Proliferation is a Central Feature of Pathologic Post-Natal Alveolar Simplification

Imran S Khan et al. bioRxiv. .

Update in

Abstract

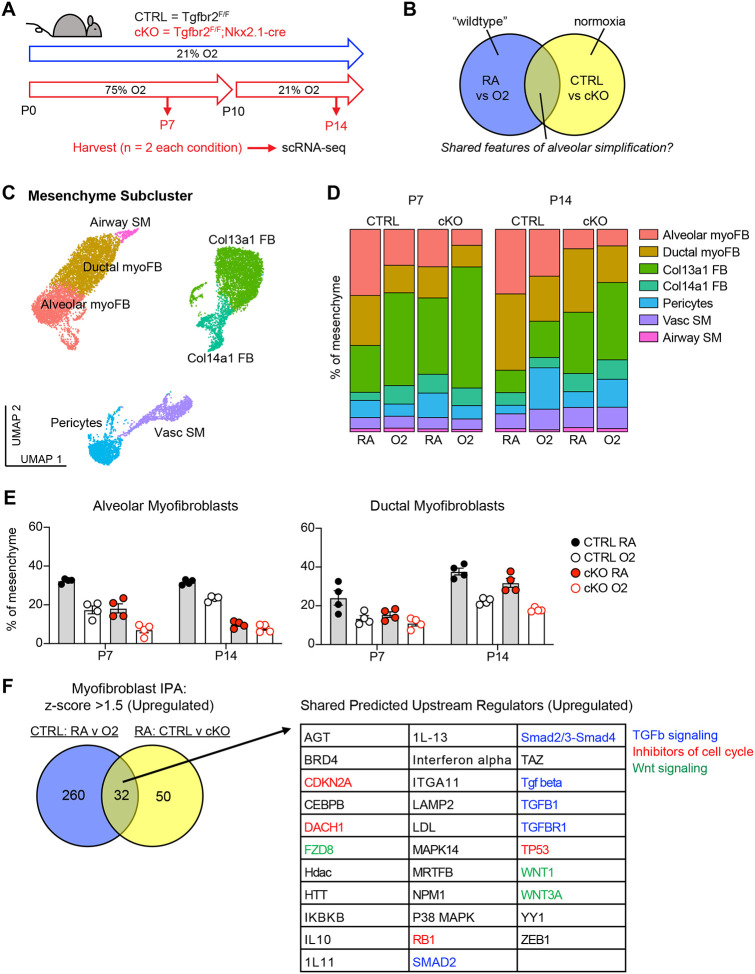
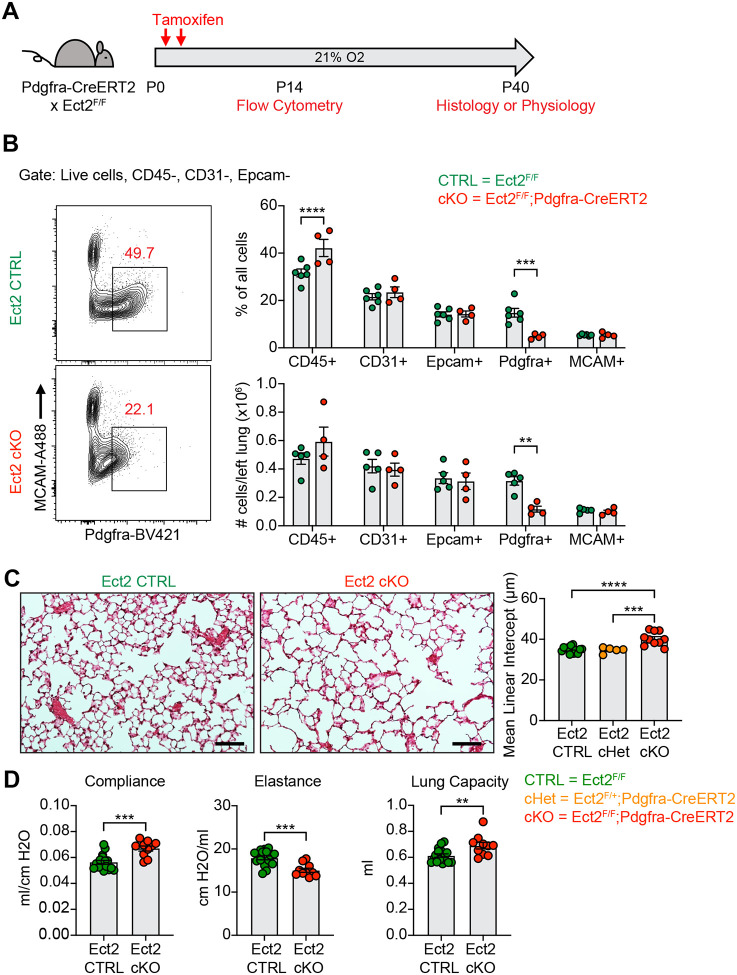
Premature infants with bronchopulmonary dysplasia (BPD) have impaired alveolar gas exchange due to alveolar simplification and dysmorphic pulmonary vasculature. Advances in clinical care have improved survival for infants with BPD, but the overall incidence of BPD remains unchanged because we lack specific therapies to prevent this disease. Recent work has suggested a role for increased transforming growth factor-beta (TGFβ) signaling and myofibroblast populations in BPD pathogenesis, but the functional significance of each remains unclear. Here, we utilize multiple murine models of alveolar simplification and comparative single-cell RNA sequencing to identify shared mechanisms that could contribute to BPD pathogenesis. Single-cell RNA sequencing reveals a profound loss of myofibroblasts in two models of BPD and identifies gene expression signatures of increased TGFβ signaling, cell cycle arrest, and impaired proliferation in myofibroblasts. Using pharmacologic and genetic approaches, we find no evidence that increased TGFβ signaling in the lung mesenchyme contributes to alveolar simplification. In contrast, this is likely a failed compensatory response, since none of our approaches to inhibit TGFb signaling protect mice from alveolar simplification due to hyperoxia while several make simplification worse. In contrast, we find that impaired myofibroblast proliferation is a central feature in several murine models of BPD, and we show that inhibiting myofibroblast proliferation is sufficient to cause pathologic alveolar simplification. Our results underscore the importance of impaired myofibroblast proliferation as a central feature of alveolar simplification and suggest that efforts to reverse this process could have therapeutic value in BPD.


Figures

Figure 1.
Figure 1.. Neonatal Hyperoxia Treatment and Loss of Epithelial TGFβ Signaling Both Cause Alveolar Simplification.
(A) Wildtype C57BL/6 mice were treated in 75% hyperoxia versus normoxia from P0–P10 and recovered in room air until harvest at P40 for analysis by either histology or lung physiology. (B) H&E sections of representative lungs from (A) harvested at P40 (left) with quantification of mean linear intercept (right). (C) Mice treated as in (A) and harvested for lung physiology measurements of compliance, elastance and lung capacity. (D) TGFbr2F/F and TGFbr2F/F;Nkx2.1-cre littermates were treated in hyperoxia versus normoxia from P0–P10 and recovered in room air until harvest at P40 for analysis by histology. (E) H&E sections of representative lungs from (D) harvested at P40 (left) with quantification of mean linear intercept (right). (F) Normoxia cohort treated as in (D) and harvested for lung physiology measurements of compliance, elastance and lung capacity. Data in (B), (C), and (F) compared by 2-tailed unpaired Student’s t-test. Data in (E) compared by ANOVA with Fisher’s post hoc test. Error bars depict mean ± SEM. **p<0.01, ***p<0.001, ****p<0.0001. Scale bars = 100 μm.
Figure 2.
Figure 2.. Loss of PDGFRα+ Cells With Neonatal Hyperoxia Treatment and Loss of Epithelial TGFβ Signaling.
(A) Wildtype C57BL/6 mice were treated in 75% hyperoxia versus normoxia from P0–P10 and harvested on P10 for analysis by flow cytometry. Graph on right shows total cells per left lung as quantified by flow cytometry. (B) Representative flow cytometry plots of the lung mesenchyme (live, CD45−, CD31−, and Epcam−) with gates depicting PDGFRα+ cells (left). Major cell populations of the lung were defined by the indicated cell surface markers and shown as either a percentage of all cells (top) or as absolute number (bottom). (C) TGFb2F/F and TGFbr2F/F;Nkx2.1-cre littermates were maintained in normoxic conditions from P0–P10 and harvested on P10 for analysis by flow cytometry. Graph on right shows total cells per left lung as quantified by flow cytometry. (D) Flow cytometry plots for (C) using the same gating strategy as described above. Data in (A-D) analyzed by 2-tailed unpaired Student’s t-test. Error bars depict mean ± SEM. *p<0.05, **p<0.01, ***p<0.001, ****p<0.0001.
Figure 3.
Figure 3.. scRNA-seq Reveals Loss of Myofibroblasts in Both Models of Alveolar Simplification.
(A) Schematic of scRNA-seq project showing CTRL (TGFbr2F/F) and cKO (TGFbr2F/F;Nkx2.1-cre) littermates treated in 75% hyperoxia versus normoxia from P0–P10 and harvested on P7 or P14 for FACS-purification and analysis by scRNA-seq. n=2 mice harvested for each genotype, treatment condition and timepoint. (B) Venn-diagram depicting strategy to compare these two models to identify shared features of alveolar simplification. (C) UMAP projection of mesenchymal cells from scRNA-seq as outlined in (A). (D) Bar graphs depicting the frequency of each cell type by treatment condition, genotype, and timepoint. (E) The frequency of alveolar and ductal myofibroblasts within the mesenchyme as depicted in (D) with each data point representing either a biologic or technical replicate. Because the data depicts both biologic and technical replicates, no statistics were performed on this data set. (F) Differentially expressed genes in myofibroblasts were identified by comparing either CTRL RA vs O2 cells or RA CTRL vs cKO cells. These lists were subsequently analyzed by Qiagen IPA to identify predicted upstream regulators for each comparison. The Venn-diagram on left depicts the number of overlapping predicted upstream regulators with z-score >1.5 (upregulated), while the table on right lists these 32 shared upstream regulators. Blue = TGFβ signaling, red = inhibitors of cell cycle, green = Wnt signaling.
Figure 4.
Figure 4.. NicheNet Ligand-Receptor Analysis of Epithelial-Mesenchymal Crosstalk in Both Models of Alveolar Simplification.
scRNA-seq data was analyzed using the NicheNet software package. (A) Alveolar epithelial clusters were pooled to define sender population and myofibroblast clusters were pooled to define receiver population. By analyzing differential expression of ligands, receptors, and downstream gene expression changes in myofibroblasts, NicheNet predicted increased (left) or decreased (right) ligand-receptor signaling in each comparison of interest. Gray boxes show ligands expressed on the epithelium and the purple-shaded boxes indicate the corresponding receptors expressed on myofibroblasts. Upper panels compare hyperoxia versus normoxia in CTRL cells. Lower panels compare CTRL versus cKO cells in normoxia. (B) List of ligand-receptor pairs predicted to be increased in both injury models. TGFβ1-TGFbr2 pairings highlighted in blue. (C) List of ligand-receptor pairs predicted to be decreased in both injury models. Pdgfa-Pdgfra and Pdgfb-Pdgfrb pairings highlighted in red.
Figure 5.
Figure 5.. Inhibiting TGFβ Disrupts Alveolar Development and Exacerbates Hyperoxia-induced Injury.
(A) Wildtype C57BL/6 mice were injected every other day from P2–P10 with PBS or 1D11 (pan-TGFβ-blocking antibody), treated in 75% hyperoxia treatment versus normoxia from P0–P10, and recovered in room air until harvest at P40 for analysis by either histology or lung physiology. (B) H&E sections of representative lungs from (A) harvested at P40 (left). Images shown are from PBS and 30 mg/kg 1D11 treatment groups. Mean linear intercepts calculated for all treatment groups (right). (C) PBS- and 30 mg/kg 1D11-treated mice treated in normoxic conditions as in (A) and harvested for lung physiology measurements of compliance, elastance and lung capacity at P40. Data in (B) compared by ANOVA with Fisher’s post hoc test; for readability and limitations of graphing, only the statistical significance values within normoxia or hyperoxia cohorts are plotted. Data in (C) compared by 2-tailed unpaired Student’s t-test. Error bars depict mean ± SEM. *p<0.05, **p<0.01, ****p<0.0001. Scale bars = 100 μm.
Figure. 6.
Figure. 6.. Deletion of αv-integrins in Lung Mesenchyme Impairs Alveolar Development and Worsens Hyperoxia-induced Injury.
(A) ItgavF/F and ItgavF/F;Gli1-CreERT2 littermates were injected with tamoxifen on P2 and P4, treated in 75% hyperoxia versus normoxia from P0–P10, and recovered in room air until harvest at P40 for analysis by either histology or lung physiology. (B) H&E sections of representative lungs from (A) harvested at P40 (left). Mean linear intercepts calculated for all treatment groups (right). (C) Normoxia cohort treated as in (A) and harvested for lung physiology measurements of compliance, elastance and lung capacity. Data in (B) compared by ANOVA with Fisher’s post hoc test. Data in (C) compared by 2-tailed unpaired Student’s t-test. Error bars depict mean ± SEM. *p<0.05, **p<0.01, ****p<0.0001. Scale bars = 100 μm.
Figure 7.
Figure 7.. Impaired Proliferation of PDGFRα+ Fibroblasts With Neonatal Hyperoxia Treatment.
(A) Wildtype C57BL/6 mice were treated in 75% hyperoxia versus normoxia from P0–P10 and recovered in room air until indicated timepoints for analysis. Mice were injected with EdU 24 hours prior to each analysis timepoint. (B) Flow cytometry plots of lung mesenchyme (CD45−, CD31−, Epcam−, MCAM−) show gating of PDGFRα+ cells (upper panels) and subsequent identification of EdU+/PDGFRα+ cells (lower panels). Panels on far-right show an EdU-untreated littermate used to define EdU+ gate. (C) Time course graphs showing indicated populations of the lung as percent of lung (top), total cells in left lung (middle), and percent EdU+ cells (bottom). Data graphed as mean ± with exception of EdU+ panel in which each animal is plotted individually. Data compared by 2-tailed unpaired Student’s t-test. *p<0.05, **p<0.01, ***p<0.001, ****p<0.0001.
Figure 8.
Figure 8.. Impaired PDGFRα+ Cell Proliferation is a Conserved Feature Across Multiple Models of Alveolar Simplification.
(A) TGFb2F/F and TGFbr2F/F;Nkx2.1-cre littermates were maintained in normoxic conditions from P0–P7, injected with EdU on P6, and harvested 24 hours later on P7 for flow cytometry. (B) Flow cytometry plots of lung mesenchyme (CD45−, CD31−, Epcam−, MCAM−) show gating of PDGFRα+ cells (left panels) and subsequent identification of EdU+/PDGFRα+ cells (right panels). Graphs on far right show major cell populations of the lung by percentage (upper graphs) and percent EdU-positive within each of these populations (lower graphs). (C) Wildtype C57BL/6 mice were injected every other day from P2–P8 with PBS or 30 mg/kg 1D11 (pan-TGFβ-blocking antibody) in normoxic conditions, injected with EdU on P9, and harvested 24 hours later on P10 for flow cytometry. (D) Flow cytometry plots of lung mesenchyme (CD45−, CD31−, Epcam−, MCAM−) show gating of PDGFRα+ cells (left panels) and subsequent identification of EdU+/PDGFRα+ cells (right panels). Graphs on far right show major cell populations of the lung by percentage (upper graphs) and percent EdU-positive within each of these populations (lower graphs). Data in analyzed by 2-tailed unpaired Student’s t-test. Error bars depict mean ± SEM. *p<0.05, **p<0.01, ***p<0.001, ****p<0.0001.
Figure 9.
Figure 9.. Blocking Proliferation of PDGFRα+ Fibroblasts is Sufficient to Cause Alveolar Simplification.
(A) Ect2F/F and Ect2F/F;Pdgfra-CreERT2 littermates were injected with tamoxifen on P2 and P4 in normoxic conditions. Mice were analyzed by flow cytometry on P14 or aged until P40 for analysis by either histology or lung physiology. (B) Representative flow cytometry plots of the lung mesenchyme (live, CD45−, CD31−, and Epcam−) with gates depicting PDGFRα+ cells (left). Major cell populations of the lung were defined by the indicated cell surface markers and shown as either a percentage of all cells (top) or as absolute number (bottom). (C) H&E sections of representative lungs from (A) harvested at P40 (left). Mean linear intercepts calculated for all treatment groups (right). (D) Mice treated as in (A) and harvested for lung physiology measurements of compliance, elastance and lung capacity. Data in (B) compared by 2-tailed unpaired Student’s t-test. Data in (C) compared by ANOVA with Fisher’s post hoc test. Error bars depict mean ± SEM. **p<0.01, ***p<0.001, ****p<0.0001. Scale bars = 100 μm.

Similar articles

References

    1. Jobe AJ. The new BPD: an arrest of lung development. Pediatr Res 1999;46:641–3. - PubMed
    1. Thebaud B, Goss KN, Laughon M, et al. Bronchopulmonary dysplasia. Nat Rev Dis Primers 2019;5:78. - PMC - PubMed
    1. Northway WH Jr., Rosan RC, Porter DY. Pulmonary disease following respirator therapy of hyaline-membrane disease. Bronchopulmonary dysplasia. N Engl J Med 1967;276:357–68. - PubMed
    1. Oak P, Hilgendorff A. The BPD trio? Interaction of dysregulated PDGF, VEGF, and TGF signaling in neonatal chronic lung disease. Mol Cell Pediatr 2017;4:11. - PMC - PubMed
    1. Saito A, Horie M, Nagase T. TGF-beta Signaling in Lung Health and Disease. Int J Mol Sci 2018;19. - PMC - PubMed

Publication types