[Preprint]. 2023 Dec 20:2023.12.19.571985.
doi: 10.1101/2023.12.19.571985.

Characterizing Molecular and Synaptic Signatures in mouse models of Late-Onset Alzheimer's Disease Independent of Amyloid and Tau Pathology

Affiliations

Characterizing Molecular and Synaptic Signatures in mouse models of Late-Onset Alzheimer's Disease Independent of Amyloid and Tau Pathology

Kevin P Kotredes et al. bioRxiv. .

Update in

Abstract

Introduction: MODEL-AD is creating and distributing novel mouse models with humanized, clinically relevant genetic risk factors to more accurately mimic LOAD than commonly used transgenic models.

Methods: We created the LOAD2 model by combining APOE4, Trem2*R47H, and humanized amyloid-beta. Mice aged up to 24 months were subjected to either a control diet or a high-fat/high-sugar diet (LOAD2+HFD) from two months of age. We assessed disease-relevant outcomes, including in vivo imaging, biomarkers, multi-omics, neuropathology, and behavior.

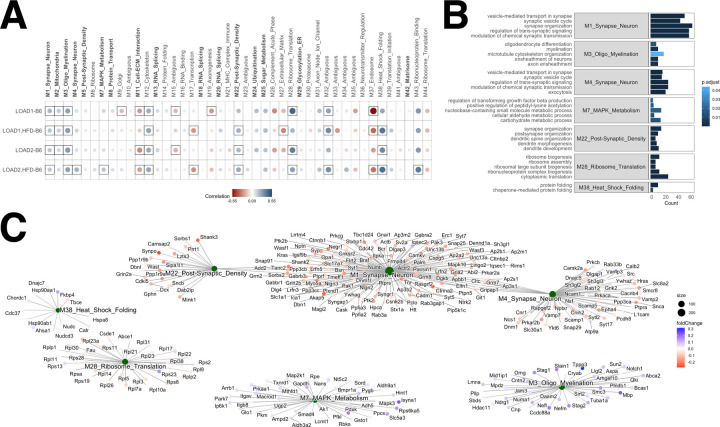
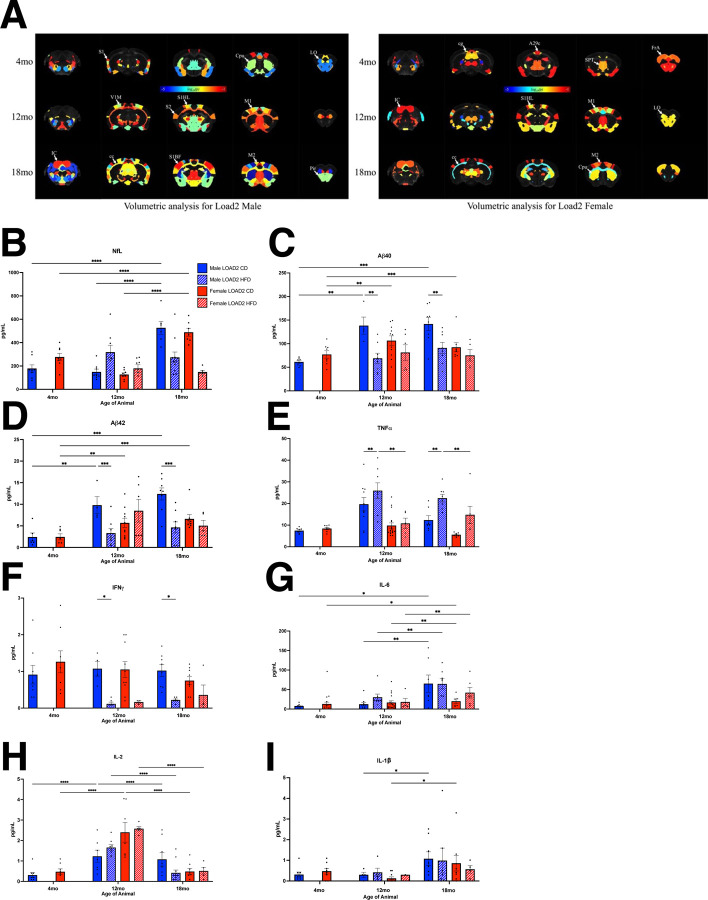
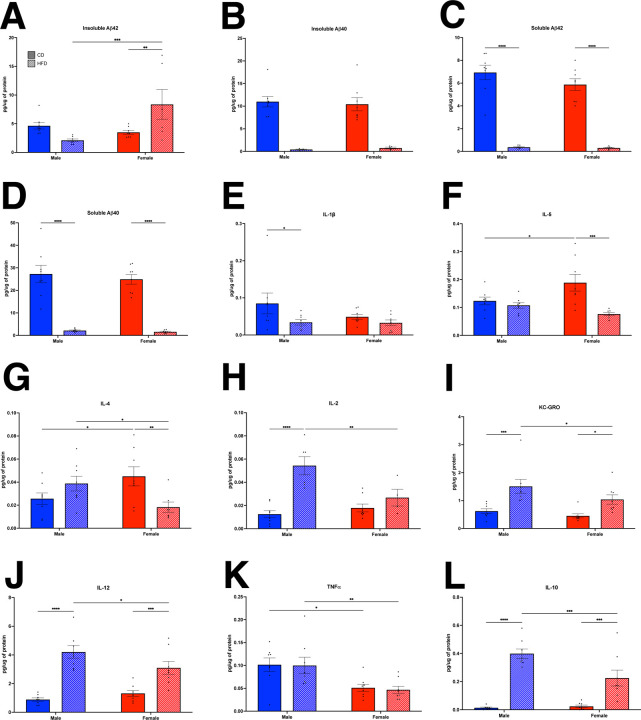
Results: By 18 months, LOAD2+HFD mice exhibited cortical neuron loss, elevated insoluble brain Aβ42, increased plasma NfL, and altered gene/protein expression related to lipid metabolism and synaptic function. In vivo imaging showed age-dependent reductions in brain region volume and neurovascular uncoupling. LOAD2+HFD mice also displayed deficits in acquiring touchscreen-based cognitive tasks.

Discussion: Collectively the comprehensive characterization of LOAD2+HFD mice reveal this model as important for preclinical studies that target features of LOAD independent of amyloid and tau.

Keywords: APOE4; Alzheimer’s disease; LOAD; MODEL-AD; TREM2; genetics; high-fat diet; late-onset Alzheimer’s disease.


Conflict of interest statement

Conflicts of Interest The authors declare that this research was conducted in the absence of any commercial or financial relationships that could be construed as a potential conflict of interest.

Figures

FIGURE 1:
FIGURE 1:
Longitudinal metabolic and behavioral phenotyping of mice on high-fat diet. LOAD1 (APOE4/Trem2*R47H) and LOAD2 (hAbeta/APOE4/Trem2*R47H) animal strains differ in the App allele with a humanized Abeta1–42 region (G601R, F606Y, R609H in the mouse gene, corresponding to amino acid positions 676, 681, 684 in the human APP locus) (A). Alignment of mouse (top; Uniprot ID P12023) and humanized (bottom; Uniprot ID P05067) amyloid precursor protein (APP) amino acid sequences. White letters denote non-homology. Red arrows indicate cleavage sites of processing enzymes. Yellow arrows denote sites of humanizing mutations in App allele (LOAD1, top, and LOAD2, bottom). (Cohort 1) Animals of an 18-month longitudinal cohort were assayed at 4-, 12-, and 18-months of age. Males and females, of LOAD1 and LOAD2 genotypes, fed either control diet (CD) or high-fat diet (HFD) beginning at 2-months of age were measured for body weight (B), fasted blood glucose (C), and frailty assay index score (D), as a measure of general animal health changes. Running wheel assay measured average animal activity time for three days and nights at the 18-month age timepoint (E). Spontaneous alternation behavioral assay was utilized to measure cognition longitudinally across ages at the 18-month age timepoint (F). (Three-way ANOVA [sex, genotype, diet effects]; *=p<0.05)
FIGURE 2:
FIGURE 2:
Neuropathological assessment of brain tissue. Immunohistochemistry of brain tissue in the cortex and hippocampus from 18-month-old animals stained for cell markers to reveal genotype- and diet-driven differences in glial cell densities. Slices of brain hemispheres were stained with (A,B) NeuN (neurons) or (C,D) IBA1 (microglia) (representative cortical images shown from LOAD2 females with DAPI co-stain) and counted relative to area. Astrocytes (GFAP) quantitated in the hippocampus of LOAD2 females fed either CD or HFD (E-F). ThioS staining of brain tissue to visualize amyloid plaques (representative images shown from LOAD2 females) (G). Inlay: scaled image of 12mo B6J.APP-SAA hyper-amyloid positive controls. LISA testing for neurofilament light-chain (NfL) in plasma derived from terminal, peripheral blood samples at 18-months of age. Linear regression analyses were performed to identify effect of each factor on NfL levels (H). (NeuN=neuronal marker; ThioS=amyloid plaques; GFAP=astrocyte marker; IBA1=microglial marker. Scale bar equals 100μm.)
FIGURE 3:
FIGURE 3:
A gene module associated with AD biomarkers is driven by age and high-fat high-sugar diet. The lightyellow gene module was associated with advanced ages (p < 0.001) and both genotype on HFD (p < 0.05), while the turquoise module was associated with age only (p < 0.001) (A). Correlations between the turquoise and lightyellow module eigengenes. Lightyellow was significantly correlated with frailty score, body weight, NfL, and many plasma cytokines (IL-1β, IL-2, IL-12p70, IL-10, IL-5, IL-6, KC-GRO), while the age-driven turquoise module was correlated with behavioral assay (frailty score and body weights) and weakly correlated with a few plasma cytokines (IL-2, IFNγ) and inflammatory cell counts (IBA1 and GFAP counts) (B). Positive correlation coefficients are shown in blue and negative correlations in red, proportional to color intensity and circle size, with frames for significant correlations (FDR < 0.05). AD-related biological domain enrichment analysis in the age and HFD driven lightyellow module gene set using Fisher exact test, with the top six enriched GO terms within each enriched bidomain (C). Network of genes in each enriched biological domain and the lightyellow module (D).
FIGURE 4:
FIGURE 4:
LOAD mice exhibit proteomics changes similar to human LOAD. Correlation coefficients between 18-month-old LOAD mouse models and 44 human proteomics co-expression modules [Johnson et al Ravi’s Ref 9] (A). Modules in bold face were significantly correlated to one or more AD traits. Circles corresponds to positive (blue) and negative (red) Pearson correlation coefficients for protein expression changes in LOAD mice (log fold change of LOAD strains versus B6J) and human disease (log fold change for cases versus controls). Color intensity and size of the circles are proportional to the Pearson correlation coefficient, with significant correlations (p < 0.05) framed. LOAD1 and LOAD2 mice were significantly and positively correlated (p < 0.05) with multiple human AD modules, primarily related to synaptic function. Five top enriched GO terms for proteins with common directional changes for 18-month-old LOAD2 mice on HFD and human AD cases (B). Protein module network with common directional changes for 18-month-old LOAD2 mice on HFD and human proteomics modules (C). Blue (red) nodes correspond to increased (reduced) protein abundance in both 18-month-old LOAD2 HFD mice compared to B6J mice and human AD cases versus controls.
FIGURE 5.
FIGURE 5.
High fat diet reduces brain volume in multiple brain regions and alters plasma biomarkers. Volume statistics maps for LOAD2 male at 4 months, 12 months and 18 months. The significant brain areas were overlaid over gray scale subject template image. (The p-values were converted into logarithmic scale between range −5 to −1. S1, Primary Somatosensory Cortex; Cpu, striatum; LO, Lateral Orbital Cortex; V1M, Primary Visual Cortex, Monocular area; S2, Secondary Somatosensory Cortex; S1HL Primary Somatosensory Cortex, Hindlimb; S1BF Primary Somatosensory Cortex, Barrel Field; M1, Primary Motor Cortex; M2 Secondary Motor Cortex; IC Inferior Colliculus; cc Corpus Callosum; Pir, Piriform cortex. Volume statistics maps for Load2 female at 4 months, 12 months and 18 months. The significant brain areas were overlaid over gray scale subject template image. The p-values were converted into logarithmic scale between range −5 to −1. A29c, Cingulate Cortex; cg, Cingulum; SPT, Septum; FrA, Frontal Association Area; IC, Inferior Colliculus; S1HL, Primary Somatosensory Cortex, Hindlimb; LO, Lateral Orbital Cortex; M1 Primary Motor Cortex; M2 Secondary Motor Cortex; cc, Corpus Callosum; Cpu, Striatum) (A). At 12 months of age, NfL is increased in high fat diet males, but not in females (B). However, by 18 months of age, aging has a greater effect on NfL, with increases in NfL between 12 and 18 months in both males and female mice. Plasma Aβ40 is reduced in high fat diet males at 12 and 18 months of age but is unchanged in female mice at any timepoint (C). Aβ42 is not altered by a high fat diet (D). TNF-α is increased in male mice on a high fat diet at both 12 and 18 months of age (E). Females have increased TNF-α at 18 months of age, but it does not reach the level of significance. IFNγ is reduced at 12- and 18-month male mice on a high fat diet (F). IL-6 is increased in male mice between 12–18 months of age, but there is no effect of high fat diet (G). In females, IL-6 is not altered. IL-2 increases between 4–12 months in males and females regardless of diet (H). By 18 months, IL-2 is reduced in both males and females. IL-1β increases with age between 12–18 months regardless of diet (I). *p<0.05, **p<0.01, ***p<0.001, ****P<0.0001.
FIGURE 6:
FIGURE 6:
Brain biomarkers in a longitudinal cohort of LOAD2 mice fed a high fat diet. At 18 months, insoluble Aβ42 is increased in female mice on a high-fat diet (A), however, insoluble Aβ40 is decreased in both sexes (B). Soluble Aβ40 (C) and Aβ42 (D) are both reduced at 18 months in high fat diet animals of both sexes. IL-1β is reduced in males on a high fat diet (E) but remains unchanged in females. IL-5 (F) is unchanged in male mice, but is reduced in females on a HFD. IL-4 (G) is also reduced in females fed a HFD. IL-2 (H) is increased in males, but not females. KC-GRO (I) and IL-12 (J) are increased in both males and female mice on a high fat diet. TNF-α (K) remains unchanged on a high fat diet. IL-10 (L) was significantly increased in males and females on HFD. *p<0.05, **p<0.01, ***p<0.001, ****P<0.0001.
FIGURE 7:
FIGURE 7:
Neurovascular Uncoupling of LOAD1 and LOAD2 mouse models. The degree of neurovascular coordination in LOAD1 (A) and LOAD2 mouse models (B) conditioned on high-fat diet (HFD), we performed uncoupling analysis. (Left) Uncoupling analysis chart in male (blue) and female (red) mice at 12 months, with many brain regions showing significant decreases in metabolism with increases in perfusion. LOAD2 animals aged to 18 months (C) were similarly analyzed. (Upper Right) Female and (Lower Right) Male p-value males showing which regions were significantly different for perfusion, metabolism, and uncoupling.
FIGURE 8:
FIGURE 8:
Comprehensive validation of LOAD2 mouse model for preclinical drug testing. As a confirmation and extension of initial characterization data of the LOAD2 mouse model conditioned on high-fat diet (HFD) to serve as a potential model for preclinical testing, independent cohorts were evaluated for disease trajectory of serial plasma biomarkers and cognitive testing. A) Illustration of timeline and procedures; B) plasma TNF-α (pg/mL); C) Plasma IL-6 (pg/mL); D) plasma IL-10 (pg/mL); E. Plasma IL-1β (pg/mL); F) plasma IFNy (pg/mL), G) plasma IL-5 (pg/mL); H) plasma KC-GRO (pg/mL); I) plasma IL-2 (pg/mL); J) plasma Aβ40 (pg/mL); K) plasma Aβ42 (pg/mL); L) calculated Aβ 42:40 ratio in plasma; M) Learning curves of aged (14+ month) LOAD2 mice ± HFD in comparison to age- and sex-matched WT controls during the acquisition phase of the touchscreen cognitive testing battery. Plasma cytokines and plasma Aβ were measured using MesoScale Discovery multiplex ELISA kits (in accordance with the manufacturer’s protocol.

References

    1. Baumgart M, Snyder HM, Carrillo MC, Fazio S, Kim H, Johns H. Summary of the evidence on modifiable risk factors for cognitive decline and dementia: A population-based perspective. Alzheimers Dement. 2015;11(6):718–26. Epub 20150601. doi: 10.1016/j.jalz.2015.05.016. - DOI - PubMed
    1. Boyd RJ, Avramopoulos D, Jantzie LL, McCallion AS. Neuroinflammation represents a common theme amongst genetic and environmental risk factors for Alzheimer and Parkinson diseases. J Neuroinflammation. 2022;19(1):223. Epub 20220908. doi: 10.1186/s12974-022-02584-x. - DOI - PMC - PubMed
    1. Solfrizzi V, Panza F, Frisardi V, Seripa D, Logroscino G, Imbimbo BP, Pilotto A. Diet and Alzheimer’s disease risk factors or prevention: the current evidence. Expert Rev Neurother. 2011;11(5):677–708. doi: 10.1586/ern.11.56. - DOI - PubMed
    1. Biogen. FDA Approves Updated ADUHELM™ Prescribing Information to Emphasize Population Studied in Clinical Trials 2021. [cited 2023 11/21]. Available from: https://investors.biogen.com/news-releases/news-release-details/fda-appr....
    1. FDA. FDA Converts Novel Alzheimer’s Disease Treatment to Traditional Approval 2023. [cited 2023 11/21]. Available from: https://www.fda.gov/news-events/press-announcements/fda-converts-novel-a....

Publication types