

This is a preprint.
Within-subject changes in methylome profile identify individual signatures of early-life adversity, with a potential to predict neuropsychiatric outcome
- PMID: 38187766
- PMCID: PMC10769190
- DOI: 10.1101/2023.12.16.571594
Within-subject changes in methylome profile identify individual signatures of early-life adversity, with a potential to predict neuropsychiatric outcome
Update in
-
Individual longitudinal changes in DNA-methylome identify signatures of early-life adversity and correlate with later outcome.Neurobiol Stress. 2024 May 31;31:100652. doi: 10.1016/j.ynstr.2024.100652. eCollection 2024 Jul. Neurobiol Stress. 2024. PMID: 38962694 Free PMC article.
Abstract
Background: Adverse early-life experiences (ELA), including poverty, trauma and neglect, affect a majority of the world's children. Whereas the impact of ELA on cognitive and emotional health throughout the lifespan is well-established, it is not clear how distinct types of ELA influence child development, and there are no tools to predict for an individual child their vulnerability or resilience to the consequences of ELAs. Epigenetic markers including DNA-methylation profiles of peripheral cells may encode ELA and provide a predictive outcome marker. However, the rapid dynamic changes in DNA methylation in childhood and the inter-individual variance of the human genome pose barriers to identifying profiles predicting outcomes of ELA exposure. Here, we examined the relation of several dimensions of ELA to changes of DNA methylation, using a longitudinal within-subject design and a high threshold for methylation changes in the hope of mitigating the above challenges.
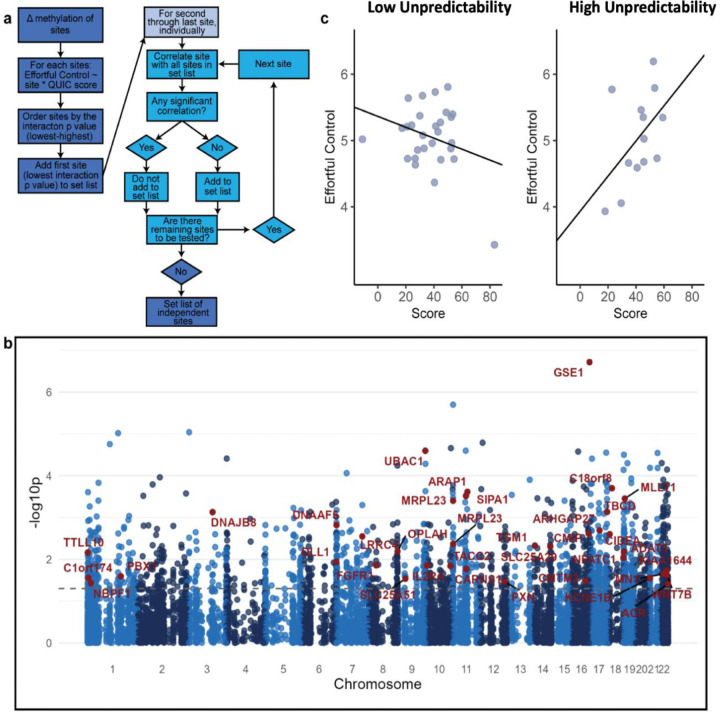
Methods: We analyzed DNA methylation in buccal swab samples collected twice for each of 110 infants: neonatally and at 12 months. We identified CpGs differentially methylated across time, calculated methylation changes for each child, and determined whether several indicators of ELA associated with changes of DNA methylation for individual infants. We then correlated select dimensions of ELA with methylation changes as well as with measures of executive function at age 5 years. We examined for sex differences, and derived a sex-dependent 'impact score' based on sites that most contributed to the methylation changes.
Findings: Setting a high threshold for methylation changes, we discovered that changes in methylation between two samples of an individual child reflected age-related trends towards augmented methylation, and also correlated with executive function years later. Among the tested factors and ELA dimensions, including income to needs ratios, maternal sensitivity, body mass index and sex, unpredictability of parental and household signals was the strongest predictor of executive function. In girls, an interaction was observed between a measure of high early-life unpredictability and methylation changes, in presaging executive function.
Interpretation: These findings establish longitudinal, within-subject changes in methylation profiles as a signature of some types of ELA in an individual child. Notably, such changes are detectable beyond the age-associated DNA methylation dynamics. Future studies are required to determine if the methylation profile changes identified here provide a predictive marker of vulnerabilities to poorer cognitive and emotional outcomes.
Keywords: Adverse Childhood Experiences; Biomarkers; DNA methylation; early-life adversity; epigenetic clocks; executive control; methylomics; precision medicine; stress; within-subject design.
Conflict of interest statement
Declaration of interests The authors declare no conflicts of interest.
Figures


Similar articles
-
Individual longitudinal changes in DNA-methylome identify signatures of early-life adversity and correlate with later outcome.Neurobiol Stress. 2024 May 31;31:100652. doi: 10.1016/j.ynstr.2024.100652. eCollection 2024 Jul. Neurobiol Stress. 2024. PMID: 38962694 Free PMC article.
-
Dimensional early life adversity and anxiety symptoms: A network analysis and longitudinal study.Child Abuse Negl. 2025 Feb;160:107201. doi: 10.1016/j.chiabu.2024.107201. Epub 2024 Dec 27. Child Abuse Negl. 2025. PMID: 39731875
-
Early-life adversity severity, timing, and context type are associated with SLC6A4 methylation in emerging adults: Results from a prospective cohort study.Psychoneuroendocrinology. 2024 Dec;170:107181. doi: 10.1016/j.psyneuen.2024.107181. Epub 2024 Sep 14. Psychoneuroendocrinology. 2024. PMID: 39298801
-
The effects of early life adversity on children's mental health and cognitive functioning.Transl Psychiatry. 2022 Jun 10;12(1):244. doi: 10.1038/s41398-022-02001-0. Transl Psychiatry. 2022. PMID: 35688817 Free PMC article. Review.
-
Bridging Basic and Clinical Research in Early Life Adversity, DNA Methylation, and Major Depressive Disorder.Front Genet. 2019 Mar 22;10:229. doi: 10.3389/fgene.2019.00229. eCollection 2019. Front Genet. 2019. PMID: 30984237 Free PMC article. Review.
Cited by
-
B-vac a robust software package for bacterial vaccine design.Sci Rep. 2025 Aug 28;15(1):31745. doi: 10.1038/s41598-025-01201-0. Sci Rep. 2025. PMID: 40877337 Free PMC article.
References
-
- Farah MJ. Socioeconomic status and the brain: prospects for neuroscience-informed policy. Nat Rev Neurosci. 2018. Jul 4;19(7):428–38. - PubMed