[Preprint]. 2023 Dec 23:2023.12.21.572932.
doi: 10.1101/2023.12.21.572932.

DNA-sequence and epigenomic determinants of local rates of transcription elongation

Affiliations

DNA-sequence and epigenomic determinants of local rates of transcription elongation

Lingjie Liu et al. bioRxiv. .

Abstract

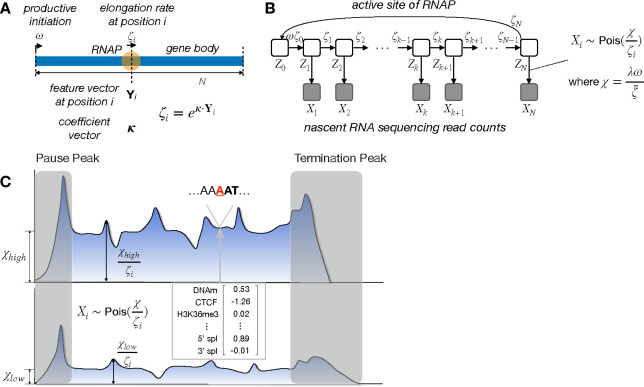
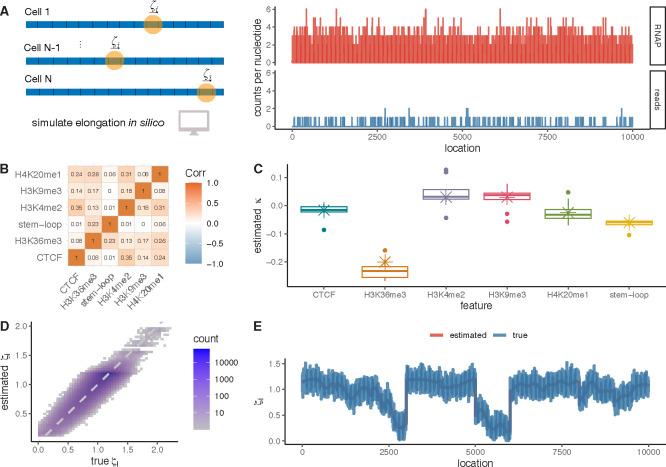
Across all branches of life, transcription elongation is a crucial, regulated phase in gene expression. Many recent studies in eukaryotes have focused on the regulation of promoter-proximal pausing of RNA Polymerase II (Pol II), but rates of productive elongation also vary substantially throughout the gene body, both within and across genes. Here, we introduce a probabilistic model for systematically evaluating potential determinants of the local elongation rate based on nascent RNA sequencing (NRS) data. Our model is derived from a unified model for both the kinetics of Pol II movement along the DNA template and the generation of NRS read counts at steady state. It allows for a continuously variable elongation rate along the gene body, with the rate at each nucleotide defined by a generalized linear relationship with nearby genomic and epigenomic features. High-dimensional feature vectors are accommodated through a sparse-regression extension. We show with simulations that the model allows accurate detection of associated features and accurate prediction of local elongation rates. In an analysis of public PRO-seq and epigenomic data, we identify several features that are strongly associated with reductions in the local elongation rate, including DNA methylation, splice sites, RNA stem-loops, CTCF binding sites, and several histone marks, including H3K36me3 and H4K20me1. By contrast, low-complexity sequences and H3K79me2 marks are associated with increases in elongation rate. In an analysis of DNA k-mers, we find that cytosine nucleotides are strongly associated with reductions in local elongation rate, particularly when preceded by guanines and followed by adenines or thymines. Increases in elongation rate are associated with thymines and A+T-rich k-mers. These associations are generally shared across cell types, and by considering them our model is effective at predicting features of held-out PRO-seq data. Overall, our analysis is the first to permit genome-wide predictions of relative nucleotide-specific elongation rates based on complex sets of genomic and epigenomic covariates. We have made predictions available for the K562, CD14+, MCF-7, and HeLa-S3 cell types in a UCSC Genome Browser track.


Conflict of interest statement

Conflict of Interest The authors declare no competing interests.

Figures

Figure 1:
Figure 1:
A. Conceptual illustration of kinetic model for Pol II movement along DNA template in gene body. At nucleotide site i, local elongation rate ζi is an exponentiated linear function of features Yi and coefficients κ. Promoter-proximal pausing and termination are ignored here. B. Graphical model representation showing unobserved continuous-time Markov chain Zi and observed NRS read counts Xi. C. Conceptual illustration showing that differences in average gene-body read depth are explained by the scaled initiation rate χ, while relative read depth is explained by the generalized linear model for local elongation rate ζi. Read count Xi is assumed to be Poisson distributed with mean χζi. Pause and termination peaks are omitted.
Figure 2:
Figure 2:
A. The SimPol simulator tracks the movement of virtual polymerases across DNA templates in a population of cells (left). Once an equilibrium is reached, read counts per site are sampled in proportion to the simulated Pol II density, such that the average read depth is matched to real PRO-seq data (right). B. Correlation map of selected epigenomic features for simulations (Spearman’s ρ). C. Box plots for estimated coefficients κ in ten replicates compared with ground truth in simulations (crosses). D. Estimated vs. true nucleotide-specific elongation rates ζi across all simulated TUs r2=0.748. E. Estimated vs. true nucleotide-specific elongation rates ζi along an individual TU in ten replicates r2=0.869.
Figure 3:
Figure 3:
A. Estimated coefficients κ for the twelve epigenomic features considered, based on PRO-seq data for K562 cells [26]. Sign indicates direction and absolute value indicates strength of correlation with local elongation rate. Error bars indicate one standard error in each direction. B. Ratio of relative average PRO-seq read depth in regions covered by each feature to that in regions not covered by it (see text). C. Metaplot of relative read depths centered on four selected features. Dashed line represents average across all gene bodies. D. Estimated vs. true locations of pausing locations within gene bodies (see text) r2=0.60. E. Predicted vs. true PRO-seq read depths Xi for held-out data averaged over 1kb intervals for all TUs r2=0.28.
Figure 4:
Figure 4:
A. Estimated vs. true nucleotide-specific elongation rates ζi in ten rounds of simulated k-mer data r2=0.89. B. Estimated coefficients κ for top k-mers (k5) based on PRO-seq data for K562 cells [26]. Sign indicates direction and absolute value indicates strength of correlation with local elongation rate. Error bars indicate one standard error in each direction. C. Ratio of relative average PRO-seq read depth at sites associated with each k-mer to that at sites not associated with it (see text). D. Metaplot of relative read depths for three k-mers with positive coefficients (top) and three with negative coefficients (bottom). E. Metaplot of relative read depths for six k-mers having coefficients close to zero. F. Sequence logos summarizing clusters of 5-mers five nucleotides centered on the active site that are positively (left) or negatively (right) associated with elongation rate.
Figure 5:
Figure 5:
A. Estimated coefficients κ for twelve epigenomic features based on PRO-seq data for four mammalian cell lines: K562 [26], CD14+ [31], HeLa-S3 [41], and MCF-7 [40]. Sign indicates direction and absolute value indicates strength of correlation with local elongation rate. Error bars indicate one standard error in each direction. B. Estimated coefficients κ for top k-mers (k5) in the same cell lines. C. Sequence logos summarizing clusters of 5-mers five nucleotides upstream of the active site that are positively (left) or negatively (right) associated with elongation rate (see Methods).
Figure 6:
Figure 6:
Screenshot from UCSC Genome Browser track showing predicted local elongation rates for the K562, CD14+, HeLa-S3, and MCF-7 cell types in a region of the RAB10 gene. These predictions are based on the combined k-mer and epigenomic model, but tracks are also available for the epigenomic model only. Notice the elevated predicted rates at poly-T sequences, the reductions at cytosines, and the general reduction throughout the exon.

Similar articles

References

    1. Cramer P. Organization and regulation of gene transcription. Nature 573, 45–54 (2019). - PubMed
    1. Svejstrup J. Q. The RNA polymerase II transcription cycle: cycling through chromatin. Biochim Biophys Acta 1677, 64–73 (2004). - PubMed
    1. Adelman K. & Lis J. T. Promoter-proximal pausing of RNA polymerase II: emerging roles in meta-zoans. Nat Rev Genet 13, 720–731 (2012). - PMC - PubMed
    1. Jonkers I. & Lis J. T. Getting up to speed with transcription elongation by RNA polymerase II. Nat Rev Mol Cell Biol 16, 167–177 (2015). - PMC - PubMed
    1. Danko C. G. et al. Signaling pathways differentially affect RNA polymerase II initiation, pausing, and elongation rate in cells. Mol. Cell 50, 212–222 (2013). - PMC - PubMed

Publication types