[Preprint]. 2024 Jun 12:2023.12.21.572875.
doi: 10.1101/2023.12.21.572875.

Structure of the human systemic RNAi defective transmembrane protein 1 (hSIDT1) reveals the conformational flexibility of its lipid binding domain

Affiliations

Structure of the human systemic RNAi defective transmembrane protein 1 (hSIDT1) reveals the conformational flexibility of its lipid binding domain

Vikas Navratna et al. bioRxiv. .

Update in

Abstract

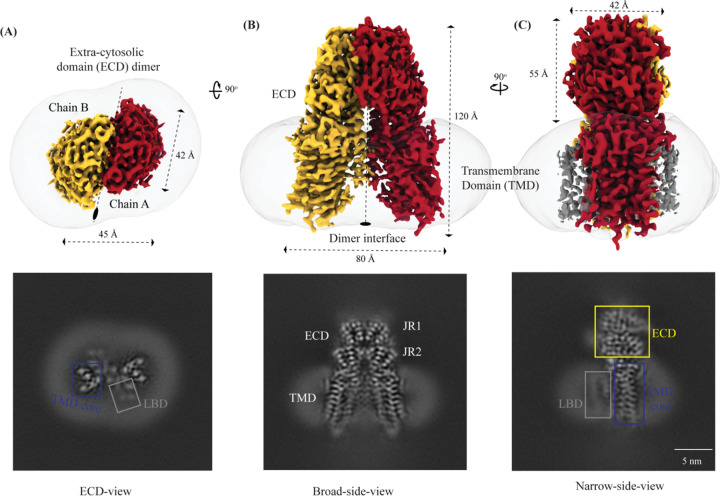
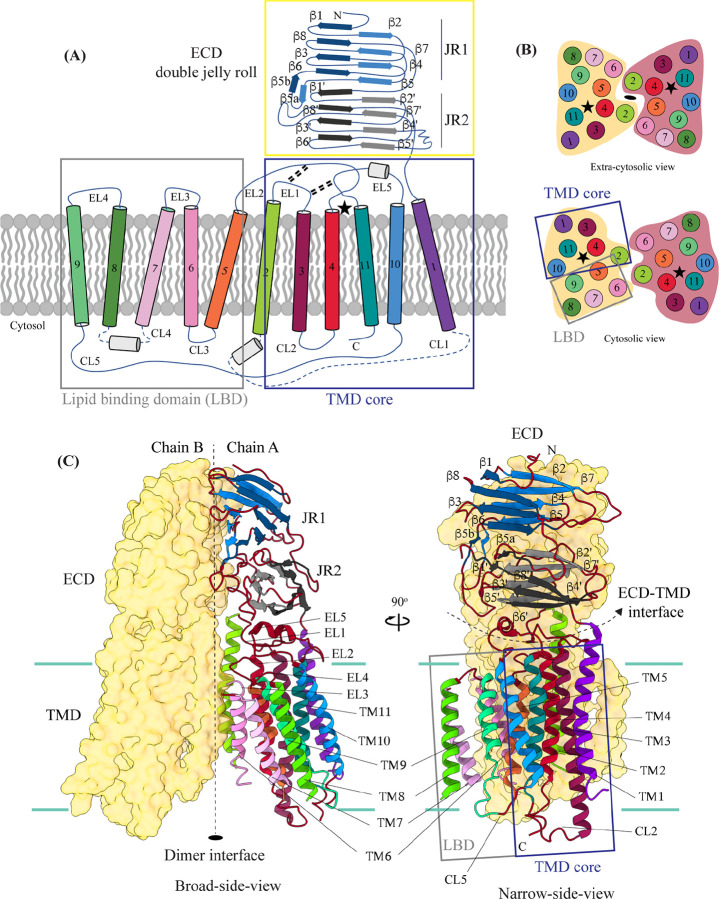
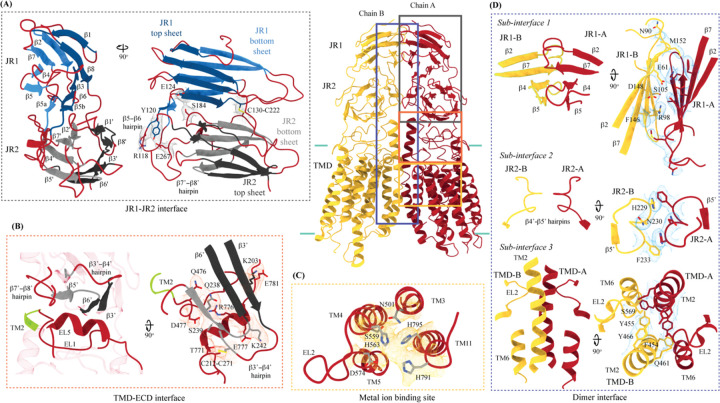
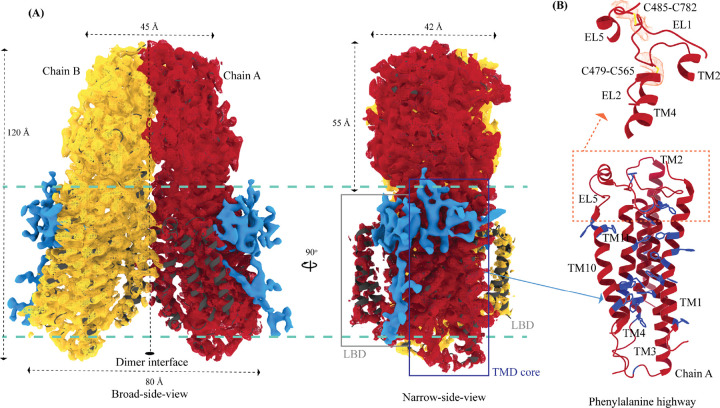
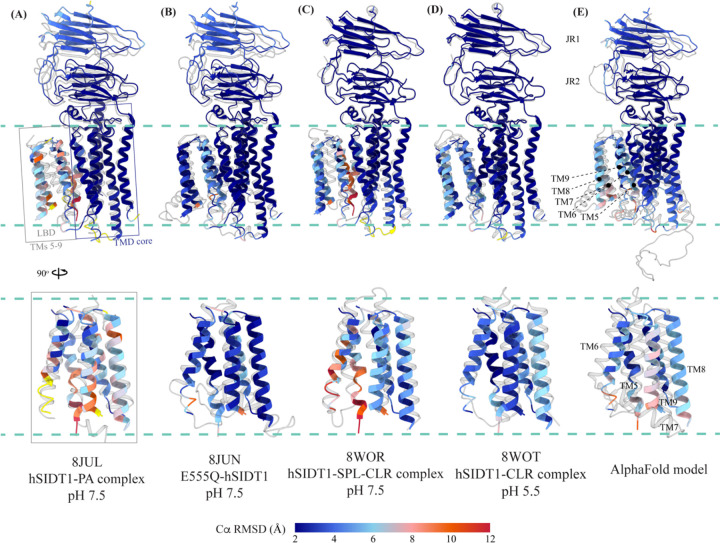
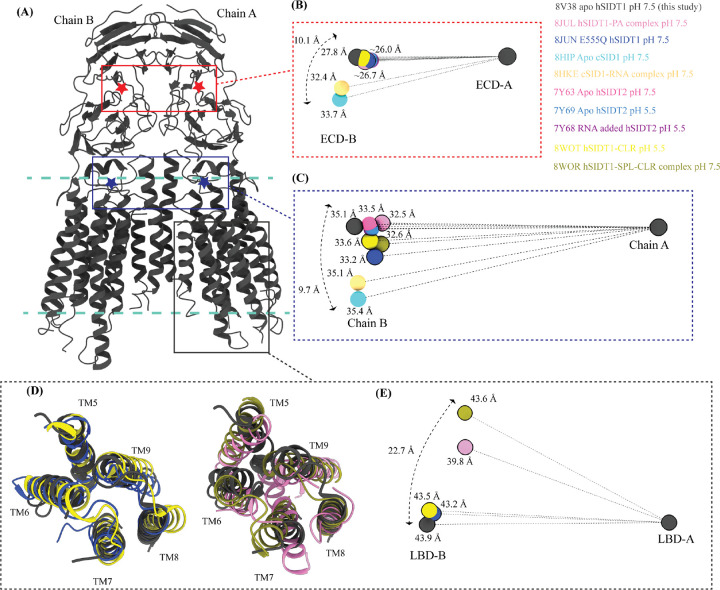
In C. elegans, inter-cellular transport of the small non-coding RNA causing systemic RNA interference (RNAi) is mediated by the transmembrane protein SID1, encoded by the sid1 gene in the systemic RNA interference-defective (sid) loci. SID1 shares structural and sequence similarity with cholesterol uptake protein 1 (CHUP1) and is classified as a member of the cholesterol uptake family (ChUP). Although systemic RNAi is not an evolutionarily conserved process, the sid gene products are found across the animal kingdom, suggesting the existence of other novel gene regulatory mechanisms mediated by small non-coding RNAs. Human homologs of sid gene products - hSIDT1 and hSIDT2 - mediate contact-dependent lipophilic small non-coding dsRNA transport. Here, we report the structure of recombinant human SIDT1. We find that the extra-cytosolic domain (ECD) of hSIDT1 adopts a double jelly roll fold, and the transmembrane domain (TMD) exists as two modules - a flexible lipid binding domain (LBD) and a rigid TMD core. Our structural analyses provide insights into the inherent conformational dynamics within the lipid binding domain in cholesterol uptake (ChUP) family members.


Conflict of interest statement

Conflict of interest The authors declare no conflict of interest.

Figures

Figure 1:
Figure 1:. Cryo-EM structure of hSIDT1 dimer
Panels (A), (B), and (C) show the extra-cytosolic domain (ECD) view, broad-side-view, and narrow-side-view respectively, of the ~3.4 Å cryo-EM map of hSIDT1 dimer. Chain A and B are displayed in red and yellow, respectively, at an isosurface threshold level of 0.14 in ChimeraX [60]. The noncontiguous density of lipid binding domain (LBD) is highlighted as a gray mesh in panel (C). Micelle is shown in transparent gray. The bottom half of panels A-C show cross-sections of the final 3D map from CryoSPARC, in three views, displayed using IMOD, indicating the poor resolution of the lipid binding domain (LBD, gray box) compared to the transmembrane domain core (TMD core, blue box) or ECD [52, 62].
Figure 2:
Figure 2:. Topology and architecture of hSIDT1
(A) 2D topology of the ChUP family of proteins. Transmembrane helices (TMs) that form the LBD are highlighted in a gray box, the TMs that form the TMD core in a blue box, and the ECD in a yellow box. The ECD forms a double jelly roll where each jelly roll (JR1 and JR2) is a β-sandwich made of two 4-stranded anti-parallel β-sheets. The cytosolic loops (CLs) and the extra-cytosolic loops (ELs) are numbered based on the primary structure. (B) The TMD dimer is depicted as cartoon, showing the TM arrangement as seen from extra-cytosolic side and the cytosol. The star indicates the metal ion binding site. (C) Two side-views of hSIDT1 highlight the dimer interface and ECD-TMD interface. Chain B is displayed as a surface, and chain A is shown as a cartoon with β-strands and TMs colored as they are in the topology diagram. The two-fold rotation axis is displayed as a dashed line with an ellipsoid.
Figure 3:
Figure 3:. Inter-chain and intra-chain interactions of hSIDT1
Chain A and B are displayed in red and yellow, respectively, at the center. The lipid bilayer is highlighted as cyan bars. The regions highlighted in the panels A-D have been indicated on the overall structure with boxes - gray for the JR1-JR2 interface, yellow for the metal ion binding site, orange for the ECD-TMD interface, and blue for the dimer interface. The densities for interactions have been displayed in colors that match their inset highlights (isosurface threshold level of 0.25 for the ECD region and 0.1 for the TMD region in ChimeraX). (A) Double jelly roll arrangement of the ECD and the interactions that stabilize JR1 atop JR2. (B) Interaction of JR2 with the ECD face of the TMD core allows the ECD to seclude the TMD core from extra-cytosolic space. (C) Ensconced within the TMD core is the evolutionarily conserved metal ion binding site, which is highlighted in yellow. Side chains of amino acids that carve the metal coordination site have been highlighted. (D) Three sub-interfaces of the dimer interface, each made by JR1, JR2, and TMD, respectively, have been highlighted in the blue inset.
Figure 4:
Figure 4:. Potential lipid binding sites
(A) Ordered lipid or detergent density observed in the final cryo-EM map is displayed in blue, and density for chain A and chain B are shown in red and yellow respectively (isosurface threshold level of 0.12 of the C2 refine map as mesh in ChimeraX). We have not modeled either lipid or digitonin in the blue density because we observe relatively poor local resolution for LBD and the LBD-TMD core interface. (B) The TMD core harbors the phenylalanine highway and metal ion binding site. Highlighted in blue are the phenylalanine residues, primarily from TM11 and TM1, that indicate the presence of phenylalanine highway motif in hSIDT1, as observed in other cholesterol transporters such as ABCG1, NPC1, and PTCH1. The dashed orange inset highlights the disulfides that stabilize EL1, EL2, and EL5 of the TMD core towards the ECD-TMD interface.
Figure 5:
Figure 5:. Comparison of intra-chain dynamics in various hSIDT1 structures
We used sequence-based pairwise alignment in ChimeraX to color hSIDT1 structure in this study using the Cα RMSD obtained upon aligning it with various structures (Table S2). The TMD core of chain A from all the structures was used for alignments. The color key denotes the range of Cα RMSD of the pairwise alignments, with blue for the lowest RMSD, red highest, and yellow for regions missing from the alignment. Each of the panels show chain A of apo hSIDT1 (8V38) colored based on the RMSDs of alignments with (A) hSIDT1-PA complex at pH 7.5 (8JUL), (B) E555Q-hSIDT1 at pH 7.5 (8JUN), (C) hSIDT1-SPL-CLR complex at pH 7.5 (8WOR), and (D) hSIDT1- CLR complex at pH 5.5 (8WOT). Panel (E) shows superposition with AlphaFold model of hSIDT1 [33, 34]. All the structures used for superposition with apo hSIDT1 (8V38) have been displayed in gray with their respective PDB IDs indicated below each panel. Based on the alignments, the LBD dynamics do not appear to be determined by CLR binding or change in pH.
Figure 6:
Figure 6:. Inter-chain dynamics in hSIDT1
(A) hSIDT1 dimer (gray) with ECD (red star) center of masses (COMs) and full chain COMs (blue star) highlighted by red and blue boxes. The distances on the spheres in panels B, C, and E denote the distances of COMs of the regions being compared in chain B (ECD-B and LBD-B) from COMs of that region in superposed chain A (ECD-A and LBD-A). The spheres representing all SIDT1 structures have been highlighted with a black border. The double-ended arrow denotes the distance chain B COM of that region has moved relative to 8V38 (gray sphere) chain B COM, when chain As of the structures were superposed. (B) The relative position of the COMs of chain B ECDs of the homologs compared to hSIDT1 from this study (8V38; gray sphere). The relative positions of these COMs were calculated by superposing the chain A ECDs of all the homologs. (C) The relative position of the COMs of the entire chain B of the homologs compared to COM of chain B of 8V38 was calculated by superposing the chain A of all the homologs. In panels (B), (C), and (E) only 8V38 chain A COM is displayed for clarity. Panels (D) & (E) are ECD-views of LBDs of various hSIDT1 structures. In panel D we see superpositions of the LBDs of chain A of various hSIDT1 structures. In panel E the center of masses of LBD regions of chain B (LBD-B) of hSIDT1 structures are compared upon superposition of LBD of chain A (LBD-A). Relative to LBD-A the phospholipid bound hSIDT1 structures, 8JUL and 8WOR, shows highest outward motion from the plane of dimer.

Similar articles

References

    1. Fire A, Xu S, Montgomery MK, Kostas SA, Driver SE, Mello CC. Potent and specific genetic interference by double-stranded RNA in Caenorhabditis elegans. Nature. 1998;391(6669):806–11. doi: 10.1038/35888. - DOI - PubMed
    1. Tabara H, Grishok A, Mello CC. RNAi in C. elegans: soaking in the genome sequence. Science. 1998;282(5388):430–1. doi: 10.1126/science.282.5388.430. - DOI - PubMed
    1. Timmons L, Fire A. Specific interference by ingested dsRNA. Nature. 1998;395(6705):854. doi: 10.1038/27579. - DOI - PubMed
    1. Lucas T, Bonauer A, Dimmeler S. RNA Therapeutics in Cardiovascular Disease. Circ Res. 2018;123(2):205–20. doi: 10.1161/CIRCRESAHA.117.311311. - DOI - PubMed
    1. Chernikov IV, Vlassov VV, Chernolovskaya EL. Current Development of siRNA Bioconjugates: From Research to the Clinic. Front Pharmacol. 2019;10:444. Epub 20190426. doi: 10.3389/fphar.2019.00444. - DOI - PMC - PubMed

Publication types