[Preprint]. 2023 Dec 18:2023.12.18.572239.
doi: 10.1101/2023.12.18.572239.

Branched-chain keto acids promote an immune-suppressive and neurodegenerative microenvironment in leptomeningeal disease

Affiliations

Branched-chain keto acids promote an immune-suppressive and neurodegenerative microenvironment in leptomeningeal disease

Mariam Lotfy Khaled et al. bioRxiv. .

Abstract

Leptomeningeal disease (LMD) occurs when tumors seed into the leptomeningeal space and cerebrospinal fluid (CSF), leading to severe neurological deterioration and poor survival outcomes. We utilized comprehensive multi-omics analyses of CSF from patients with lymphoma LMD to demonstrate an immunosuppressive cellular microenvironment and identified dysregulations in proteins and lipids indicating neurodegenerative processes. Strikingly, we found a significant accumulation of toxic branched-chain keto acids (BCKA) in the CSF of patients with LMD. The BCKA accumulation was found to be a pan-cancer occurrence, evident in lymphoma, breast cancer, and melanoma LMD patients. Functionally, BCKA disrupted the viability and function of endogenous T lymphocytes, chimeric antigen receptor (CAR) T cells, neurons, and meningeal cells. Treatment of LMD mice with BCKA-reducing sodium phenylbutyrate significantly improved neurological function, survival outcomes, and efficacy of anti-CD19 CAR T cell therapy. This is the first report of BCKA accumulation in LMD and provides preclinical evidence that targeting these toxic metabolites improves outcomes.

Keywords: Brain; Branched-chain keto acids; CSF; Leptomeninges.


Conflict of interest statement

IS, MLK, YR, RK, OO, HA, TR, BE, GCW, ZC, YAC, ML, LNFD, SAC, PAS, and VI declare no relevant conflicts of interest. MDJ would like to disclose consultancy for Kite/Gilead and Novartis and research funding from Kite/Gilead, Incyte, and Loxo@Lilly. PAF would like to disclose consultancy with AbbVie Inc., Bristol-Myers Squibb, Boehringer-Ingelheim, NCI Neuro-Oncology Branch Peer Review, NCRI, NIH, Novellus, Physical Sciences Oncology Network, Tocagen (not active), Ziopharm, National Brain Tumor Society. He is also on the advisory board for Bayer, BTG, GlaxoSmithKline (GSK), Inovio, Novocure, AnHeart Therapeutics, and Midatech. MH would like to disclose that Moffitt Cancer Center has licensed Intellectual Property (IP) related to the proliferation and expansion of tumor-infiltrating lymphocytes (TILs) to Iovance Biotherapeutics. MH is a co-inventor on such Intellectual Property. MH reports common stock holdings in AbbVie, Inc., Amgen, Inc., BioHaven Pharmaceuticals, and Bristol Myers Squibb. SPT would like to disclose that Moffitt Cancer Center has licensed Intellectual Property (IP) related to the proliferation and expansion of tumor-infiltrating lymphocytes (TILs) to Iovance Biotherapeutics. Moffitt has also licensed IP to Tuhura Biopharma. Dr. Pilon-Thomas (SPT) is an inventor on such Intellectual Property. SPT is listed as a co-inventor on a patent application with Provectus Biopharmaceuticals. SPT participates in sponsored research agreements with Provectus Biopharmaceuticals, Iovance Biotherapeutics, Intellia Therapeutics, Dyve Biosciences, Turnstone Biologics, and Celgene that are not related to this research. SPT has received research support that is not related to this research from the following entities: NIHNCI, DOD, Swim Across America, the V Foundation, and The Mark Foundation for Cancer Research. SPT has received consulting fees from Seagen Inc., Morphogenesis, Inc., and KSQ Therapeutics. FLL would like to disclose the following: Scientific Advisory Role/Consulting Fees: A2, Allogene, Amgen, Bluebird Bio, BMS, Calibr, Caribou, Cowen, EcoR1, Gerson Lehrman Group (GLG), Iovance, Kite Pharma, Janssen, Legend Biotech, Novartis, Sana, Umoja, Pfizer. Data Safety Monitoring Board: Data and Safety Monitoring Board for the NCI Safety Oversight CAR T-cell Therapies Committee. Research Contracts or Grants to my Institution for Service: Kite Pharma (Institutional), Allogene (Institutional), CERo Therapeutics (Institutional), Novartis (Institutional), BlueBird Bio (Institutional), 2SeventyBio (Institutional), BMS (Institutional), National Cancer Institute (R01CA244328 MPI: Locke; P30CA076292 PI: Cleveland), Leukemia and Lymphoma Society Scholar in Clinical Research (PI: Locke). Patents, Royalties, Other Intellectual Property: Several patents held by the institution in my name (unlicensed) in the field of cellular immunotherapy. Education or Editorial Activity: Aptitude Health, ASH, BioPharma Communications CARE Education, Clinical Care Options Oncology, Imedex, Society for Immunotherapy of Cancer

Figures
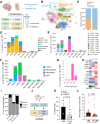
Figure 1:
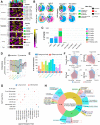
Figure 1:. The cellular landscape of leptomeningeal lymphoma.
A.Schematic illustration demonstrating the CSF sampling from lymphoma-LMD patients, treatments received at the time of collection, and the patient’s survival time. CSF from non-LMD were also collected as controls. B.Uniform manifold approximation and projection (UMAP) plot of all cell populations in all CSF specimens. C.The proportion of myeloid cells, B cells, and non-B cell lymphocytes in lymphoma LMD versus non-LMD CSF samples. D.The number of cells from the main cell types in 7mL of lymphoma-LMD and non-LMD CSF. E.The number of T and NK cells from each of the 11 clusters identified in each 7mL of lymphoma-LMD and non-LMD CSF. F.The number of myeloid cells from each of the 4 clusters identified in 7mL of lymphoma LMD and non-LMD CSF. G.The number of macrophages in each 7mL CSF sample from lymphoma LMD. H.Expression of key markers of different macrophage activation states to classify macrophage subclusters into C1, C2, and C3. I.Percentage of each macrophage subcluster (identified in H) according to prognosis. J.Outline of the cell injections and sample collection for single-cell RNAseq of tissues from animal models of LMD. K.Macrophages as a percentage of total cells identified using scRNAseq of leptomeningeal layer vs. extracranial metastatic mouse tissues from each of the breast, melanoma, and lymphoma models. Bars represent mean ± SEM. L.Bar graph showing the abundance of macrophages (as a percentage of total cells) identified by scRNAseq in CSF samples from melanoma LMD patients versus tissues from non-LMD tumor sites of melanoma patients.
Figure 2.
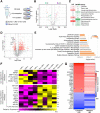
Figure 2.. The cellular microenvironment of lymphoma LMD is immune-suppressive.
A.Heat map showing the expression of key markers used to assign functional/activation groups to each of the 11 T and NK cell clusters. B.Pie charts show the distribution of each T/NK cluster in lymphoma LMD and non-LMD samples. The colored halo indicates the predicted functional status of each T/NK cell based on gene expression profiles. C.The number of cells found in each of the seven subpopulations of B cells in 7mL of CSF from lymphoma LMD and non-LMD patients. D.Back-to-back bar plots show the direction of interaction per cell type, comparing the patients with a long survival (positive axis) vs. short survival (negative axis). E.The bar plot shows the number of interactions per cell type in the patients with long survival and short survival. F.Radar plot demonstrating the communication between a specific cell type and all other cell types, comparing the patients with long survival (blue) vs. short survival (red). G.Dot blot for selected unique ligand-receptor pairs to each condition. All the unique ligandreceptor pairs for different cell type pairs are shown in Supplementary Tables 6 and 8. H.Sunburst plot for cytokine signaling pathways as the most significant functional term based on only the unique ligand-receptor in patients with short survival. The width of each section represents the relative fraction of interactions (weighted by score) enriched in that cell type. Boxes show specific int-pairs enriched for the corresponding cluster pairs. All unique, condition-specific functional terms are shown in Supplemental Tables 5 & 7. Plots in D, E, F, G, and H were generated in InterCellar’s multiple conditions module.
Figure 3.
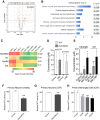
Figure 3.. Proteomic and lipidomic characterization of LMD tumor microenvironment.
A.Schematic illustration outlining the multi-omic analysis and the number of identified lipids, metabolites, and proteins in the CSF. Percentages indicate differential expression between lymphoma-LMD and non-LMD controls. B.Volcano plots show differentially abundant lipids in the CSF of lymphoma patients with LMD compared to no LMD controls. The significantly altered abundance of lipids in the lysophosphatidylcholine (LPC) lipid class is denoted in purple, and the significantly altered abundance of lipids in the phosphatidylethanolamine (PE) lipid class is denoted in green. C.The number of lipids identified to have significant changes in abundance in lymphoma LMD compared to non-LMD control for each lipid class. D.Volcano plots show differentially abundant proteins in the CSF of lymphoma patients with LMD compared to non-LMD controls. E.Pathway enrichment analysis of the differentially expressed proteins using Ingenuity Pathway Analysis. F.Heatmap showing the individual relative expression of neurodegenerative disease-associated proteins in lymphoma-LMD and non-LMD. Statistical significance was assessed using Welch’s t-test. G.Heat map showing the top upregulated and downregulated proteins in CSF from lymphoma LMD and their expression in melanoma LMD, highlighting the equivalent processes of complement activation and neurodegeneration in LMD regardless of the primary tumor type.
Figure 4.
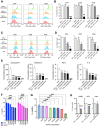
Figure 4.. The metabolic environment of LMD is characterized by BCKA accumulation.
A.Volcano plots show differentially abundant metabolites in the CSF of lymphoma patients with LMD compared to non-LMD controls. α-keto-isocaproic/ α-keto-β methyl valeric (KIC/KMV) isomers show the highest upregulated fold change. B.Pathway enrichment analysis of the differentially abundant metabolites using MetaboAnalyst 5.0 bioinformatics tool. C.Heatmap for the individual relative expression of branched-chain amino acids and branched chain-keto acids in lymphoma-LMD and non-LMD measured by mass spectrometry. D.The absolute concentration of branched-chain ketoacids in lymphoma-LMD vs.non-LMD measured by mass spectrometry. E.The absolute concentration of branched-chain ketoacids in breast cancer LMD and melanoma-LMD vs. non-LMD measured by mass spectrometry. F.MTT assay measuring metabolic activity of primary murine neurons in response to BCKA exposure in neuronal culture media for seven days. G.MTT assay measuring metabolic activity of primary murine neurons in response to BCKA exposure in physiological CSF for seven days. H.MTT assay measuring metabolic activity of primary human meningeal cells in response to BCKA exposure in physiological CSF for 72 hours. Data represent mean ± SEM (panels D, E, F, G, and H). Statistical significance was assessed using Welch’s t-test (C) and Student’s t-tests (panels D, E, F, G, and H). Significance is denoted as *p < 0.05, **p < 0.01, ***p < 0.001, ****p < 0.0001, ns = not significant.
Figure 5.
Figure 5.. Impact of BCKA on T-cell viability and function
A.Representative proliferation plots of cell-trace violet labeled T-cells after OKT3, CD28, and IL-2 stimulation in full media with different concentrations of BCKAs or PBS (control). The experiment was repeated using three different PBMC donors. B.The percentage of T cell division was calculated from panel A using FlowJo. C.Representative proliferation plots of cell-trace violet labeled T-cells after OKT3, CD28, and IL-2 stimulation in physiological CSF with different concentrations of BCKAs or PBS (control). The experiment was repeated using three individual PBMC donors. D.The percentage of T-cell division was calculated from panel C using FlowJo. E.ELLA assays measuring the abundance of pro-inflammatory cytokines secreted from T-cells cultured in physiological CSF. This experiment was repeated with technical and biological triplicates using three different PBMC donors. F.Viability of human T-cells measured by Calcein AM staining in response to different concentrations of α-ketoisocaproic acid (KIC) or the three branched-chain keto acids (BCKA, at physiological ratio) in physiological CSF for 48 hours. This experiment was repeated twice using independent PBMC donors. G.Viability of human anti-CD19 CART-cells measured by Calcein AM staining in response to different concentrations of branched-chain keto acids (BCKA) in physiological CSF for 72 hours. This experiment was repeated using two independent PBMC donors. H.ELLA assays measuring the abundance of pro-inflammatory cytokines secreted from human anti-CD19 CART-cells cultured in physiological CSF. This experiment was repeated with technical triplicates and biological duplicates using two different PBMC donors. Data represent mean ± SD (panels B, D, E, F, G, and H). Statistical significance was assessed using Student’s t-test (B, D, E, F, G, H). *p < 0.05, **p < 0.01, ***p < 0.001, ****p < 0.0001, ns = not significant.
Figure 6.
Figure 6.. Neurodegenerative pathology of LMD
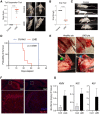
A.Tail suspension scoring for control PBS-injected mice vs. A20-injected lymphoma LMD mice. B.Grip strength assessing fore limb function for control PBS injected mice vs. A20 injected lymphoma LMD mice. C.Manifestation of kyphosis and loss of grooming in control PBS-injected mice vs. A20 injected lymphoma LMD mice. D.Kaplan-Meier analysis for probability of survival in control PBS injected mice vs. A20 injected lymphoma LMD mice. The p-value was calculated using the Log-Rank (Mantel-Cox) test. E.Images show a healthy, transparent pia membrane in the healthy control animals (green arrow) and a lack of this membrane in the LMD animals. LMD animals show significant tumor deposits instead (blue arrow). F.Immunofluorescent images of microtubule-associated protein 2 (MAP2, red) and DAPI (blue) in the brain hippocampus of LMD-lymphoma model. The top images show low magnification (scale bar is 400 μm), and the bottom images show high magnification of outlined areas. The scale bar is 400 μ m. Staining was repeated on four sections from different mice. G.Quantification of BCKA levels in brains of control and LMD-lymphoma model. Levels are calculated as ng/μg tissue using mass spectrometry. Data represent mean ± SEM (panels A, B, and G). Statistical significance was assessed using the Student’s t-test. Statistical tests were two-sided. ****P < 0.0001, ns = not significant.
Figure 7.
Figure 7.. Sodium phenylbutyrate improves neurological functions and survival outcomes in lymphoma LMD mouse model.
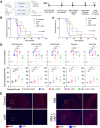
A.Schematic illustration for the in vivo experimental strategy showing the four LMD (A20 cell line injected) groups (left) and the timeline of tumor injections and the administered therapy (right). B.Kaplan Meier graph showing the progression-free survival for all mice. Progression was diagnosed in mice who scored a two or higher in any neurological assessment (motor function, tail suspension, kyphosis). The p-value was calculated using the Log-Rank (Mantel-Cox) test. C.Kaplan Meier graph showing the overall survival for all mice. The p-value was calculated using the Log-Rank (Mantel-Cox) test. D.Individual graphs showing the individual scores for each neurological assessment at endpoint (or last assessment before death), top. Individual graphs showing the number of days until mice displayed a score of 2+ for each assessment, paralysis or death, bottom. E.Immunofluorescent images of microtubule-associated protein 2 (MAP2, red) and DAPI (blue) in the brain hippocampus of the lymphoma LMD model. The left images show low magnification (scale bar is 400 μm), and the right images show high magnification of outlined areas. Staining was repeated on four sections from different mice. Data represent mean ± SE (D). Statistical significance was assessed using the Log-rank test (B, C) and Student t-test (D). *P < 0.05, **P < 0.01, ***P < 0.001, ****P < 0.0001, ns = not significant.

Similar articles

Cited by

  • Leptomeningeal metastatic disease: new frontiers and future directions.
    Ozair A, Wilding H, Bhanja D, Mikolajewicz N, Glantz M, Grossman SA, Sahgal A, Le Rhun E, Weller M, Weiss T, Batchelor TT, Wen PY, Haas-Kogan DA, Khasraw M, Rudà R, Soffietti R, Vollmuth P, Subbiah V, Bettegowda C, Pham LC, Woodworth GF, Ahluwalia MS, Mansouri A. Ozair A, et al. Nat Rev Clin Oncol. 2025 Feb;22(2):134-154. doi: 10.1038/s41571-024-00970-3. Epub 2024 Dec 9. Nat Rev Clin Oncol. 2025. PMID: 39653782 Review.

References

    1. Bönig L. et al. Leptomeningeal Metastasis: The Role of Cerebrospinal Fluid Diagnostics. Front Neurol 10, 839 (2019). 10.3389/fneur.2019.00839 - DOI - PMC - PubMed
    1. Chamberlain M. C. Leptomeningeal Metastasis. Semin Neurol 30, 236–244 (2010). 10.1055/s-0030-1255220 - DOI - PubMed
    1. Kaplan J. G. et al. Leptomeningeal metastases: comparison of clinical features and laboratory data of solid tumors, lymphomas and leukemias. J Neurooncol 9, 225–229 (1990). 10.1007/bf02341153 - DOI - PubMed
    1. Wasserstrom W. R., Glass J. P. & Posner J. B. Diagnosis and treatment of leptomeningeal metastases from solid tumors: experience with 90 patients. Cancer 49, 759–772 (1982). 10.1002/1097-0142(19820215)49:4<759::aidcncr2820490427>3.0.co;2-7 - DOI - PubMed
    1. Groves M. D. Leptomeningeal Disease. Neurosurgery Clinics 22, 67–78 (2011). 10.1016/j.nec.2010.08.006 - DOI - PubMed

Publication types